

About Tatau Kahukura
Tatau Kahukura: Māori Health Chart Book 2024 provides reliable and easy-to-access statistical information on key Māori health indicators.
You can use this online version or download the publication and data tables (PDF, DOCX – both include lists of tables and figures, XLS).
Manakotanga Acknowledgements
This update was commissioned and produced by the Māori Health Directorate - Te Pou Hauora Māori at the Ministry of Health - Manatū Hauora.
Te Pou Hauora Māori would like to thank the following teams for their help in the production of this update. From Manatū Hauora: the Health Survey team and the Insights and Modelling team, and from Health New Zealand - Te Whatu Ora, the National Collections Data Services team.
Whakamōhiotanga Introduction
Tatau Kahukura: Māori Health Chart Book 2024 presents an update of indicators from the 2015 chart book where new data is available. The statistical methods used in the previous chart book to analyse data have been used here too, for consistency. The indicators in this update relate to the socioeconomic determinants of health, risk and protective factors for health, health status, health service use and the health system.
This chart book provides reliable and easy-to-access statistical information on key Māori health indicators. It will be of value to the health sector in policy, research, and service design as well as to the wider social sector. This information will also be helpful for students and the wider community in allowing them to gain a better understanding of Māori health.
We have designed this chart book as a tool for all parts of the health sector. The results presented here highlight the areas in which we need to focus efforts to improve the health of Māori and reduce Māori health inequities. It shows that Māori have higher rates than non-Māori for many health conditions and chronic diseases, including cancer, diabetes, cardiovascular disease and asthma.
We trust this update will be a valuable resource to all those working to deliver pae ora: healthy futures for Māori.
This update and the data tables supporting the figures and text are available on the Ministry of Health’s website.
Ngā tapuae me ngā raraunga Methods and data sources
Numerators
We sourced data in this chart book from the Ministry of Health - Manatū Hauora, the New Zealand Health Survey (NZHS), Health New Zealand - Te Whatu Ora, Stats NZ, the Institute of Environmental Science and Research Limited, the Action on Smoking and Health (ASH) Year 10 Snapshot Survey and the Community Oral Health Service.
Where we used administrative data (ie, national collections and notifications), we aggregated the most recent three years of data to provide stable rate estimates.
Where we used the NZHS, the numerator was the sum of the weights for the respondents in the relevant subgroup (eg, Māori who had diabetes). Further information about survey weights for the NZHS can be found in Methodology Report 2022/23: New Zealand Health Survey (Ministry of Health 2023).
Appendix 1 gives full details of the data sources and the International Statistical Classification of Diseases and Related Health Problems, Tenth Revision, Australian Modification (ICD-10-AM) codes used for data from national collections.
Denominator
We used Stats NZ’s mid-year (at 30 June) estimated resident population as denominator data in the calculation of population rates for deaths, hospitalisations and cancer registrations. We used live births, sourced from Stats NZ, as denominators for rates of infant death and low birthweight.
For NZHS data, the denominator was the sum of the weights for the respondents in the relevant population group (eg, Māori) (Ministry of Health 2023).
Ethnicity classification
Most indicators compare Māori with non-Māori. Unless otherwise stated, all indicators used ethnicity as recorded on the relevant collection or survey. We have noted the method of ethnicity classification under each table or figure in this chart book. In general, we used prioritised ethnicity classification when people identified with more than one ethnic group. We classified a person as Māori if one of their recorded ethnicities was Māori (eg, a person recorded as both Māori and New Zealand European was counted as Māori). We recorded all other people as non-Māori; this represents a comparative or reference group. We counted unknown or missing ethnicity as non-Māori.
Age-standardised rates account for differences in population structure and can be used to compare groups with different age structures, such as Māori and non-Māori. This chart book uses direct age standardisation; most rates (unless noted otherwise) are standardised to the 2001 Census Māori population (see Appendix 2). Most of the indicators are expressed as an age-standardised rate per 100 (ie, a percentage), per 1,000 or per 100,000. We have noted age standardisation under the relevant tables or figures.
Standardising to the 2001 Census Māori population provides rates that more closely approximate the crude Māori rates (ie, the actual rates among the Māori population) than could be provided by other standard populations (eg, the World Health Organization (WHO) World Standard Population), while also allowing comparisons with the non-Māori population. Caution should be taken when comparing data in this chart book with data in reports that use a different standard population.
Where this chart book presents Census data, infectious disease notifications or data for a specific age, crude rates were calculated. Crude rates are the number of events divided by the population and multiplied by 100 in the case of census data to show a percentage and multiplied by 1,000 in the case of infant deaths to show a rate per 1,000. In these cases, caution should be taken when comparing Māori with non-Māori results. Crude rates accurately portray a situation in each population, but make comparisons difficult, because they do not take into account different age distributions in each of the populations (eg, the Māori population is much younger than the non-Māori population).
We did not calculate rates for counts fewer than five in data from national collections, or where the population group being analysed (denominator) comprised fewer than 30 in data from surveys.
Confidence intervals
A confidence interval (CI) gives an indication of uncertainty around a single value (such as an age-standardised rate). They are calculated with a stated probability; in the case of this chart book, 95% (ie, each CI in this chart book has a 95% probability of enclosing the true value).
The CI is influenced by the sample size of the group. As the sample size becomes smaller, the CI becomes wider, and there is less certainty about the rate.
Rate ratios
This chart book uses age-standardised rate ratios to compare age-standardised rates between Māori and non-Māori. The rate ratio (RR) is equal to the age-standardised Māori rate divided by the age-standardised non-Māori rate. Thus, the non-Māori population is used as the reference population. For example, an age-standardised RR of 1.5 means that the rate is 50% higher (or 1.5 times as high) in Māori than in non-Māori, after taking into account the different age structures of these two populations.
Where we used the NZHS, rate ratios are standardised by age and gender for total comparisons and age standardised for gender-specific comparisons (ie Māori females compared to non-Māori females). In these instances, the RR may not equal the age-standardised Māori rate divided by the age-standardised non-Māori rate provided in the tables. Further information about age and gender standardisation for the NZHS can be found in Methodology Report 2022/23: New Zealand Health Survey (Ministry of Health 2023).
The main text of this chart book gives rate ratios and their 95% CIs. In this chart book, if the CI of the rate ratio does not include the number 1, the ratio is said to be statistically significant.
Unless otherwise stated, all differences presented in this chart book are statistically significant.
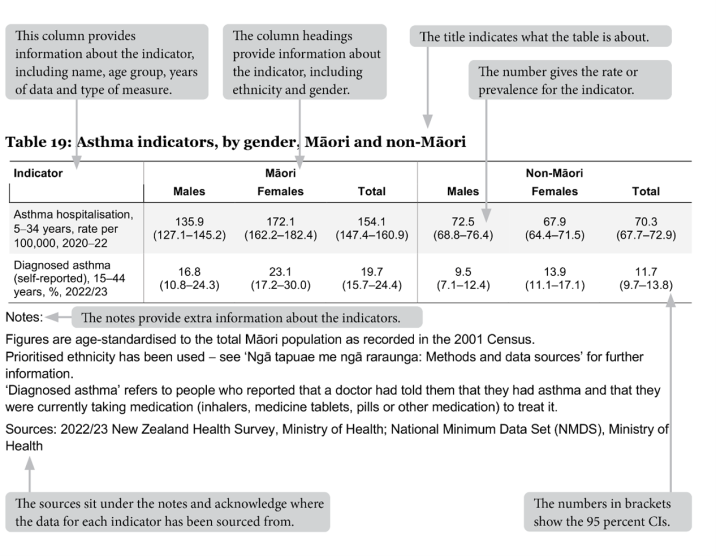
How to interpret results: tables
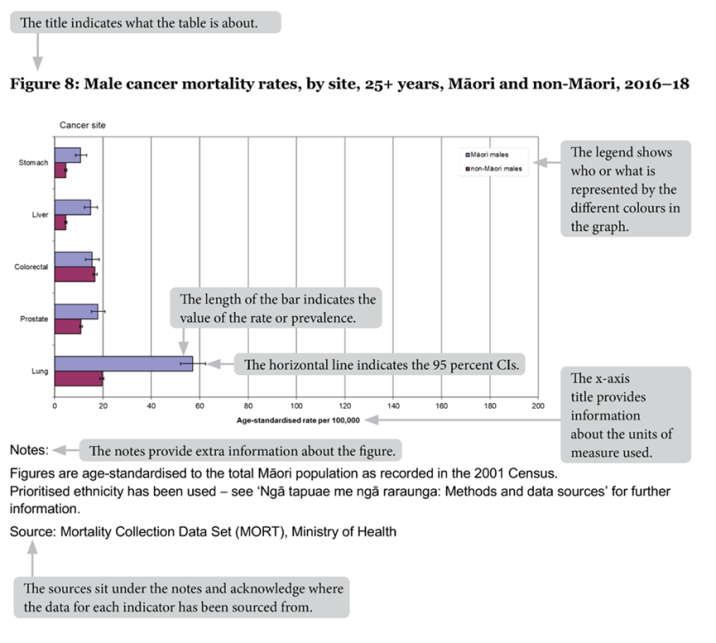
How to interpret results: figures
Tatauranga taupori Demographics
Age structure
| Age group (years) | Māori | Non-Māori | ||||
|---|---|---|---|---|---|---|
Males | Females | Total | Males | Females | Total | |
| 0–14 | 137,780 | 129,680 | 267,450 | 363,210 | 346,300 | 709,510 |
| 15–24 | 81,800 | 77,550 | 159,350 | 261,700 | 244,990 | 506,710 |
| 25–44 | 116,010 | 119,460 | 235,450 | 643,490 | 624,730 | 1,268,240 |
| 45–64 | 84,100 | 90,940 | 175,040 | 542,950 | 564,930 | 1,107,870 |
| 65+ | 30,600 | 36,200 | 66,800 | 380,900 | 431,100 | 812,000 |
| Total | 450,290 | 453,830 | 904,090 | 2,192,250 | 2,212,050 | 4,404,330 |
Notes:
- Due to rounding, individual figures in this table do not add to give the stated totals.
- Prioritised ethnicity has been used – see ‘Ngā tapuae me ngā raraunga: Methods and data sources’ for further information.
Source: Stats NZ, 2023 NZ Population Estimates (downloaded October 2024)
In 2023, Māori comprised 17.0% of the New Zealand population, up from 15.6% in 2013. In 2023, females made up 50.2% of the Māori population, and males 49.8%.
Figures 1 and 2 show that the Māori population is younger overall than the non-Māori population; 29.6% of Māori were aged less than 15 years, compared with only 18.4% of non-Māori. Conversely, 7.4% of Māori were aged 65+ years, compared to 16.6% of non-Māori.
Figure 1: Age distribution of the Māori population, males and females, 2023
Use arrow keys to navigate the key indicator items.
- Download
- Download dataset
Figure 2: Age distribution of the non-Māori population, males and females, 2023
Use arrow keys to navigate the key indicator items.
- Download
- Download dataset
Population projections
| Year | Māori | Non-Māori | ||||
|---|---|---|---|---|---|---|
Males | Females | Total | Males | Females | Total | |
| 2020 | 424,900 | 428,900 | 853,900 | 2,104,250 | 2,132,000 | 4,236,200 |
| 2025 | 465,250 | 468,900 | 934,300 | 2,222,100 | 2,241,450 | 4,463,500 |
| 2030 | 505,600 | 508,800 | 1,014,350 | 2,294,700 | 2,314,850 | 4,609,600 |
| 2035 | 547,150 | 549,550 | 1,096,750 | 2,354,100 | 2,374,700 | 4,728,600 |
| 2040 | 590,150 | 591,650 | 1,181,750 | 2,402,100 | 2,421,050 | 4,823,200 |
Notes:
- Due to rounding, individual figures in this table may not add to give the stated totals.
- Prioritised ethnicity has been used – see ‘Ngā tapuae me ngā raraunga: Methods and data sources’ for further information.
- Figures are sourced from a custom projection by Stats NZ for Health New Zealand | Te Whatu Ora by statistical area 2, age group, gender and ethnicity (prioritised). Projections assume Medium fertility, mortality, annual net migration and medium inter-ethnic mobility. Non-Māori figures have been derived from the total projection less Māori projections.
Source: Stats NZ, Population Projections (2018 Census base) 2023 update, custom Iwi-Māori Partnership Board estimates (currently not publicly available).
Table 2 shows that between 2020 and 2040, the Māori population is projected to grow by 38.4%, whereas the non-Māori population is projected to grow by only 13.9%. The Māori projected population has a much higher growth rate (an average annual increase of 1.9 %) compared with the non-Māori projected population (an average annual increase of 0.7 %).
Several factors drive this higher population growth rate for Māori, including a higher fertility rate for Māori females. In 2018, the Māori total fertility rate[1] was 2.14, compared with 1.75 for New Zealand (Stats NZ, Ethnic fertility rates: 2001, 2006, 2013, 2018 (downloaded April 2023)).
Another factor is that the Māori population has a younger age structure, with a relatively large proportion in the main reproductive ages (15–44 years; see Figure 1). This provides built-in momentum for future population growth (Statistics New Zealand 2005).
[1]The total fertility rate is the average number of live births that a women would have during her life if she experienced the age-specific fertility rates of a given period (usually a year). It excludes the effect of mortality.
Population by iwi-Māori partnership board
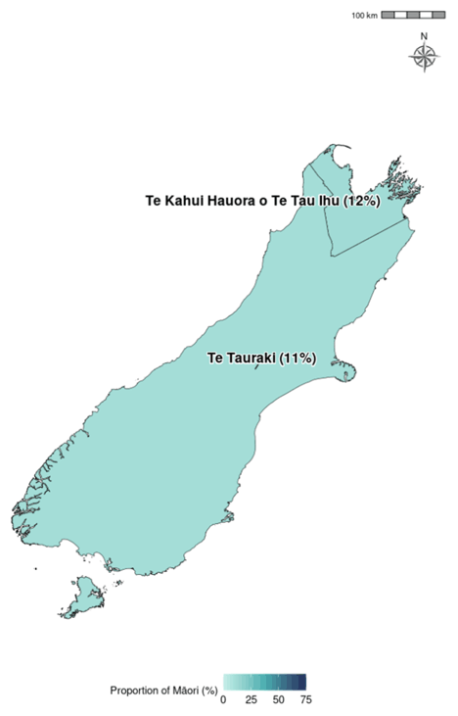
Table 3 presents the Māori and non-Māori populations of each iwi-Māori partnership board (IMPB), by life-cycle age group. Maps showing the proportion of each IMPB’s population that is Māori follows as Figures 3 and 4.
| IMPB | 0–14 years | 15-24 years | 25–44 years | 45–64 years | 65+ years | Total | ||||||
|---|---|---|---|---|---|---|---|---|---|---|---|---|
Māori | Non-Māori | Māori | Non-Māori | Māori | Non-Māori | Māori | Non-Māori | Māori | Non-Māori | Māori | Non-Māori | |
| Te Taumata Hauora o Te Kahu o Taonui | 51,180 | 185,570 | 31,835 | 133,520 | 49,070 | 359,095 | 36,320 | 294,485 | 15,165 | 197,455 | 183,500 | 1,170,550 |
| Ngā Pou Hauora ō Tāmaki Makaurau | 30,625 | 113,520 | 19,575 | 69,880 | 28,610 | 168,430 | 19,740 | 128,675 | 6,560 | 72,465 | 105,100 | 553,100 |
| Te Tiratū | 34,710 | 59,075 | 21,335 | 38,735 | 30,135 | 96,235 | 21,145 | 89,820 | 8,305 | 74,900 | 115,650 | 358,900 |
| Te Moana a Toi | 20,205 | 31,995 | 12,165 | 17,425 | 16,515 | 52,500 | 13,120 | 54,020 | 5,985 | 52,000 | 68,000 | 208,050 |
| Tairāwhiti Toitū Te Ora | 8,040 | 3,690 | 4,435 | 2,155 | 7,795 | 5,745 | 6,555 | 6,570 | 3,435 | 5,915 | 30,300 | 24,100 |
| Te Taura Ora o Waiariki | 9,230 | 7,210 | 5,670 | 4,240 | 8,655 | 12,425 | 6,930 | 12,285 | 2,650 | 9,730 | 33,150 | 45,900 |
| Tūwharetoa | 3,770 | 4,325 | 2,070 | 2,355 | 3,470 | 6,475 | 2,900 | 8,020 | 1,235 | 8,050 | 13,450 | 29,250 |
| Te Punanga Ora | 8,695 | 16,835 | 5,290 | 9,450 | 6,865 | 24,900 | 5,225 | 27,485 | 2,205 | 22,915 | 28,300 | 101,750 |
| Te Mātuku | 6,155 | 7,290 | 3,280 | 4,590 | 5,445 | 10,825 | 4,120 | 13,635 | 1,835 | 13,310 | 20,850 | 49,750 |
| Tihei Takitimu | 15,670 | 20,215 | 9,230 | 11,925 | 13,380 | 32,435 | 10,425 | 36,120 | 4,250 | 31,925 | 53,000 | 132,750 |
| Te Pae Oranga o Ruahine o Tararua | 13,050 | 23,560 | 8,240 | 16,935 | 11,000 | 37,460 | 7,630 | 38,240 | 3,130 | 34,030 | 43,050 | 150,350 |
| Te Karu o Te Ika Poari Hauora | 3,085 | 5,990 | 1,810 | 3,320 | 2,330 | 8,975 | 1,850 | 11,680 | 850 | 11,695 | 9,950 | 41,700 |
| Ātiawa Toa | 19,440 | 62,155 | 13,280 | 58,695 | 21,380 | 127,270 | 14,005 | 107,860 | 4,640 | 68,210 | 72,700 | 424,250 |
| Te Kahui Hauora o Te Tau Ihu | 5,775 | 20,370 | 3,450 | 13,660 | 4,545 | 34,240 | 3,870 | 41,490 | 1,645 | 37,130 | 19,250 | 147,050 |
| Te Tauraki | 33,830 | 146,620 | 21,680 | 117,400 | 31,005 | 270,040 | 20,610 | 245,950 | 8,205 | 185,765 | 115,450 | 966,500 |
| Area with IMPB yet to be established | 1,950 | 415 | 1,135 | 240 | 1,600 | 735 | 1,485 | 1,075 | 625 | 855 | 6,800 | 3,350 |
| Total IMPB Population estimate | 265,410 | 708,835 | 164,485 | 504,550 | 241,805 | 1,247,835 | 175,930 | 1,117,450 | 70,720 | 826,400 | 918,550 | 4,407,500 |
Notes:
- Due to rounding, individual figures in this table do not add to give the stated totals.
- Prioritised ethnicity has been used – see ‘Ngā tapuae me ngā raraunga: Methods and data sources’ for further information.
- Iwi-Māori partnership board boundaries are based on definitions in the Pae Ora (Iwi-Māori Partnership Boards) Order 2022 as at 12 December 2022.
Source: Stats NZ, population projections (2018 base) 2023 update, custom Iwi-Māori Partnership Board estimates (currently not publicly available).
Figure 3: Proportion of Iwi-Māori partnership board population that is Māori, North Island, 2024
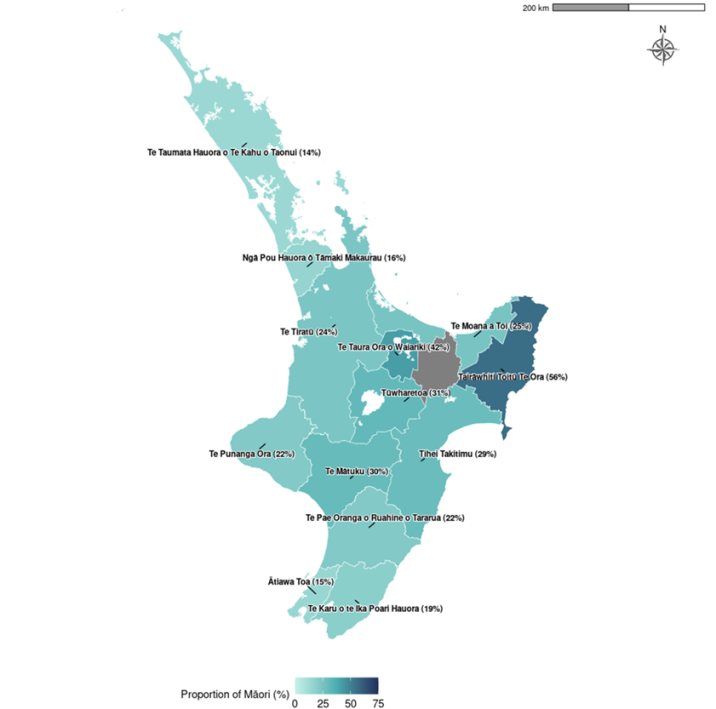
Figure 4: Proportion of Iwi-Māori partnership board population that is Māori, South Island and Wharekauri, 2024
Ngā awe o te hauora Socioeconomic determinants of health
Socioeconomic position is regarded as a major determinant of health. Factors such as income, employment status, housing and education can have both direct and indirect impacts on health. These impacts can be cumulative over lifetimes (Robson et al 2007, p 21). This section presents measures for neighbourhood deprivation experienced by Māori, followed by socioeconomic indicators and racial discrimination.
Neighbourhood deprivation
The New Zealand Index of Deprivation 2018 (NZDep2018) is a small-area-based index providing a measure of neighbourhood deprivation, by looking at the comparative socioeconomic positions of small areas and assigning them decile numbers from 1 (least deprived) to 10 (most deprived). The index is based on nine socioeconomic variables from the 2018 Census (Atkinson et al., 2019). It describes the general socioeconomic deprivation of an area. An area’s decile score does not necessarily mean all individuals living in that area experience an equivalent level of deprivation. Table 4 presents Māori and non-Māori populations in 2018 by deprivation decile.
| NZDep2018 decile | Māori | Non-Māori | ||||
|---|---|---|---|---|---|---|
Males | Females | Total | Males | Females | Total | |
| 1 (least deprived) | 15,126 | 14,901 | 30,024 | 204,315 | 211,239 | 415,554 |
| 2 | 17,439 | 16,926 | 34,365 | 204,039 | 210,747 | 414,789 |
| 3 | 20,112 | 19,992 | 40,101 | 201,564 | 210,027 | 411,591 |
| 4 | 22,848 | 22,797 | 45,642 | 200,574 | 207,708 | 408,279 |
| 5 | 26,043 | 25,611 | 51,651 | 198,264 | 206,226 | 404,487 |
| 6 | 31,200 | 31,314 | 62,514 | 197,499 | 203,400 | 400,899 |
| 7 | 38,565 | 39,414 | 77,976 | 190,974 | 197,739 | 388,710 |
| 8 | 47,664 | 47,973 | 95,637 | 188,259 | 192,564 | 380,826 |
| 9 | 61,083 | 64,857 | 125,940 | 175,188 | 177,993 | 353,181 |
| 10 (most deprived) | 98,544 | 105,129 | 203,676 | 148,461 | 147,279 | 295,740 |
| Unknown | 153 | 54 | 204 | 462 | 249 | 708 |
Notes:
- Due to rounding, individual figures in this table do not add to give the stated totals.
- Prioritised ethnicity has been used - see ‘Ngā tapuae me ngā raraunga: Methods and data sources’ for further information.
- ‘Unknown’ refers to the population for whom an NZDep2018 score was not ascertained.
Source: Atkinson et al 2019
Figure 5 shows that higher proportions of Māori live in areas with higher NZDep2018 scores; that is, in more deprived areas. In 2018, 26.5% of Māori lived in decile 10 areas (compared with 7.6% of non-Māori), while only 3.9% lived in decile 1 areas (compared with 10.7% of non-Māori).
Figure 5: Neighbourhood deprivation distribution (NZDep 2018), Māori and non-Māori, 2018
Use arrow keys to navigate the key indicator items.
- Download
- Download dataset
Socioeconomic indicators
Table 5 shows a selection of 2018 socioeconomic indicators available online from Stats NZ. In 2018, compared to non-Māori, Māori were more disadvantaged than non-Māori across all the socioeconomic indicators presented below. Māori adults had lower rates of school completion and more than twice as high rates of unemployment, more Māori adults had personal income of less than $10,000 and more Māori adults received income support. Māori were also more likely to live in crowded households.
| Indicator | Māori | Non-Māori | ||||
|---|---|---|---|---|---|---|
Males | Females | Total | Males | Females | Total | |
| School completion (Level 2 Certificate or higher), 15+ years, percent, 2018 | 51.6 | 58.7 | 55.2 | 67.4 | 68.2 | 67.8 |
| Unemployed, 15+ years, percent, 2018 | 7.3 | 8.8 | 8.1 | 3.1 | 3.5 | 3.3 |
| Total personal income less than $10,000, 15+ years, percent, 2018 | 20.8 | 22.7 | 21.8 | 13.7 | 20.1 | 17.0 |
| Household crowding, all age groups, percent, 2018 | - | - | 20.8 | - | - | 9.1 |
Notes:
- Due to rounding, individual figures in this table do not add to give the stated totals.
- Crude rates and prioritised ethnicity have been used - see ‘Ngā tapuae me ngā raraunga: Methods and data sources’ for further information.
- The household crowding measure is based on the Canadian National Crowding Index. This calculates a required number of bedrooms for each household (based on the age, sex and number of people living in the dwelling) then compares it with the actual number of bedrooms. A household is considered crowded when there are fewer bedrooms than required.
Source: 2018 Census, Stats NZ
Racial discrimination
This section presents the prevalence of self-reported experience of racial discrimination ‘ever’ in a person’s lifetime using data from the 2020/21 NZHS. ‘Racial discrimination’ refers to experience of ethnically motivated personal attack (physical or verbal) and experience of unfair treatment on the basis of ethnicity in any of three situations: health care, housing or work. Previous analyses have showed that experience of racial discrimination is associated with poor health outcomes and has impact on a wide range of risk factors (Harris et al 2012).
| Indicator | Māori | Non-Māori | ||||
|---|---|---|---|---|---|---|
Males | Females | Total | Males | Females | Total | |
| Self-reported experience of any ethnically motivated personal attack or any unfair treatment on the basis of ethnicity (ever), 15+ years, percent, 2020/21 | 36.7 | 37.0 | 36.9 | 22.2 | 19.3 | 20.7 |
Notes:
- Figures are age-standardised to the total Māori population as recorded in the 2001 Census.
- Prioritised ethnicity has been used - see ‘Ngā tapuae me ngā raraunga: Methods and data sources’ for further information.
Source: 2020/21 NZHS
Overall, Māori adults were almost twice as likely as non-Māori adults to have experienced any type of racial discrimination (RR 1.84, CI 1.65–2.04).
| Indicator | Māori | Non-Māori | ||||
|---|---|---|---|---|---|---|
Males | Females | Total | Males | Females | Total | |
| Self-reported experience of ethnically motivated physical attack (ever), 15+ years, percent, 2020/21 | 9.5 | 4.6 | 7.0 | 3.6 | 1.7 | 2.6 |
| Self-reported experience of ethnically motivated verbal attack (ever), 15+ years, percent, 2020/21 | 29.3 | 28.0 | 28.7 | 19.1 | 15.1 | 17.1 |
| Self-reported experience of any ethnically motivated personal (physical or verbal) attack (ever), 15+ years, percent, 2020/21 | 30.9 | 28.4 | 29.6 | 19.6 | 15.6 | 17.6 |
Notes:
- Figures are age-standardised to the total Māori population as recorded in the 2001 Census.
- Prioritised ethnicity has been used - see ‘Ngā tapuae me ngā raraunga: Methods and data sources’ for further information.
Source: 2020/21 NZHS
Māori adults were more than one-and-a-half times as likely as non-Māori adults to have experienced any ethnically motivated personal (physical or verbal) attack (RR 1.75, CI 1.54–1.98). The disparity was greater for rates of experience of physical attack: Māori adults were more than two-and-a-half times as likely as non-Māori adults to have experienced physical attack (RR 2.62, CI 2.03–3.37).
| Indicator | Māori | Non-Māori | ||||
|---|---|---|---|---|---|---|
Males | Females | Total | Males | Females | Total | |
| Self-reported experience of unfair treatment by a health professional on the basis of ethnicity (ever), 15+ years, percent, 2020/21 | 4.4 | 11.4 | 8.0 | 1.8 | 2.7 | 2.2 |
| Self-reported experience of unfair treatment at work or being refused a job unfairly because of ethnicity (ever), 15+ years, percent, 2020/21 | 7.2 | 8.1 | 7.7 | 4.4 | 5.3 | 4.8 |
| Self-reported experience of unfair treatment when renting or buying a house on the basis of ethnicity (ever), 15+ years, percent, 2020/21 | 7.0 | 10.1 | 8.5 | 1.8 | 2.1 | 2.0 |
| Self-reported experience of any unfair treatment on the basis of ethnicity (ever), 15+ years, percent, 2020/21 | 14.3 | 21.2 | 17.8 | 6.5 | 8.3 | 7.4 |
Notes:
- Figures are age-standardised to the total Māori population as recorded in the 2001 Census.
- Prioritised ethnicity has been used - see ‘Ngā tapuae me ngā raraunga: Methods and data sources’ for further information.
Source: 2020/21 NZHS
Māori adults were about two-and-a-half times as likely as non-Māori adults to have experienced any unfair treatment on the basis of ethnicity (RR 2.53, CI 2.17–2.94).
The disparity was greater for rates of experience of unfair treatment by a health professional among females: Māori females were about four times as likely as non-Māori females to have experienced unfair treatment by a health professional because of ethnicity (RR 4.09, CI 2.92–5.72).
The disparity was also greater for rates of experience of unfair treatment in housing among females: Māori females were almost five times as likely as non-Māori females to have experienced unfair treatment in renting or buying houses because of ethnicity (RR 4.98, CI 3.56–6.97).
Ngā tauwehe tūpono me te marumaru Risk and protective factors
Differences in socioeconomic position between Māori and non-Māori are likely to contribute to differences in individual risk and protective factors, which in turn affect health outcomes.
This section presents data on individual risk and protective factors comprising tobacco smoking, vaping, alcohol use, nutrition, body size and physical activity.
Tobacco smoking and vaping
| Indicator | Māori | Non-Māori | ||||
|---|---|---|---|---|---|---|
Males | Females | Total | Males | Females | Total | |
| Daily smoking (self-reported), 14-15 years, %, 2022 | 2.5 | 3.0 | 2.8 | 0.7 | 0.5 | 0.6 |
| Daily vaping (self-reported), 14-15 years, %, 2022 | * | * | 21.7 | * | * | 6.9 |
Notes:
- Crude rates and prioritised ethnicity have been used - see ‘Ngā tapuae me ngā raraunga: Methods and data sources’ for further information.
- *Data not available.
- ‘Daily smoking’ refers to smoking at least once a day.
- ‘Daily vaping’ refers to using electronic cigarettes or a vaping device at least once a day.
Source: ASH Year 10 Snapshot Survey 2022
Table 9 shows in 2022, young Māori boys and girls (aged 14–15 years) were more than four-and-a-half times as likely to be a daily smoker (RR 4.67, CI 3.43–6.40) than non-Māori boys and girls in the same age group.
Also in 2022, daily vaping rates for Māori boys and girls (21.7%) were three times higher than rates for non-Māori boys and girls (6.9%).
| Indicator | Māori | Non-Māori | ||||
|---|---|---|---|---|---|---|
Males | Females | Total | Males | Females | Total | |
| Current smoking (self-reported), 15+ years, %, 2022/23 | 21.4 | 20.2 | 20.6 | 6.9 | 4.9 | 6.0 |
| Daily vaping (self-reported), 15+ years, %, 2022/23 | 25.1 | 27.6 | 26.1 | 11.5 | 9.1 | 10.3 |
Notes:
- Figures are age-standardised to the total Māori population as recorded in the 2001 Census.
- Prioritised ethnicity has been used - see ‘Ngā tapuae me ngā raraunga: Methods and data sources’ for further information.
- ‘Current smoking’ refers to having smoked more than 100 cigarettes in a lifetime and currently smoking at least once a month.
- ‘Daily vaping’ refers to using electronic cigarettes or a vaping device at least once a day.
Source: 2022/23 NZHS
Māori adults were more than three times as likely as non-Māori adults to be current smokers (RR 3.30, CI 2.77–3.92). The disparity was greater for females – Māori females were almost four times as likely as non-Māori females to be current smokers (RR 3.84, CI 2.98–4.93).
Māori adults were about two-and-a-half times as likely as non-Māori adults to vape daily (RR 2.54, CI 2.03–3.18). The disparity was greater for females – Māori females were three times as likely as non-Māori females to vape daily (RR 3.00, CI 2.30–3.92).
Alcohol use
| Indicator | Māori | Non-Māori | ||||
|---|---|---|---|---|---|---|
Males | Females | Total | Males | Females | Total | |
| Consumed alcohol in the past 12 months, 15+ years, %, 2022/23 | 81.8 | 80.5 | 81.0 | 77.8 | 71.2 | 74.6 |
| Drank alcohol 4 or more times a week (among past year drinkers), 15+ years, %, 2022/23 | 11.2 | 5.9 | 8.3 | 15.6 | 10.7 | 13.2 |
| Drank large amounts of alcohol at least weekly (among past year drinkers), 15+ years, %, 2022/23 | 21.2 | 12.0 | 16.2 | 15.1 | 5.3 | 10.7 |
Notes:
- Figures are age-standardised to the total Māori population as recorded in the 2001 Census.
- Prioritised ethnicity has been used - see ‘Ngā tapuae me ngā raraunga: Methods and data sources’ for further information.
- ‘A large amount of alcohol’ is defined as more than six standard drinks on one drinking occasion.
Source: 2022/23 NZHS
Māori adult drinkers were less likely than non-Māori adult drinkers to have drunk alcohol four or more times a week (RR 0.62, CI 0.47–0.81).
However, of those who had drunk in the past 12 months, Māori were about one-and-a-half times as likely as non-Māori to have consumed a large amount of alcohol (six or more drinks on one occasion) at least weekly (RR 1.56, CI 1.20–2.03). The disparity was greater for females who had drunk in the past year – Māori females were almost two-and-a-half times as likely as non-Māori females to have consumed a large amount of alcohol at least weekly (RR 2.40, CI 1.55–3.70).
Nutrition
| Indicator | Māori | Non-Māori | ||||
|---|---|---|---|---|---|---|
Males | Females | Total | Males | Females | Total | |
| Eating recommended servings of vegetables each day (self-reported), 15+ years, %, 2022/23 | 5.5* | 11.0 | 8.5 | 3.7 | 16.1 | 10.0 |
| Eating recommended servings of fruit each day (self-reported), 15+ years, %, 2022/23 | 40.3 | 42.6 | 41.4 | 37.3 | 46.5 | 41.8 |
| Eating recommended servings of vegetables and fruit 5 each day (self-reported), 15+ years, %, 2022/23 | 4.1* | 7.0 | 5.8 | 1.7 | 9.2 | 5.4 |
Notes:
- Figures are age-standardised to the total Māori population as recorded in the 2001 Census.
- Prioritised ethnicity has been used - see ‘Ngā tapuae me ngā raraunga: Methods and data sources’ for further information.
- *Estimates with a high relative sampling error (over 30%). Results with a high relative sampling error are less precise than those with a low relative sampling error.
Source: 2022/23 NZHS
The Ministry of Health recommends that New Zealanders eat at least five servings of vegetables and at least two servings of fruit per day (Ministry of Health 2020).
Table 12 shows that Māori adults and non-Māori adults were equally likely to meet the recommended daily intake of five or more servings of vegetables and two or more servings of fruit per day (RR 0.99, CI 0.68–1.42).
Body size
A healthy body size is recognised as important for good health and wellbeing. Evidence shows that obese children and adults are at greater risk of short- and long-term health consequences (Ministry of Health 2014a).
Body mass index (BMI) provides a useful population-level indicator of excess body weight. It is a measure of weight adjusted for height and is calculated by dividing weight in kilograms by the square of height in metres (kg/m2). This measure is used internationally to classify underweight, overweight and obesity. It should be noted that BMI does not distinguish between weight associated with muscle and weight associated with fat, nor does it provide information on the distribution of body fatness. However, it is considered to be a good estimate of increased risk of health conditions associated with obesity (WHO 2007).
| Classification | BMI score (kg/m2) | Risk of health conditions |
|---|---|---|
| Underweight | <18.50 | Low risk |
| Normal range | 18.50–24.99 | Average risk |
| Overweight | 25.00–29.99 | Increased risk |
| Obese | ≥ 30.00 | Substantially increased risk |
Note: Risk only includes health conditions associated with increasing BMI.
Source: WHO 2007
Details on the classification of overweight and obesity in children under 18 years can be found in Cole et al (2000, 2007).
| Indicator | Māori | Non-Māori | ||||
|---|---|---|---|---|---|---|
Males | Females | Total | Males | Females | Total | |
| Overweight, 5-14 years, %, 2022/23 | 15.8 | 29.9 | 22.6 | 19.4 | 18.8 | 19.1 |
| Obese, 5-14 years, %, 2022/23 | 26.4 | 16.8 | 21.8 | 13.9 | 9.8 | 11.9 |
Notes:
- Figures are age-standardised to the total Māori population as recorded in the 2001 Census.
- Prioritised ethnicity has been used - see ‘Ngā tapuae me ngā raraunga: Methods and data sources’ for further information.
Source: 2022/23 NZHS
Māori girls aged 5–14 years were more likely to be overweight than non-Māori girls in the same age group (RR 1.63, CI 1.09–2.46). Māori children aged 5–14 years were almost twice as likely to be classified as obese as non-Māori children in the same age group (RR 1.83, CI 1.33–2.52).
| Indicator | Māori | Non-Māori | ||||
|---|---|---|---|---|---|---|
Males | Females | Total | Males | Females | Total | |
| Overweight, 15+ years, %, 2022/23 | 26.5 | 22.8 | 24.3 | 36.3 | 26.7 | 31.3 |
| Obese, 15+ years, %, 2022/23 | 46.2 | 47.9 | 47.3 | 27.1 | 28.2 | 27.7 |
| Mean BMI kg/m2,15+ years, 2022/23 | 30.4 | 30.6 | 30.6 | 27.5 | 27.3 | 27.4 |
| Mean waist measurements (cm), 15+ years, 2022/23 | 99.0 | 91.5 | 95.3 | 93.6 | 84.5 | 89.0 |
Notes:
- Figures are age standardised to the total Māori population as recorded in the 2001 Census.
- Prioritised ethnicity has been used - see ‘Ngā tapuae me ngā raraunga: Methods and data sources’ for further information.
Source: 2022/23 NZHS
Māori adults were less likely than non-Māori adults to be overweight (RR 0.77, CI 0.67–0.89). However, Māori adults were more than one-and-a-half times as likely to be classified as obese as non-Māori adults (RR 1.66, CI 1.49–1.85). Māori adults had higher mean BMI (RR 1.11, CI 1.08–1.14) and mean waist measurements (RR 1.06, CI 1.04–1.08) than non-Māori adults.
Physical activity
| Indicator | Māori | Non-Māori | ||||
|---|---|---|---|---|---|---|
Males | Females | Total | Males | Females | Total | |
| Regular physical activity (self‑reported), 15+ years, %, 2022/23 | 50.0 | 46.0 | 48.1 | 51.0 | 42.6 | 46.6 |
Notes:
- Figures are age standardised to the total Māori population as recorded in the 2001 Census.
- Prioritised ethnicity has been used - see ‘Ngā tapuae me ngā raraunga: Methods and data sources’ for further information.
- ‘Regular physical activity’ is defined as at least 30 minutes of physical activity per day on five or more days of the week.
Source: 2022/23 NZHS
Māori and non-Māori adults, regardless of gender, reported similar levels of physical activity (exercise, transport, incidental, work) in the 2022/23 NZHS (RR 1.00, CI 0.91–1.09).
Active New Zealand Survey
In 2021, Sport New Zealand ran its fifth national Active New Zealand Survey, which provided new benchmarks for monitoring physical activity.
Sport New Zealand’s physical activity guidelines state that adults should participate in at least 30 minutes of moderate-intensity physical activity on most (at least five), if not all, days of the week. This is referred to as the 30 x 5 recommendation.
Results from the 2021 Active New Zealand Survey showed that both young Māori (aged 5–17 years) and Māori adults (aged 18 years and over) had similar levels of participation in the 30 x 5 recommendation as the total population. 71% of Māori adults met the recommendation, compared to 73% of adults in the total population. Among young people, 90% of young Māori met the recommendation, compared to 91% of all young people in the total population (Sport New Zealand 2022).
Ngā mana hauora tūtohu Health status indicators
This section presents a range of indicators relating to health status, including life expectancy, major causes of death, cardiovascular disease, cancer, respiratory disease, diabetes, infectious disease, immunisation, suicide and intentional self-harm, interpersonal violence, oral health, mental health, infant health and unintentional injury. The disability section has not been updated, because the Stats NZ disability survey was not undertaken in 2018.
Life expectancy
Figure 6: Life expectancy at birth, by gender, Māori and non-Māori, 1950-52 to 2017-19
Use arrow keys to navigate the key indicator items.
- Download
- Download dataset
Figure 6 shows that Māori life expectancy rapidly increased until the late 1970s or early 1980s, after which it was mostly static, while non-Māori life expectancy continued to increase. Since the late 1990s, Māori life expectancy has been increasing at about the same rate as non-Māori, or even slightly faster.
During the 1980s and early 1990s, Māori mortality was seriously undercounted due to the different definitions of ethnicity on death registration, birth registration and census forms. The dotted lines on Figure 6 for Māori males and females represent adjusted, more reliable life expectancy figures for this period, calculated from data in the New Zealand Census – Mortality Study (Ajwani et al 2003; Blakely et al 2007).
In 2017–2019, life expectancy at birth was 73.4 years for Māori males (up 3.1 years from 2005–2007) and 77.1 years for Māori females (up 2.0 years from 2005–2007). In comparison, non-Māori males were expected to live to 80.9 years, while non-Māori females were expected to live to 84.4 years.
The gap between Māori and non-Māori life expectancy at birth was 7.5 years for males and 7.3 years for females in 2017–2019. This was down from 8.6 years for males and 7.9 years for females in 2005–2007, and from 8.8 and 9.3 years respectively in 1995–1997.
The gap grew slightly after 2012–2014; however, the underestimation of the 2013 Māori population may have affected the 2012–2014 life tables. Therefore, we have focused on comparing over a longer period.
Major causes of death
Causes of death have been ranked in this chart book by age-standardised mortality rates.
| Males | Females | |
|---|---|---|
| Māori | Ischaemic heart disease | Lung cancer |
| Lung cancer | Ischaemic heart disease | |
| Suicide | Chronic obstructive pulmonary disease | |
| Other forms of heart disease | Cerebrovascular disease (stroke) | |
| Diabetes | Breast cancer | |
| Non-Māori | Ischaemic heart disease | Ischaemic heart disease |
| Suicide | Breast cancer | |
| Lung cancer | Lung cancer | |
| Colorectal cancer | Cerebrovascular disease (stroke) | |
| Other forms of heart disease | Dementia including Alzheimer's disease |
Notes:
- Figures are age-standardised to the total Māori population as recorded in the 2001 Census.
- Prioritised ethnicity has been used – see ‘Ngā tapuae me ngā raraunga: Methods and data sources’ for further information.
- 2020 Mortality data provisional, 2018 and 2019 Mortality data final.
Source: 2018-2020 Mortality Collection Data Set, Te Whatu Ora
Table 17 shows that ischaemic heart disease was the leading cause of death for Māori males and both non-Māori males and females, and the second leading cause of death for Māori females.
Lung cancer was the leading cause of death for Māori females and the second leading cause of death for Māori males. It was also the third leading causes of death for non-Māori.
Suicide was the third leading cause of death for Māori males and the second leading cause of death for non-Māori males.
Other forms of heart disease and diabetes featured in the top five causes of death for Māori and non-Māori males but did not feature in the top five for either Māori or non-Māori females.
Chronic obstructive pulmonary disease was the third leading cause of death for Māori females but did not feature in the top five for either Māori males or non-Māori.
Cerebrovascular disease (stroke) was the fourth leading cause of death for both Māori and non-Māori females but did not feature in the top five for either Māori or non-Māori males.
Breast cancer was the fifth leading cause of death for Māori females and also the second leading cause of death for non-Māori females.
Dementia including Alzheimer’s disease was the fifth leading cause of death for non-Māori females but did not feature in the top five for either Māori or non-Māori males.
Apart from suicide for males, the major causes of death were all chronic diseases, regardless of gender or ethnicity.
Cardiovascular disease
| Indicator | Māori | Non-Māori | ||||
|---|---|---|---|---|---|---|
Males | Females | Total | Males | Females | Total | |
| Total cardiovascular disease mortality, 35+ years, rate per 100,000, 2018–20 | 306.3 | 190.6 | 245.2 | 136.2 | 76.4 | 105.2 |
| Total cardiovascular disease hospitalisation, 35+ years, rate per 100,000, 2020–22 | 3,033.1 | 2,095.5 | 2,542.6 | 1,859.7 | 1,059.4 | 1,447.5 |
| Stroke mortality, 35+ years, rate per 100,000, 2018–20 | 33.4 | 42.9 | 38.5 | 22.0 | 21.5 | 21.9 |
| Stroke hospitalisation, 35+ years, rate per 100,000, 2020–22 | 368.4 | 362.7 | 365.6 | 227.6 | 168.1 | 196.9 |
| Heart failure mortality, 35+ years, rate per 100,000, 2018–20 | 5.2 | 4.8 | 5.0 | 1.9 | 1.7 | 1.8 |
| Heart failure hospitalisation, 35+ years, rate per 100,000, 2020–22 | 596.3 | 319.5 | 451.3 | 150.0 | 88.4 | 117.9 |
| Rheumatic heart disease mortality, 15+ years, rate per 100,000, 2018–20 | 4.1 | 6.3 | 5.2 | 1.0 | 1.1 | 1.0 |
| Rheumatic heart disease hospitalisation, 15+ years, rate per 100,000, 2020–22 | 16.5 | 24.4 | 20.6 | 7.1 | 8.1 | 7.6 |
Notes:
- Figures are age-standardised to the total Māori population as recorded in the 2001 Census.
- Prioritised ethnicity has been used – see ‘Ngā tapuae me ngā raraunga: Methods and data sources’ for further information.
Sources: 2018-20 Mortality Collection Data Set, Te Whatu Ora; 2020-22 National Minimum Data Set, Te Whatu Ora
Table 18 shows that in 2018–20, the total cardiovascular disease mortality rate among Māori was more than twice as high as that among non-Māori (RR 2.33, CI 2.24–2.42). The disparity was greater for females – Māori females were almost two-and-a-half times as likely as non-Māori females to die from cardiovascular disease (RR 2.49, CI 2.35–2.65). In 2020–22, Māori were more than one-and-a-half times as likely as non-Māori to be hospitalised for cardiovascular disease (RR 1.76, CI 1.73–1.78). The disparity was greater for females – Māori females were nearly twice as likely as non-Māori females to be admitted to hospital for cardiovascular disease (RR 1.98, CI 1.94–2.02).
In the equivalent time periods, the stroke mortality rate among Māori was more than one-and-a-half times as high as that of non-Māori (RR 1.76, CI 1.59–1.93), and the stroke hospitalisation rate among Māori was more than one-and-a-half times as high as that of non-Māori (RR 1.86, CI 1.80–1.92). The disparity was greater for females – the stroke mortality rate among Māori females was nearly twice as high as that among non-Māori females (RR 1.99, CI 1.75–2.27), and the stroke hospitalisation rate among Māori females was more than twice as high as that among non-Māori females (RR 2.16, CI 2.06–2.26).
The heart failure mortality rate among Māori was more than two-and-a-half times as high as that of non-Māori (RR 2.79, CI 2.16–3.61), and Māori were about four times as likely as non-Māori to be hospitalised for heart failure (RR 3.83, CI 3.71–3.95). The disparity was greater for males – the heart failure hospitalisation rate among Māori males was nearly four times as high as that among non-Māori males (RR 3.98, CI 3.82–4.14).
The rheumatic heart disease mortality rate among Māori was about five times as high as that of non-Māori (RR 5.07, CI 3.95–6.51), and the rheumatic heart disease hospitalisation rate among Māori was more than two-and-a-half times as high as that of non-Māori (RR 2.72, CI 2.43–3.04). The disparity was greater for females – the rheumatic heart disease mortality rate among Māori females was nearly six times as high as that among non-Māori females (RR 5.96, CI 4.27–8.33), and the rheumatic heart disease hospitalisation rate among Māori females was three times as high as that among non-Māori females (RR 2.98, CI 2.57–3.46).
| Indicator | Māori | Non-Māori | |||||
|---|---|---|---|---|---|---|---|
Males | Females | Total | Males | Females | Total | ||
| Ischaemic heart disease mortality, 35+ years, rate per 100,000, 2018–20 | 162.4 | 69.3 | 113.0 | 76.2 | 28.4 | 51.2 | |
| Ischaemic heart disease hospitalisation, 35+ years, rate per 100,000, 2020–22 | 698.7 | 414.7 | 550.1 | 594.4 | 203.8 | 393.6 | |
| All re-vascularisation (coronary artery bypass graft and angioplasty) heart disease procedures, 35+ years, rate per 100,000, 2020–22 | 215.8 | 86.9 | 148.3 | 225.6 | 52.4 | 136.8 | |
Notes:
- Figures are age-standardised to the total Māori population as recorded in the 2001 Census.
- Prioritised ethnicity has been used - see ‘Ngā tapuae me ngā raraunga: Methods and data sources’ for further information.
Sources: 2018-20 Mortality Collection Data Set, Te Whatu Ora; 2020-22 National Minimum Data Set, Te Whatu Ora
Ischaemic heart disease accounts for over half of all cardiovascular disease mortality. Table 19 shows that the ischaemic heart disease mortality rate among Māori was more than twice as high as that among non-Māori (RR 2.21, CI 2.09–2.34). Māori were 1.4 times as likely as non-Māori to be hospitalised for ischaemic heart disease (RR 1.40, CI 1.36–1.43). The disparity was greater for females – the ischaemic heart disease mortality rate among Māori females was nearly two-and-a-half times as high as that among non-Māori females (RR 2.44, CI 2.22–2.69). The ischaemic heart disease hospitalisation rate among Māori females was twice as high as that among non-Māori females (RR 2.03, CI 1.95–2.12).
Māori were more likely than non-Māori to have experienced a re-vascularisation heart disease procedure (coronary artery bypass graft (CABG) and angioplasty) (RR 1.08, CI 1.03–1.14). The disparity was greater for females – the CABG and angioplasty procedure rate among Māori females was more than one-and-a-half times as high as that among non-Māori females (RR 1.66, CI 1.51–1.82).
The risk of ischaemic heart disease and cardiovascular disease (mortality and hospitalisation) was higher among males than females. The relative differences were greater between Māori and non-Māori females than between Māori and non-Māori males.
Cancer
| Indicator | Māori | Non-Māori | ||||
|---|---|---|---|---|---|---|
Males | Females | Total | Males | Females | Total | |
| Total cancer registrations, 25+ years, rate per 100,000, 2018–20 | 476.2 | 546.6 | 511.5 | 418.9 | 400.7 | 408.3 |
| Total cancer mortality, 25+ years, rate per 100,000, 2016–18 | 183.3 | 179.7 | 180.8 | 113.8 | 94.6 | 103.2 |
Notes:
- Figures are age-standardised to the total Māori population as recorded in the 2001 Census.
- Prioritised ethnicity has been used – see ‘Ngā tapuae me ngā raraunga: Methods and data sources’ for further information.
Sources: 2016-2018 Mortality Collection Data Set, Te Whatu Ora; 2018-20 New Zealand Cancer Registry, Te Whatu Ora
Māori adults aged 25 and over had significantly higher cancer registration rates than non-Māori adults for total cancers in 2018–20 (RR 1.25, CI 1.22–1.28). The total-cancer mortality rate in 2016–18 among Māori adults was more than one-and-a-half times as high as that among non-Māori adults (RR 1.75, CI 1.69–1.82).
Figure 7 shows that the most common cancers registered for Māori females over this time period were breast cancer, lung cancer, colorectal cancer, uterine cancer and thyroid cancer. Figure 8 shows that the leading causes of cancer death for Māori females were lung cancer, breast cancer, colorectal cancer, pancreas cancer and uterine cancer.
Māori females had breast cancer registration and mortality rates about 1.4 times that of non-Māori females (RR 1.34, CI 1.27–1.42 for registration; RR 1.47, CI 1.27–1.70 for mortality).
Māori females had a lung cancer registration rate over three times that of non-Māori females (RR 3.58, CI 3.31–3.88). Māori females had a lung cancer mortality rate almost four times that of non-Māori females (RR 3.87, CI 3.52–4.25).
There was no significant difference in colorectal cancer registration and mortality rates between Māori females and non-Māori females (RR 0.91, CI 0.81–1.02 for registration; RR 1.13, CI 0.92–1.37 for mortality).
Figure 7: Female cancer registration rates, by site, 25+ years, Māori and non-Māori, 2018–20
Use arrow keys to navigate the key indicator items.
- Download
- Download dataset
Figure 8: Female cancer mortality rates, by site, 25+ years, Māori and non-Māori, 2016–18
Use arrow keys to navigate the key indicator items.
- Download
- Download dataset
The most common cancer registration sites for Māori males were prostate cancer, lung cancer, colorectal cancer, liver cancer and testicular cancer (Figure 9). The leading causes of cancer mortality for Māori males were lung cancer, colorectal cancer, prostate cancer, liver cancer and stomach cancer (Figure 10).
Māori male lung cancer registration and mortality rates were around three times those of non-Māori males (RR 2.87 CI 2.63–3.13 for registration; RR 3.03, CI 2.74–3.35 for mortality).
There was no significant difference in colorectal cancer registration and mortality rates between Māori males and non-Māori males (RR 0.94, CI 0.85–1.05 for registration; RR 1.08, CI 0.91–1.29 for mortality).
For Māori males, liver cancer registration and mortality rates were around three times those of non-Māori males (RR 3.02, CI 2.55–3.59 for registration; 3.07, CI 2.50–3.78 for mortality).
Figure 9: Male cancer registration rates, by site, 25+ years, Māori and non-Māori, 2018–20
Use arrow keys to navigate the key indicator items.
- Download
- Download dataset
Figure 10: Male cancer mortality rates, by site, 25+ years, Māori and non-Māori, 2016–18
Use arrow keys to navigate the key indicator items.
- Download
- Download dataset
| Indicator | Māori | Non-Māori |
|---|---|---|
| BreastScreen Aotearoa coverage for 24 months to 31 March 2020, females aged 50–69 years, % | 66.8 | 71.4 |
| National Cervical Screening Programme three-year coverage to 31 March 2020, females aged 25–69 years, % | 55.7 | 59.3 |
Note: Crude rates and prioritised ethnicity have been used – see ‘Ngā tapuae me ngā raraunga: Methods and data sources’ for further information.
Source: 2020 National Screening Unit, Te Whatu Ora
There are screening programmes for both breast and cervical cancer in New Zealand. Table 21 shows that for both these programmes, coverage rates were lower for Māori than for non-Māori.
The BreastScreen Aotearoa programme is a free national breast X-ray (mammography) service offered two-yearly to women aged between 50 and 69 years. The most recent two-year screening coverage rate represents a full screening round with two-yearly two-view mammographic screening. For more information, see Te Whatu Ora’s page about the programme (Te Whatu Ora, 2024b).
National Cervical Screening Programme (NCSP) coverage percentages that appear here represent the proportion of women aged 25–69 years who enrolled on the NCSP register who had had a cervical smear in the 36 months prior to the reporting period. A 36-month interval was used because this is the recommended cervical screening interval. For more information, see Te Whatu Ora’s page about the NCSP programme (Te Whatu Ora, 2024a).
Respiratory disease
| Indicator | Māori | Non-Māori | ||||
|---|---|---|---|---|---|---|
Males | Females | Total | Males | Females | Total | |
| Asthma hospitalisation, 5-34 years, rate per 100,000, 2020-22 | 135.9 | 172.1 | 154.1 | 72.5 | 67.9 | 70.3 |
| Diagnosed asthma and currently taking medication (self-reported), 15–44 years, %, 2022/23 | 16.8 | 23.1 | 19.7 | 9.5 | 13.9 | 11.7 |
Notes:
- Figures are age-standardised to the total Māori population as recorded in the 2001 Census.
- Prioritised ethnicity has been used - see ‘Ngā tapuae me ngā raraunga: Methods and data sources’ for further information.
- ‘Diagnosed asthma’ refers to people who reported that a doctor had told them that they had asthma and that they were currently taking medication (inhalers, medicine tablets, pills or other medication) to treat it.
Sources: 2022/23 NZHS; 2020-22 National Minimum Data Set, Te Whatu Ora
Table 22 shows that Māori aged 5–34 years were more than twice as likely as non-Māori in the same age group to have been hospitalised for asthma (RR 2.19, CI 2.07–2.32). The disparity was greater for females – Māori females had an asthma hospitalisation rate more than two-and-a-half times that of non-Māori females (RR 2.53, CI 2.34–2.74).
In 2022/23, Māori aged 15–44 years were more than one-and-a-half times as likely as non-Māori in the same age group to report being diagnosed asthma and currently taking medication (RR 1.69, CI 1.26–2.27).
| Indicator | Māori | Non-Māori | ||||
|---|---|---|---|---|---|---|
Males | Females | Total | Males | Females | Total | |
| Chronic obstructive pulmonary disease mortality, 45+ years, rate per 100,000, 2018–20 | 77.9 | 81.9 | 80.1 | 29.0 | 24.3 | 26.4 |
| Chronic obstructive pulmonary disease hospitalisation, 45+ years, rate per 100,000, 2020–22 | 617.4 | 887.1 | 759.4 | 188.8 | 186.3 | 187.0 |
Notes:
- Figures are age-standardised to the total Māori population as recorded in the 2001 Census.
- Prioritised ethnicity has been used – see ‘Ngā tapuae me ngā raraunga: Methods and data sources’ for further information.
Sources: 2018-20 Mortality Collection Data Set, Te Whatu Ora; 2020-22 National Minimum Data Set, Te Whatu Ora
The chronic obstructive pulmonary disease (COPD) mortality rate among Māori aged 45 and over in 2018–20 was about three times that of non-Māori in the same age group (RR 3.03, CI 2.78–3.31). The disparity was greater for females – Māori females had a COPD mortality rate more than three times that of non-Māori females (RR 3.36, CI 2.98–3.80).
Māori aged 45 and over had a COPD hospitalisation rate about four times that of non-Māori in the same age group in 2020–22 (RR 4.06, CI 3.94–4.19). Again, the relative disparity was greater for females – Māori females had a COPD hospitalisation rate more than four-and-a-half times that of non-Māori females (RR 4.76, CI 4.57–4.96).
Diabetes
| Indicator | Māori | Non-Māori | ||||
|---|---|---|---|---|---|---|
Males | Females | Total | Males | Females | Total | |
| Diagnosed diabetes (excluding diabetes during pregnancy) prevalence (self-reported), 15+ years, percent, 2022/23 | 8.8 | 6.1 | 7.3 | 3.1 | 3.5 | 3.3 |
| Diabetes complications – renal failure with concurrent diabetes (type 1 and type 2 diabetes), 15+ years, rate per 100,000, 2020-22 | 1,086.3 | 778.2 | 923.0 | 299.5 | 216.4 | 255.5 |
| Diabetes complications – lower limb amputation with concurrent diabetes (type 1 and type 2 diabetes), 15+ years, rate per 100,000, 2020-22 | 35.1 | 15.4 | 24.8 | 12.2 | 4.2 | 8.1 |
Notes:
- Figures are age-standardised to the total Māori population as recorded in the 2001 Census.
- Prioritised ethnicity has been used – see ‘Ngā tapuae me ngā raraunga: Methods and data sources’ for further information.
Sources: 2022/23 NZHS; 2020-22 National Minimum Data Set, Te Whatu Ora
Table 24 shows that the self-reported prevalence of diabetes[2] among Māori adults was more than twice that of non-Māori adults in 2022/23 (RR 2.17, CI 1.68–2.80). It also shows that there were much higher disparities between Māori and non-Māori for diabetes complications.
Renal failure is one of the complications of diabetes. Rates of renal failure with concurrent diabetes for Māori aged 15 and over were more than three times that of non-Māori at the same age group in 2020–22 (RR 3.61, CI 3.56–3.67). While some of this difference can be attributed to the higher prevalence of diabetes among Māori, the disproportionately higher rate suggests that Māori with diabetes are more likely to have renal failure than non-Māori with diabetes. The extent of the disparity can be estimated by dividing the relative risk of renal failure by the relative risk of prevalence (ie, 3.61 ÷ 2.17), which suggests that among people with diabetes, Māori are 1.7 times as likely as non-Māori to have renal failure [3].
Lower limb amputation is another complication of diabetes. Similarly, rates of lower limb amputation with concurrent diabetes for Māori were about three times that of non-Māori in 2020–22(RR 3.07, CI 2.78–3.39). Therefore, among people with diabetes, lower limb amputations among Māori can be estimated as 1.4 times that of non-Māori (ie, 3.07 ÷ 2.17).
| Indicator | Māori | Non-Māori | ||||
|---|---|---|---|---|---|---|
Males | Females | Total | Males | Females | Total | |
| Diabetes prevalence, 15+ years, Virtual Diabetes Register, 2022 | 6.4 | 6.5 | 6.4 | 4.2 | 3.8 | 4.0 |
Notes:
- Figures are age-standardised to the total Māori population as recorded in the 2001 Census.
- Prioritised ethnicity has been used – see ‘Ngā tapuae me ngā raraunga: Methods and data sources’ for further information.
Source: 2022 Virtual Diabetes Register, Te Whatu Ora
Each year, Te Whatu Ora releases national estimates of the prevalence of diabetes based on the Virtual Diabetes Register (VDR), a tool to monitor the prevalence of diabetes and support national and local clinical quality improvements.
The VDR contains data about people suspected as having diabetes, identified through their use of diabetes-related health services. The totals include people who were alive and enrolled in a primary health organisation at 31 December of each year.
Māori adult males (RR 1.54, CI 1.51–1.56) and females (RR 1.69, CI 1.66-1.71) were more likely than non-Māori adult males and females to have diabetes in 2022.
[2] Note that using self-reported diabetes as a measure underestimates the true prevalence, because some people living with type 2 diabetes have not yet been diagnosed.
[3] Note that because this method uses two different datasets to estimate the risk of renal failure (1.7 times) this figure should be used with caution.
Infectious disease
| Indicator | Māori | Total New Zealand population |
|---|---|---|
| Meningococcal disease notifications, all age groups, rate per 100,000, 2023 | 2.1 | 1.1 |
| Meningococcal disease notifications, less than one year old, rate per 100,000, 2023 | 24.7 | 12.2 |
| Meningococcal disease notifications, 1–4 years, rate per 100,000, 2023 | 6.0 | 3.3 |
Note: Crude rates and prioritised ethnicity have been used – see ‘Ngā tapuae me ngā raraunga: Methods and data sources’ for further information.
Source: 2023 Institute of Environmental Science and Research Ltd
The frequency of meningococcal disease notifications was higher for Māori than for the total New Zealand population in 2023 for all age groups. The meningococcal disease notification rate for Māori infants aged less than one year old was twice as high as that of the total New Zealand rate. For toddlers aged one to four years, the meningococcal disease notifications for Māori were almost twice as high as for the total New Zealand population.
| Indicator | Māori | Total New Zealand population |
|---|---|---|
| Tuberculosis notifications, all age groups, rate per 100,000, 2023 | 2.0 | 6.1 |
Note: Crude rates and prioritised ethnicity have been used – see ‘Ngā tapuae me ngā raraunga: Methods and data sources’ for further information.
Source: 2023 Institute of Environmental Science and Research Ltd
In 2023, Māori had a lower rate of tuberculosis notifications than the total New Zealand population for all age groups.
| Indicator | Māori | Non-Māori | ||||
|---|---|---|---|---|---|---|
Males | Females | Total | Males | Females | Total | |
| Acute rheumatic fever initial hospitalisation (exclude recurrences), all ages, rate per 100,000, 2020-22 | 9.7 | 6.1 | 8.0 | 2.0 | 1.8 | 1.9 |
Notes:
- Figures are age-standardised to the total Māori population as recorded in the 2001 Census.
- Prioritised ethnicity has been used – see ‘Ngā tapuae me ngā raraunga: Methods and data sources’ for further information.
Source: 2020-22 National Minimum Data Set, Te Whatu Ora
The initial hospitalisation rate for acute rheumatic fever among Māori was more than four times as high as that for non-Māori in 2020–22 (RR 4.18, CI 3.33–5.26). The disparity was greater for males: Māori males had an acute rheumatic fever initial hospitalisation rate more than four-and-a-half times that of non-Māori males (RR 4.81, CI 3.55–6.51). As noted previously, hospitalisations and mortality for rheumatic heart disease were also higher for Māori than for non-Māori (see the ‘Cardiovascular disease’ section).
Immunisation
Childhood immunisation coverage information from the National Immunisation Register (NIR) shows that for the three months to 31 March 2023, at the age of eight months, 69.7% of Māori children had completed age-appropriate immunisations, compared with 88.6 % of non-Māori. By two years of age, the coverage rates were 68.9 % for Māori children and 87.8% for non-Māori children.
| Indicator | Māori | Non-Māori |
|---|---|---|
| Childhood immunisation, at 8 months, %, 2023 | 69.7 | 88.6 |
| Childhood immunisation, at 24 months, %, 2023 | 68.9 | 87.8 |
Source: 2023 National Immunisation Register, Te Whatu Ora
For more information on immunisation coverage, see Te Whatu Ora’s webpage ‘Immunisation coverage’ (Te Whatu Ora 2024d).
The human papillomavirus (HPV) immunisation is free for everyone aged 9 to 26, including non-residents under the age of 18. It protects young women from HPV infection and the risk of developing cervical cancer and a range of other HPV-related diseases later in life. The average HPV immunisation coverage rate (for completion of two or three doses) to March 2023 for girls born in 2009 and active in the NIR was 55.8%. The coverage rate for Māori girls was 46.2%.
| Indicator | Māori | Non-Māori |
|---|---|---|
| Human papillomavirus immunisation coverage for girls born in 2009, %, 2023 | 46.2 | 55.8 |
Source: 2023 National Immunisation Register, Te Whatu Ora
For more information on HPV immunisation, see Te Whatu Ora’s webpage ‘HPV immunisation programme’ (Te Whatu Ora 2024c).
Suicide and intentional self-harm
| Indicator | Māori | Non-Māori | ||||
|---|---|---|---|---|---|---|
Males | Females | Total | Males | Females | Total | |
| Suicide mortality, all age groups, rate per 100,000, 2018-20 | 25.0 | 11.0 | 17.9 | 13.4 | 4.8 | 9.1 |
| Suicide mortality, 15-24 years, rate per 100,000, 2018-20 | 35.7 | 25.1 | 30.5 | 21.2 | 8.8 | 15.2 |
| Suicide mortality, 25-44 years, rate per 100,000, 2018-20 | 52.5 | 15.2 | 33.5 | 20.5 | 6.4 | 13.5 |
| Suicide mortality, 45-64 years, rate per 100,000, 2018-20 | 23.4 | 10.9 | 16.9 | 24.3 | 8.3 | 16.1 |
Notes:
- Figures are age-standardised to the total Māori population as recorded in the 2001 Census.
- Prioritised ethnicity has been used - see ‘Ngā tapuae me ngā raraunga: Methods and data sources’ for further information.
Source: 2018-20 Mortality Collection Data Set, Te Whatu Ora
Māori suicide rates were nearly twice as high as those of non-Māori in 2018–20 (RR 1.96, CI 1.75–2.19). The disparity was greater for females – suicide rates for Māori females were more than twice as high as those for non-Māori females (RR 2.28, CI 1.86–2.81).
Males overall had significantly higher suicide mortality rates than females.
Māori males aged 25–44 years had the highest suicide rate.
There was no significant difference between Māori and non-Māori aged 45–64 years.
| Indicator | Māori | Non-Māori | ||||
|---|---|---|---|---|---|---|
Males | Females | Total | Males | Females | Total | |
| Intentional self-harm hospitalisation, all age groups, rate per 100,000, 2020-22 | 103.7 | 209.2 | 155.4 | 55.1 | 155.5 | 104.1 |
| Intentional self-harm hospitalisation, 15-24 years, rate per 100,000, 2020-22 | 206.0 | 574.2 | 385.7 | 129.9 | 468.8 | 294.4 |
| Intentional self-harm hospitalisation, 25-44 years, rate per 100,000, 2020-22 | 172.8 | 208.9 | 191.1 | 73.8 | 117.8 | 95.6 |
| Intentional self-harm hospitalisation, 45-64 years, rate per 100,000, 2020-22 | 92.5 | 122.2 | 107.8 | 59.8 | 92.3 | 76.4 |
Notes:
- Figures are age-standardised to the total Māori population as recorded in the 2001 Census.
- Prioritised ethnicity has been used – see ‘Ngā tapuae me ngā raraunga: Methods and data sources’ for further information.
Source: 2020-22 National Minimum Data Set, Te Whatu Ora
Māori overall were significantly more likely than non-Māori to be hospitalised for intentional self-harm in 2020–22 (RR 1.49, CI 1.44–1.55).
The hospitalisation rates for intentional self-harm for Māori women were twice as high as for Māori men. However, the disparity was greater among males: Māori males were about twice as likely as non-Māori males to be hospitalised for intentional self-harm (RR 1.88, CI 1.76–2.01).
Young people in the 15–24-year age group had the highest rate of hospitalisation for intentional self-harm. Māori males and females in the 15–24-year and 25–44-year age groups had significantly higher rates of hospitalisation for intentional self-harm than non-Māori males and females in the same age groups.
Interpersonal violence
| Indicator | Māori | Non-Māori | ||||
|---|---|---|---|---|---|---|
Males | Females | Total | Males | Females | Total | |
| Assault and homicide mortality, 15+ years, rate per 100,000, 2018-20 | 6.5 | 2.8 | 4.6 | 2.2 | 0.6 | 1.4 |
| Assault and attempted homicide hospitalisations, 15+ years, rate per 100,000, 2020-22 | 315.0 | 150.6 | 232.0 | 77.9 | 21.1 | 49.8 |
Notes:
- Figures are age-standardised to the total Māori population as recorded in the 2001 Census.
- Prioritised ethnicity has been used – see ‘Ngā tapuae me ngā raraunga: Methods and data sources’ for further information.
Sources: 2018-20 Mortality Collection Data Set, Te Whatu Ora; 2020-22 National Minimum Data Set, Te Whatu Ora
Māori adults were more likely than non-Māori adults to suffer adverse health effects as the victims of violence in 2020–22. Māori adults were more than three times as likely as non-Māori to die from assault and homicide in 2018–20 (RR 3.25, CI 2.42–4.35). The disparity was greater for females – the Māori female rate was over four times as high as that of non-Māori females (RR 4.49, CI 2.53–7.98).
Māori rates of hospitalisation as the result of assault or attempted homicide were also significantly higher than those for non-Māori (RR 4.65, CI 4.44–4.87). The disparity was greater for females – the Māori female rate was over seven times as high as that of non-Māori females (RR 7.13, CI 6.51–7.81).
Oral health
At school entry (five years of age), Māori children had a higher mean number of decayed, missing or filled teeth than non-Māori children in 2022 and were less likely to be caries-free.
There was some reduction in the disparity by school year 8, although Māori children still had a higher mean number of decayed, missing and filled teeth than non-Māori and were less likely to be caries-free.
| Indicator | Māori | Total New Zealand population | |||
|---|---|---|---|---|---|
Fluoridated supply | Non-fluoridated supply | Fluoridated supply | Non-fluoridated supply | ||
| Mean number of decayed, missing or filled teeth at 5 years of age, 2022 | 2.9 | 3.3 | 2.1 | 2.0 | |
| Mean number of decayed, missing or filled teeth at school year 8, 2022 | 0.9 | 1.4 | 0.5 | 0.9 | |
| Caries-free at 5 years of age, %, 2022 | 38.4 | 39.4 | 53.9 | 58.2 | |
| Caries-free at school year 8, %, 2022 | 65.8 | 59.2 | 74.4 | 64.0 | |
Note: Crude rates and prioritised ethnicity have been used – see ‘Ngā tapuae me ngā raraunga: Methods and data sources’ for further information.
Source: Community Oral Health Services, 2022
| Indicator | Māori | Non-Māori | ||||
|---|---|---|---|---|---|---|
Males | Females | Total | Males | Females | Total | |
| Visited a dental health care worker in the past 12 months (self-reported), 1–14 years, %, 2022/23 | 72.0 | 68.4 | 70.1 | 70.0 | 71.0 | 70.5 |
| Visited a dental health care worker in the past 12 months (self-reported), 15+ years, %, 2022/23 | 41.3 | 41.7 | 41.4 | 44.9 | 49.4 | 47.4 |
| Usually only visits a dental health care worker for dental problems, or never visits, among adults with natural teeth (self-reported), 15+ years, %, 2022/23 | 68.6 | 63.9 | 66.2 | 54.6 | 51.2 | 53.0 |
| Had any teeth extracted due to decay, abscess or infection in the past 12 months (self-reported), 1–14 years, %, 2022/23 | 6.0 | 7.6 | 6.7 | 2.3 | 3.6 | 2.9 |
| Had any teeth extracted due to decay, abscess, infection or gum disease in the past 12 months (self-reported), 15+ years, %, 2022/23 | 10.4 | 10.2 | 10.6 | 4.4 | 4.6 | 4.7 |
Notes:
- Figures are age-standardised to the total Māori population as recorded in the 2001 Census.
- Prioritised ethnicity has been used – see ‘Ngā tapuae me ngā raraunga: Methods and data sources’ for further information.
Source: 2022/23 NZHS
There was no significant difference between Māori and non-Māori children aged 1–14 years (RR 0.99, CI 0.93–1.06) in terms of having visited a dentist in the past 12 months, in 2022/23. However, Māori adults were less likely than non-Māori adults to have visited a dentist in the past 12 months (RR 0.88, CI 0.80–0.98).
Among adults with natural teeth, Māori adults were more likely than non-Māori adults to report that they never visited a dental health care worker, or usually only visited a dental health care worker for dental problems (RR 1.25, CI 1.17–1.34).
Māori children aged 1–14 years were more than twice as likely as non-Māori children in the same age group to have had any teeth extracted due to decay, abscess or infection in the past 12 months (RR 2.23, CI 1.37–3.62). Similarly, Māori adults were about twice as likely as non-Māori adults to have had any teeth extracted due to decay, abscess, infection or gum disease in the past 12 months (RR 2.07, CI 1.56–2.73).
Mental health
| Indicator | Māori | Non-Māori | ||||
|---|---|---|---|---|---|---|
Males | Females | Total | Males | Females | Total | |
| Experiencing high or very high psychological distress (K10 score of 12 or higher), 15+ years, %, 2022/23 | 16.7 | 21.5 | 19.1 | 11.8 | 15.1 | 13.7 |
Notes:
- Figures are age-standardised to the total Māori population as recorded in the 2001 Census.
- Prioritised ethnicity has been used – see ‘Ngā tapuae me ngā raraunga: Methods and data sources’ for further information.
- Adult respondents (aged 15+ years) are categorised as experiencing high or very high psychological distress if they have a score of 12 or more on the Kessler Psychological Distress Scale (K10), which is the NZHS’s most commonly used indicator of psychological distress.
- The K10 was developed to identify severe non-specific psychological distress in population surveys (Kessler et al 2003). It is a screening tool rather than a diagnostic tool, so it is not recommended to use it to measure the prevalence of mental health conditions in the population.
Source: 2022/23 NZHS
Māori adults were about one-and-a-half times as likely as non-Māori adults to be classified as experiencing high or very high psychological distress (RR 1.45, CI 1.18–1.78).
Both Māori and non-Māori females were more likely than their male counterparts to experience high or very high psychological distress.
Infant health
| Indicator | Māori | Non-Māori | ||||
|---|---|---|---|---|---|---|
Males | Females | Total | Males | Females | Total | |
| Low birthweight, rate per 1000 live births, 2018-20 | 64.9 | 72.7 | 68.7 | 54.2 | 60.1 | 57.1 |
| Infant mortality, rate per 1000 live births, 2018-20 | 5.8 | 4.8 | 5.4 | 4.5 | 4.0 | 4.3 |
| Sudden unexpected death in infancy, rate per 1000 live births, 2018-20 | 1.6 | 1.3 | 1.5 | 0.5 | 0.3 | 0.4 |
| Sudden infant death syndrome, rate per 1000 live births, 2018-20 | 1.0 | 0.8 | 0.9 | 0.3 | 0.2 | 0.2 |
Notes:
- Crude rates and prioritised ethnicity have been used - see ‘Ngā tapuae me ngā raraunga: Methods and data sources’ for further information.
- ‘Low birthweight’ is defined as a birthweight of less than 2500 grams.
- ‘Infant mortality’ includes early neonatal deaths, late neonatal deaths and post-neonatal deaths.
- ‘Sudden unexpected death in infancy (SUDI)’ includes sudden infant death syndrome (SIDS), unintentional suffocation and other unspecified sudden deaths or unattended deaths from unknown causes. More information can be found on the Hāpai: SUDI Prevention Coordination Service website.
Sources: 2018-20 Mortality Collection Data Set, Te Whatu Ora, National Maternity Collection, Te Whatu Ora
The prevalence of low birthweight was higher for Māori than non-Māori in 2018–20 (RR 1.20, CI 1.16–1.24).
The Māori infant mortality rate was also higher than that of non-Māori (RR 1.26, CI 1.09–1.45).
The sudden unexpected death in infancy mortality rate among Māori infants was nearly four times as high as that among non-Māori infants (RR 3.93, CI 2.73–5.65). This disparity was greater for females – the sudden unexpected death in infancy mortality rate was about four-and-a-half times as likely in Māori baby girls as it was in non-Māori baby girls (RR 4.52, CI 2.55–8.03).
The sudden infant death syndrome mortality rate for Māori infants was about four times that of non-Māori infants (RR 3.80, CI 2.41–6.01).
| Indicator | Māori | Non-Māori | ||||
|---|---|---|---|---|---|---|
Males | Females | Total | Males | Females | Total | |
| Exclusively breastfed until at least four months (among children aged four months to under five years of age), %, 2022/23 | 57.0 | 43.3 | 50.1 | 57.4 | 65.2 | 61.3 |
| Exclusively breastfed until at least six months (among children aged six months to under five years of age), %, 2022/23 | 5.2* | 16.1* | 10.6* | 7.8 | 10.3 | 9.1 |
Notes:
- Figures are age-standardised to the total Māori population as recorded in the 2001 Census.
- Prioritised ethnicity has been used - see ‘Ngā tapuae me ngā raraunga: Methods and data sources’ for further information.
- * Estimates with a high relative sampling error (over 30%). Results with a high relative sampling error are less precise than those with a low relative sampling error.
- ‘Exclusively breastfed’ means the infant has not been given any liquids or solids (other than prescription medicines) other than breast milk.
Source: 2022/23 NZHS
Māori babies were equally likely as non-Māori babies to have been exclusively breastfed when they were four months old (RR 0.82, CI 0.64–1.04) and six months old (RR 1.17, CI 0.55–2.50).
Unintentional injury
| Indicator | Māori | Non-Māori | ||||
|---|---|---|---|---|---|---|
Males | Females | Total | Males | Females | Total | |
| All unintentional injury mortality, 0-14 years, rate per 100,000, 2018-20 | 10.5 | 8.9 | 9.7 | 5.3 | 2.8 | 4.1 |
| All unintentional injury mortality, 15-64 years, rate per 100,000, 2018-20 | 50.2 | 16.9 | 33.2 | 20.2 | 7.0 | 13.6 |
| All unintentional injury mortality, 65+ years, rate per 100,000, 2018-20 | 74.6 | 59.6 | 67.3 | 71.1 | 51.5 | 60.9 |
| All unintentional injury hospitalisations, 0-14 years, rate per 100,000, 2020-22 | 1,382.7 | 1,033.6 | 1,213.3 | 1,180.2 | 831.2 | 1,010.1 |
| All unintentional injury hospitalisations, 15-64 years, rate per 100,000, 2020-22 | 2,001.7 | 1,066.3 (1,042.4–1,086.2) | 1,530.2 | 1,345.5 | 699.5 | 1,026.1 |
| All unintentional injury hospitalisations, 65+ years, rate per 100,000, 2020-22 | 3,437.5 | 3,056.9 | 3,238.5 | 3,222.0 | 3,488.4 | 3,373.5 |
Notes:
- Figures are age-standardised to the total Māori population as recorded in the 2001 Census.
- Prioritised ethnicity has been used – see ‘Ngā tapuae me ngā raraunga: Methods and data sources’ for further information.
Sources: 2018-20 Mortality Collection Data Set, Te Whatu Ora; 2020-22 National Minimum Data Set, Te Whatu Ora
Māori children aged 0–14 years had an unintentional injury mortality rate more than twice that of non-Māori children in the same age group in 2018–20 (RR 2.39, CI 1.75–3.28). The disparity was greater among girls – Māori girls had an unintentional injury mortality rate more than three times as likely as non-Māori girls (RR 3.21, CI 1.93–5.35). Māori children had a significantly higher unintentional injury hospitalisation rate than that of non-Māori children in 2020–22 (RR 1.20, CI 1.17–1.23).
In the equivalent time periods, Māori adults aged 15–64 years had an unintentional injury mortality rate more than twice that for non-Māori adults in the same age group (RR 2.44, CI 2.19–2.72), and the unintentional injury hospitalisation rate for Māori was about 50% higher than that of non-Māori adults (RR 1.49, CI 1.47–1.51).
Māori adults aged 65 years or over had a similar unintentional injury mortality rate as that of non-Māori (RR 1.11, CI 0.92–1.33). Māori females in this age group had significantly lower unintentional injury hospitalisation rates than non-Māori females (RR 0.88, CI 0.85–0.91); however, Māori males had higher unintentional injury hospitalisation rates than non-Māori males (RR 1.07, CI 1.03–1.11).
| Māori | Non-Māori | |
|---|---|---|
| Males | 0–14 years Suffocation/accidental threats to breathing Motor vehicle accidents Accidental drowning and submersion | 0–14 years Motor vehicle accidents Suffocation/accidental threats to breathing Accidental drowning and submersion |
15–64 years Motor vehicle accidents Accidental poisoning by exposure to noxious substances Accidental drowning and submersion | 15–64 years Motor vehicle accidents Accidental poisoning by exposure to noxious substances Falls | |
65+ years Falls Motor vehicle accidents Accidental drowning and submersion | 65+ years Falls Motor vehicle accidents Accidental poisoning by exposure to noxious substances | |
| Females | 0–14 years Motor vehicle accidents Suffocation/accidental threats to breathing Accidental poisoning by exposure to noxious substances | 0–14 years Motor vehicle accidents Suffocation/accidental threats to breathing Accidental drowning and submersion |
15–64 years Motor vehicle accidents Accidental poisoning by exposure to noxious substances Falls | 15–64 years Motor vehicle accidents Accidental poisoning by exposure to noxious substances Falls | |
65+ years Falls Motor vehicle accidents Suffocation/accidental threats to breathing | 65+ years Falls Motor vehicle accidents Accidental poisoning by exposure to noxious substances |
Note: Prioritised ethnicity has been used – see ‘Ngā tapuae me ngā raraunga: Methods and data sources’ for further information.
Source: 2018-20 Mortality Collection Data Set, Te Whatu Ora
Table 40 shows that the three most common causes of unintentional injury mortality differed by age group, gender and ethnicity in 2018–20.
Motor vehicle accidents were a common cause of unintentional injury causing death for all groups.
For older people aged 65 years and over, falls were the most common cause of death by unintentional injury.
Ngā ratonga hauora kua mahia Health service use
This section presents indicators that look at use of health services, with a focus on primary health care providers. Primary health care providers are a person’s first point of contact with the health system – they include general practice teams, after-hours clinics and some community health services. This section also includes indicators on prescriptions and unmet need for health care.
Primary health care
| Indicator | Māori | Non-Māori | ||||
|---|---|---|---|---|---|---|
Males | Females | Total | Males | Females | Total | |
| Has a general practice or medical centre that usually goes to when unwell or injured (self-reported), 0–14 years, %, 2022/23 | 97.9 | 98.0 | 98.0 | 97.2 | 96.3 | 96.8 |
| Has a general practice or medical centre that usually goes to when unwell or injured (self-reported), 15+ years, %, 2022/23 | 91.8 | 93.2 | 92.7 | 89.2 | 95.7 | 92.4 |
| Visited a general practitioner in the past 12 months (self-reported), 15+ years, %, 2022/23 | 62.6 | 65.7 | 64.2 | 63.8 | 74.6 | 69.0 |
| Visited a practice nurse (without seeing a general practitioner at the same visit) in the past 12 months (self-reported), 15+ years, %, 2022/23 | 25.1 | 33.2 | 29.4 | 20.7 | 33.5 | 27.1 |
Notes:
- Figures are age-standardised to the total Māori population as recorded in the 2001 Census.
- Prioritised ethnicity has been used – see ‘Ngā tapuae me ngā raraunga: Methods and data sources’ for further information.
Source: 2022/23 NZHS
Māori were equally as likely as non-Māori to report having a general practice clinic or medical centre that they usually went to when unwell or injured in 2022/23 (RR 1.01, CI 1.00–1.03 for children; RR 1.01, CI 0.98–1.03 for adults).
Both Māori and non-Māori males were less likely to have seen a general practice worker in the past 12 months than their female counterparts.
Table 41 shows that Māori adults were equally as likely as non-Māori adults to report having seen a general practitioner (GP) in the past 12 months (RR 0.94, CI 0.89–1.00). Māori males were more likely than non-Māori males to have seen a nurse without seeing a GP in the same visit (RR 1.22, CI 1.02–1.47).
| Indicator | Māori | Non-Māori | ||||
|---|---|---|---|---|---|---|
Males | Females | Total | Males | Females | Total | |
| Experienced one or more types of unmet need for primary health care (self-reported), 0–14 years, %, 2022/23 | 22.0 | 24.8 | 23.4 | 19.0 | 19.6 | 19.3 |
| Unmet need for a GP due to time taken to get an appointment (self-reported), 0–14 years, %, 2022/23 | 16.1 | 17.5 | 16.7 | 13.5 | 15.1 | 14.3 |
| Unmet need for a GP due to cost (self-reported), 0–14 years, %, 2013/14 | 1.5* | 1.2* | 1.3* | 1.2 | 0.9* | 1.1 |
| Unmet need for a GP due to lack of transport (self-reported), 0–14 years, %, 2022/23 | 1.6* | 2.5* | 2.0 | 0.6* | 0.4* | 0.5* |
| Unmet need for a GP due to lack of care for a dependant (self-reported), 0–14 years, %, 2022/23 | 0.0* | 3.0* | 1.5* | 0.7* | 0.5* | 0.6* |
| Unmet need for a GP due to disliking or fearing the GP (self-reported), 0–14 years, %, 2022/23 | 1.5* | 1.2* | 1.4* | 0.9* | 0.8* | 0.9 |
| Unmet need for a GP due to lack of time off work (self-reported), 0–14 years, %, 2022/23 | 2.6* | 2.3* | 2.5 | 1.9 | 2.0* | 1.9 |
Notes:
- * Estimates with a high relative sampling error (over 30%). Results with a high relative sampling error are less precise than those with a low relative sampling error.
- Figures are age-standardised to the total Māori population as recorded in the 2001 Census.
- Prioritised ethnicity has been used - see ‘Ngā tapuae me ngā raraunga: Methods and data sources’ for further information.
- Unmet need for primary health indicator investigates whether people had experienced any of the following barriers to accessing primary health care in the last 12 months: unmet need for a GP due to cost, unmet need for a GP due to lack of transport, unmet need for a GP due to wait time being too long, unmet need for a GP due to owing money to the clinic, unmet need for a GP due to disliking or fearing the GP, unmet need for a GP due to lack of time off work, unmet need for a GP due to lack of care for a dependant and unmet need for a GP due to lack of support person or interpreter, and includes ‘Other reasons’.
Source: 2022/23 NZHS
Māori children were equally likely as non-Māori children to have experienced one or more types of unmet need for primary health care in 2022/23 (RR 1.22, CI 0.97–1.52).
However, Māori children were more than four times as likely as non-Māori children to have experienced an unmet need for a GP due to lack of transportation (RR 4.12, CI 1.50–11.34).
| Indicator | Māori | Non-Māori | ||||
|---|---|---|---|---|---|---|
Males | Females | Total | Males | Females | Total | |
| Experienced one or more types of unmet need for primary health care (self-reported), 15+ years, %, 2022/23 | 31.9 | 42.8 | 37.7 | 29.0 | 35.1 | 32.0 |
| Unmet need for a GP due to waiting time too long (self-reported), 15+ years, %, 2022/23 | 20.7 | 28.9 | 24.9 | 19.0 | 24.0 | 21.5 |
| Unmet need for a GP due to cost (self-reported), 15+ years, %, 2022/23 | 13.1 | 22.4 | 17.8 | 11.8 | 17.0 | 14.5 |
| Unmet need for a GP due to owing money to the clinic (self-reported), 15+ years, %, 2022/23 | 1.4* | 3.7 | 2.6 | 1.1* | 2.2 | 1.7 |
| Unmet need for a GP due to lack of transport (self-reported), 15+ years, %, 2022/23 | 3.7* | 3.2 | 3.4 | 1.4 | 3.1 | 2.4 |
| Unmet need for a GP due to disliking or fearing the GP (self-reported), 15+ years, %, 2022/23 | 1.9* | 3.1 | 2.8 | 1.8 | 3.2 | 2.6 |
| Unmet need for a GP due to lack of time off work (self-reported), 15+ years, %, 2022/23 | 8.5 | 10.6 | 9.6 | 7.5 | 9.8 | 8.6 |
| Unmet need for a GP due to lack of care for a dependant (self-reported), 15+ years, %, 2022/23 | 0.5* | 4.8 | 2.8 | 0.5* | 2.0 | 1.2 |
| Unmet need for a GP due to lack of a support person or interpreter (self-reported), 15+ years, %, 2022/23 | 0.4* | 0.9* | 0.6* | 0.0* | 0.2* | 0.1* |
Notes:
- *Estimates with a high relative sampling error (over 30%). Results with a high relative sampling error are less precise than those with a low relative sampling error.
- Figures are age-standardised to the total Māori population as recorded in the 2001 Census.
- Prioritised ethnicity has been used - see ‘Ngā tapuae me ngā raraunga: Methods and data sources’ for further information.
- Unmet need for primary health indicator investigates whether people had experienced any of the following barriers to accessing primary health care in the last 12 months: unmet need for a GP due to cost, unmet need for a GP due to lack of transport, unmet need for a GP due to wait time being too long, unmet need for a GP due to owing money to the clinic, unmet need for a GP due to disliking or fearing the GP, unmet need for a GP due to lack of time off work, unmet need for a GP due to lack of care for a dependant and unmet need for a GP due to lack of support person or interpreter, and includes ‘Other reasons’.
Source: 2022/23 NZHS
Māori adults were more likely than non-Māori adults to have experienced one or more types of unmet need for primary health care in 2022/23 (RR 1.19, CI 1.05–1.33).
Māori adults were more likely than non-Māori adults to have experienced an unmet need for a GP due to cost (RR 1.25, CI 1.05–1.50).
Māori adults were more than one-and-a-half times as likely as non-Māori adults to have experienced an unmet need for a GP due to owing money to the clinic (RR 1.77, CI 1.03–3.05).
Lack of care for a dependant was about twice as likely to be a barrier to accessing GP services for Māori adults as it was for non-Māori adults (RR 2.04, CI 1.22–3.43).
Prescriptions
| Indicator | Māori | Non-Māori | ||||
|---|---|---|---|---|---|---|
Males | Females | Total | Males | Females | Total | |
| Unfilled prescriptions due to cost in past 12 months (self-reported), 0–14 years, %, 2022/23 | 1.0* | 1.9* | 1.5* | 1.0* | 1.9* | 1.4 |
| Unfilled prescriptions due to cost in past 12 months (self-reported), 15+ years, %, 2022/23 | 4.1 | 11.0 | 7.6 | 3.1 | 4.7 | 3.9 |
Notes:
- Figures are age-standardised to the total Māori population as recorded in the 2001 Census.
- Prioritised ethnicity has been used – see ‘Ngā tapuae me ngā raraunga: Methods and data sources’ for further information.
- *Estimates with a high relative sampling error (over 30%). Results with a high relative sampling error are less precise than those with a low relative sampling error.
Source: 2022/23 NZHS
In 2022/23, Māori children were equally as likely as non-Māori children to have reported not collecting prescriptions due to cost at any time in the last 12 months (RR 1.02, CI 0.30–3.44).
Māori adults were more than twice as likely as non-Māori adults to have reported not collecting prescriptions due to cost at any time in the last 12 months (RR 2.12, CI 1.59–2.83).
Ngā pūnaha hauora tūtohu Health system indicators
The indicators in this section measure the performance of the health system and include amenable mortality and ambulatory-sensitive hospitalisation.
The Ministry of Health defines amenable mortality as ‘deaths from those conditions for which variation in mortality rates (over time and across populations) reflects variation in the coverage and quality of health care (preventive or therapeutic services) delivered to individuals’ (Ministry of Health 2010a). Amenable mortality only includes deaths as defined above occurring in those less than 75 years of age.
The Ministry of Health defines ambulatory-sensitive hospitalisations as hospitalisations of people less than 75 years old resulting from diseases sensitive to prophylactic or therapeutic interventions that are deliverable in a primary health care setting.
Appendix 1 provides ICD-10-AM code lists for these categories.
| Indicator | Māori | Non-Māori | ||||
|---|---|---|---|---|---|---|
Males | Females | Total | Males | Females | Total | |
| Amenable mortality, 0–74 years, rate per 100,000, 2018–20 | 148.7 | 100.3 | 123.8 | 64.3 | 41.5 | 52.8 |
| Ambulatory-sensitive hospitalisation, 0–4 years, crude rate per 100,000, 2020–22 | 7,165.0 | 5,876.5 (5,742.9- 6,012.3) | 6,541.5 | 6,222.2 - (6,138.0- 6,307.3) | 4,983.3 (4,906.3- 5,061.2) | 5,617.3 |
| Ambulatory-sensitive hospitalisation, 45–64 years, rate per 100,000, 2020–22 | 6,347.8 (6,249.6- 6,447.3) | 6,395.2 (6,299.3- 6,492.1) | 6,371.2 | 3,210.6 | 2,737.4 (2,712.1- 2,763.0) | 2,968.0 |
Notes:
- 0–74 and 45–64 age groups are age-standardised to the total Māori population as recorded in the 2001 Census.
- Prioritised ethnicity has been used - see ‘Ngā tapuae me ngā raraunga: Methods and data sources’ for further information.
Sources: 2018-20 Mortality Collection Data Set, Te Whatu Ora; 2020-22 National Minimum Data Set, Te Whatu Ora
Amenable mortality rates among Māori aged 0–74 years were more than twice as high as those among non-Māori in the same age group in 2018–20 (RR 2.34, CI 2.25–2.44).
Ambulatory-sensitive hospitalisation rates among Māori aged 45–64 years were more than twice as high as those of non-Māori in the age group in 2020–22 (RR 2.15, CI 2.12–2.17).
Ambulatory-sensitive hospitalisation rates among Māori aged zero to four years were about 20% higher than those of non-Māori in the age group in 2020–22 (RR 1.16, CI 1.14–1.19).
Saving Lives: Amenable mortality in New Zealand, 1996–2006 (Ministry of Health 2010a) contains further analyses comparing Māori with non-Māori.
Tāpiritanga Appendices
Appendix 1: Data sources and ICD-10-AM codes
| Source (agency or collection) | Data | Period | Type of data |
|---|---|---|---|
| Ministry of Health | Mortality Collection Data Set – mortality* | 2018-20 | National collection |
| National Minimum Data Set – hospitalisations** | 2020-22 | National collection | |
| New Zealand Cancer Registry – cancer registrations | 2018-20 | National collection | |
| Stats NZ | Low birthweight, live births | 2018-20 | Birth registration |
| Life expectancy | 1950-52 to 2017-19 | Life tables | |
| Demographics | 2023 | Census | |
| Population projections | 2020-40 | Projection estimates | |
| Socioeconomic indicators | 2018 | Census | |
| Institute of Environmental Science and Research Ltd | Meningococcal disease notifications | 2023 | Notifications |
| Tuberculosis notification | 2023 | Notifications | |
| New Zealand Health Survey | Risk and protective factors, disease prevalence, health service use and self-rated health | 2022/23 | Survey |
| Action on Smoking and Health Snapshot Survey | Smoking and vaping prevalence for youth | 2022 | Survey |
| Community Oral Health Service | Oral health data for age 5 and school year 8 | 2021 | Administrative |
* Mortality data for 2018 is final. Mortality data for 2019 and 2020 is preliminary (Te Whatu Ora 2021).
**Short-stay emergency department events were excluded.
| Condition | ICD-10-AM code |
|---|---|
| Pulmonary tuberculosis | A15–A16 |
| Meningococcal disease | A39 |
| Pneumococcal disease | A40.3, G00.1, J13 |
| Hepatitis C (HCV) * | B17.1, B18.2 |
| HIV/AIDS | B20–B24 |
| Cancers | |
| Stomach | C16 |
| Rectal | C19–C21 |
| Bone and cartilage | C40–C41 |
| Melanoma of skin | C43 |
| Female breast | C50 |
| Cervical | C53 |
| Uterine * | C54, C55 |
| Prostate | C61 |
| Testis | C62 |
| Thyroid | C73 |
| Hodgkin lymphoma | C81 |
| Acute lymphoblastic leukaemia** | C91.0 |
| Complications of pregnancy | O00–O96, O98–O99 |
| Complications of the perinatal period | P01–P03, P05–P94 |
| Cardiac septal defect | Q21 |
| Diabetes | E10–E14 |
| Valvular heart disease | I01, I05–I09, I33–I37 |
| Hypertensive diseases | I10–I13 |
| Coronary disease | I20–I25 |
| Pulmonary embolism | I26 |
| Atrial fibrillation & flutter* | I48 |
| Heart failure | I50 |
| Cerebrovascular diseases | I60–I69 |
| Chronic obstructive pulmonary disease | J40–J44 |
| Asthma | J45–J46 |
| Peptic ulcer disease | K25–K27 |
| Cholelithiasis | K80 |
| Renal failure | N17–N19 |
| Land transport accidents excluding trains | V00–V04, V06–V14, V16–V24, V26–V34, V36–V44, V46–V54, V56–V64, V66–V74, V76–V79, V80.0–V80.5, V80.7–V80.9, V82–V86, V87.0–V87.5, V87.7–V87.9, V88.0–V88.5, V88.7–V88.9, V89, V98–V99 |
| Accidental falls on same level | W00–W08, W18 |
| Fire | X00–X09 |
| Suicide | X60–X84 |
* Conditions added in the 2016 update. Treatment Injury was removed due to data quality concerns.
** Age 0–44 years.
| Condition | ICD-10-AM code |
|---|---|
| Angina and chest pain* | I20, R072–R074 |
| Asthma | J45–J46, R062^ |
| Bronchiectasis* | J47 |
| Cellulitis | H000, H010, J340, L01–L04, L08, L980 |
| Cervical cancer* | C53 |
| Congestive heart failure* | I50, J81 |
| Constipation | K590 |
| Dental conditions& | K02, K04–K05 |
| Dermatitis and eczema | L20–L30 |
| Diabetes* | E10–11, E13–E14, E162 |
| Epilepsy* | G40–G41, O15, R560, R568 |
| Gastroenteritis/dehydration | A02–A09, R11, K529 |
| Gastro-oesphageal reflux disease (GORD) | K21 |
| Hypertensive disease* | I10–I15, I674 |
| Kidney/urinary infection** | N10, N12, N136, N309, N390 |
| Myocardial infarction* | I21–I23, I241 |
| Nutrition deficiency and anaemia | D50–D53, E40–E46, E50–E56, E58–E61, E63, M833* |
| Other ischaemic heart disease* | I240, I248–I249, I25 |
| Peptic ulcer* | K25–K28 |
| Respiratory infections – pneumonia | J13–J16, J18 |
| Rheumatic fever/heart disease | I00–I02, I05–I09 |
| Sexually transmitted infections* | A50–A60, A63–A64, M023, N341 |
| Stroke* | I61, I63–I66 |
| Upper respiratory tract and ENT infections | J00–J04, J06, H65–H67 |
| Vaccine-preventable disease – meningitis, whooping cough, hepatitis B, pneumococcal disease, other*** | A33–A37, A80, A403, B16, B18 |
| Vaccine-preventable disease – MMR**** | B05–B06, B26, P350* |
* Applicable ages ≥ 15 years.
** Applicable ages ≥ 5 years.
*** Applicable ages = 6 months to 14 years.
**** Applicable ages = 15 months to 14 years.
^ Applicable ages = 0 to 4 years.
& Includes elective events.
| Condition | ICD-10-AM code |
|---|---|
| Diseases of the circulatory system (total cardiovascular disease) | I00–I99 |
| Acute rheumatic fever | I00–I02 |
| Chronic rheumatic heart disease | I05–I09 |
| Ischaemic heart disease | I20–I25 |
Heart failure Other forms of heart disease (including heart failure) | I50 I30-I52 |
| Cerebrovascular disease (stroke) | I60–I69 |
| Chronic obstructive pulmonary disease | J40–J44 |
| Asthma | J45–J46 |
| All revascularisation (CABG and angioplasty) heart disease procedures | 3530400, 3850500, 9022100, 3530500, 3531000, 3531002, 3849700, 3849701, 3849702, 3849703, 3850000, 3850300, 3849704 |
| Diabetes | E10–E14 |
| Diabetes complications with renal failure | E10.2, E11.2, E12.2, E13.2, E14.2 |
| Lower limb amputation with concurrent diabetes | E10–E14 together with 4433800, 4435800, 9055700, 4436100, 4436400, 4436401, 4436101, 4437000, 5023600, 4437300, 5023300, 4436700, 5023602, 4436701, 4436702 |
| Total cancers | C00–C96, D45–D47 |
| Stomach cancer | C16 |
| Colorectal cancer | C18–C21 |
| Liver cancer | C22 |
| Lung cancer | C33–C34 |
| Prostate cancer | C61 |
| Breast cancer (female only) | C50 |
| Cervical cancer | C53 |
| Uterine (uterus) cancer | C54–C55 |
| Sudden unexpected death in infancy | R95–R96, R98–R99, W75, W78–W79 |
| Sudden infant death syndrome | R95 |
| Unintentional injuries (accidents) | V00–X59 |
| Motor vehicle accidents | V02–V04, V09.0–V09.3, V12–V14, V19.0–V19.6, V20–V79, V80.3–V80.5, V81.0–V81.1, V82.0–V82.1, V83.0–V83.3, V84.0–V84.3, V85.0–V85.3, V86.0–V87.8, V88.0–V88.8, V89.0, V89.2, V89.9 |
| Falls | W00–W19 |
| Drownings and submersions | W65–W74 |
| Suffocation | W75–W84 |
| Poisonings | X40–X49 |
| Suicide and self-harm | X60–X84 |
| Assault and homicide | X85–Y09 |
Appendix 2: 2001 Census total Māori population
| Age group (years) | 2001 Census total Māori population | Weighting |
|---|---|---|
| 0–4 | 67,404 | 12.81 |
| 5–9 | 66,186 | 12.58 |
| 10–14 | 62,838 | 11.94 |
| 15–19 | 49,587 | 9.42 |
| 20–24 | 42,153 | 8.01 |
| 25–29 | 40,218 | 7.64 |
| 30–34 | 39,231 | 7.46 |
| 35–39 | 38,412 | 7.30 |
| 40–44 | 32,832 | 6.24 |
| 45–49 | 25,101 | 4.77 |
| 50–54 | 19,335 | 3.67 |
| 55–59 | 13,740 | 2.61 |
| 60–64 | 11,424 | 2.17 |
| 65–69 | 8,043 | 1.53 |
| 70–74 | 5,046 | 0.96 |
| 75–79 | 2,736 | 0.52 |
| 80–84 | 1,251 | 0.24 |
| 85+ | 699 | 0.13 |
Pūtea kōrero References
Ajwani S, Blakely T, Robson B, et al. 2003. Decades of Disparity: Ethnic mortality trends in New Zealand 1980–1999. Wellington: Ministry of Health and University of Otago.
Asia Pacific Cohort Studies Collaboration. 2004. Body mass index and cardiovascular disease in the Asia-Pacific Region: an overview of 33 cohorts involving 310,000 participants. International Journal of Epidemiology 33: 751–8.
Atkinson J, Salmond C, Crampton P (2019). NZDep2018 Index of Deprivation. Interim Research Report, December 2019. Wellington: Department of Public Health, University of Otago.
Blakely T, Tobias M, Atkinson J, et al. 2007. Tracking Disparity: Trends in ethnic and socioeconomic inequalities in mortality, 1981–2004. Wellington: Ministry of Health.
Cole TJ, Bellizzi MC, Flegal KM, et al. 2000. Establishing a standard definition for child overweight and obesity worldwide: international survey. British Medical Journal 320: 1-6.
Cole TJ, Flegal KM, Nicholls D, et al. 2007. Body mass index cut offs to define thinness in children and adolescents: international survey. British Medical Journal 335(7612): 194.
Cormack D, Harris R. 2009. Issues in Monitoring Māori Health and Ethnic Disparities: An update. Wellington: Te Rōpū Rangahau Hauora a Eru Pōmare.
Fawcett J, Atkinson J, Herd P, et al. 2008. Record Linkage of Census and Mortality 2001–04 Records: New Zealand Census-Mortality Technical Report No. 6. Wellington: Department of Public Health, University of Otago.
Harris R, Cormack D, Tobias M, et al. 2012. The pervasive effects of racism: Experience of racial discrimination in New Zealand over time and associations with multiple health domains. Social Science & Medicine 74(3): 408–15.
Harris R, Purdie G, Robson B, et al. 2007. Appendix 3: Estimating Māori Hospitalisation and Cancer Registrations. In Robson B and Harris R (eds). Hauora: Māori Standards of Health IV. A study of the years 2000–2005. Wellington: Te Rōpū Rangahau Hauora a Eru Pōmare.
Kessler RC, Barker PR, Colpe LJ, et al. 2003. Screening for serious mental illness in the general population. Archives of General Psychiatry 60(2): 184-9.
Ministry of Health. 1999. Our Health, Our Future: Hauora Pakari, Koiora Roa. Wellington: Ministry of Health.
Ministry of Health. 2003. Food and Nutrition Guidelines for Healthy Adults: A background paper. Wellington: Ministry of Health.
Ministry of Health. 2020. Eating and Activity Guidelines for New Zealand Adults: Updated 2020. Wellington: Ministry of Health.
Ministry of Health. 2004. Ethnicity Data Protocols for the Health and Disability Sector. Wellington: Ministry of Health.
Ministry of Health. 2006. Tatau Kahukura: Māori Health Chart Book, Public Health Intelligence Monitoring Report No.5. Wellington: Ministry of Health.
Ministry of Health. 2010a. Saving Lives: Amenable mortality in New Zealand, 1996–2006. Wellington: Ministry of Health.
Ministry of Health. 2010b. Tatau Kahukura: Māori Health Chart Book 2010, 2nd Edition. Wellington: Ministry of Health.
Ministry of Health. 2011. Tatau Kura Tangata: Health of Older Māori Chart Book 2011. Wellington: Ministry of Health.
Ministry of Health. 2012. Ways and Means: A report on methodology from the New Zealand Burden of Diseases, Injuries and Risk Factors Study, 2006–2016. Wellington: Ministry of Health.
Ministry of Health. 2013. Mātātuhi Tuawhenua: Rural Hospitalisations 2007 to 2011. Wellington: Ministry of Health.
Ministry of Health. 2014a. Annual Update of Key Results 2013/14: New Zealand Health Survey. Wellington: Ministry of Health.
Ministry of Health. 2014b. Indicator Interpretation Guide 2013/14: New Zealand Health Survey. Wellington: Ministry of Health.
Ministry of Health. 2023. Methodology Report 2022/23: New Zealand Health Survey. Wellington: Ministry of Health.
Robson B, Cormack D, Cram F. 2007. Chapter 3: Social and Economic Indicators. In Robson B and Harris R (eds). Hauora: Māori Standards of Health IV. A study of the years 2000–2005. Wellington: Te Rōpū Rangahau Hauora a Eru Pōmare.
Robson B, Harris R (eds). 2007. Hauora: Māori Standards of Health IV. A study of the years 2000–2005. Wellington: Te Rōpū Rangahau Hauora a Eru Pōmare.
Shaw C, Atkinson J, Blakely T. 2009. (Mis)classification of ethnicity on the New Zealand Cancer Registry: 1981–2004. New Zealand Medical Journal 122(1294): 10–22.
Sport New Zealand. 2022. Active NZ: Updating the participation landscape – the New Zealand Participation Survey 2021. Wellington: Sport New Zealand.
Statistics New Zealand. 2005. Māori Population: Looking out to 2021. Hui Taumata 2005. Wellington: Statistics New Zealand.
Te Whatu Ora. 2021. Mortality data web tool. URL: https://www.tewhatuora.govt.nz/for-health-professionals/data-and-statistics/mortality/data-web-tool (accessed 15 October 2024).
Te Whatu Ora. 2024a. About the National Cervical Screening Programme (NCSP). URL: https://www.tewhatuora.govt.nz/health-services-and-programmes/ncsp-hpv-screening/about (accessed 15 October 2024)
Te Whatu Ora, 2024b. Breast Screening coverage. URL: https://www.tewhatuora.govt.nz/health-services-and-programmes/breastscreen-aotearoa/breast-screening-coverage (accessed 15 October 2024)
Te Whatu Ora. 2024c. HPV immunisation programme. URL: https://www.tewhatuora.govt.nz/health-services-and-programmes/vaccine-information/hpv-immunisation-programme (accessed 15 October 2024).
Te Whatu Ora. 2024d. Immunisation coverage. URL: https://www.tewhatuora.govt.nz/health-services-and-programmes/vaccine-information/immunisation-coverage (accessed 15 October 2024).
WHO. 2007. Global Database on Body Mass Index. Geneva: World Health Organization.
Publishing information
- Copyright status
-
Owned by the Ministry of Health and licensed for reuse under a Creative Commons Attribution 4.0 International Licence.