

Foreword
Tēnā koutou katoa
I am pleased to present the Health and Independence Report 2024.
The Ministry of Health plays an essential role in monitoring the health system, using data and evidence to drive performance and inform future planning. This report provides robust data to support decision-making and monitor health system performance. This year’s report shows the progress we have made in many areas and highlights where we need to focus our efforts in the coming years.
Using data up to the end of the 2024 calendar year, the report shows the health system serves most New Zealanders well. This is reflected in key public health measures that show New Zealanders are living longer, spending more time in good health, smoking less and consuming less alcohol, and most are reporting that they are in good health. We are investing in and growing our health workforce with the aim of meeting increasing patient demand.
However, our health system is facing immediate and complex challenges such as an ageing population, long wait times and outdated infrastructure. Work is under way to address these challenges and improve access to high-quality health care for all New Zealanders.
We are making significant investment in the health system to help address the pressure that persists in key areas, such as access to general practitioners and elective services, constrained and crowded emergency departments, and ageing infrastructure that prohibits productivity. The Government’s Health Targets provide focus for the health sector so we can plan for a more proactive and preventative approach to health care.
Improvements can be observed in the decreasing gap in life expectancy and healthy life expectancy between males and females and Māori and non-Māori. However, differences in health outcomes between population groups remain a concern. We are seeing continued differences in mortality rates for urban and rural areas, and disabled people continue to be more likely to experience barriers to accessing primary care. These differences highlight the importance of delivering the basics of health care well, across the country. Ensuring people receive the care they need – regardless of socioeconomic circumstances, geographic location, disability or other demographic factors – is a priority.
The progress we have made in recent years – and our confidence that we will be able to meet the challenges ahead – is a testament to the dedication of the health workforce and the resilience of the individuals, families and communities we serve. After all, the dedicated people who work across our health system lay the foundation for healthy futures for all New Zealanders.
I look forward to seeing how the data and insights captured in this report will be used across the Ministry, and the broader health system, to inform future planning.
Ngā mihi
Audrey Sonerson
Director-General of Health
He wāhinga kōrero
Tēnā koutou katoa
E koa ana au ki te tāpae i te Pūrongo mō te Hauora me te Tū Motuhake 2024.
He tūnga waiwai hoki tō Te Manatū Hauora ki te aroturuki i te pūnaha hauora, e whakamahi ana i te raraunga me te taunakitanga kia kōkiri i te tutukinga, kia whai mōhio hoki te whakamahere anamata. Kei roto i te pūrongo nei ngā raraunga pakari hei tautoko i ngā whakataunga me te aroturuki i te tutukinga o te pūnaha hauora. E whakaatuhia ana i roto i te pūrongo o te tau nei tā mātou ahu whakamua i ngā wāhi maha. Ka whakahira hoki i ngā wāhi hei arotahi i ngā mahi mō ngā tau e heke mai nei.
E ai ki ngā raraunga nō te mutunga o te tau 2024, e whakaratohia paitia ana te nuinga o ngā tāngata o Aotearoa e te pūnaha hauora. E whakaatahia ana tēnei i roto i ngā inenga hauora tūmatanui matua. E piki ana te wāora o ngā tāngata o Aotearoa, he nui ake te wā e pai ana te hauora, he iti iho te kai paipa me te inu waipiro, ā, e pūrongorongo ana te nuinga e pai ana te hauora. E whakangao ana mātou ki tō mātou rāngaimahi hauora kia nui ake. Ko te whāinga he tutuki i te hiahia tūroro.
Heoi anō, he wero wawe, whīwhiwhi hoki kei te aroaro o tō mātou pūnaha hauora pērā i te taupori e kaumātua haere ana, te roanga o te tatari, me te tūāhanga tawhito. Kua tīmata te mahi hei urupare i ēnei wero, hei whakapai ake hoki i te āhei ki te ratonga hauora tino kounga mō ngā tāngata katoa o Aotearoa.
He nui tā mātou whakangao ki te pūnaha hauora hei āwhina ki te urupare i te pēhanga e haere tonu ana i ngā wāhi matua, pērā i te āhei ki ngā rata arowhānui me ngā ratonga kōwhiri, ngā tari ohotata e herea ana, e apiapi ana, me te tūāhanga tawhito e aukati ana i te māpuatanga. Hei arotahi mā te rāngai hauora ngā Whāinga Hauora o te Kāwanatanga kia whakamahere mātou me te ahunga matapae, whakatūpato hoki ki te ratonga hauora.
Nā runga anō i te whakawhāititanga o te āputa o te wāora me te wāora hauora pai i waenga i ngā tāne me ngā wāhine, i waenga hoki i ngāi tauiwi me ngāi Māori e kitea ana te pai haere. Heoi anō, ka noho tonu ngā rerekētanga o ngā putanga hauora i waenga i ngā whakarōpūtanga taupori hei āwangawangatanga. E kitea tonutia ana e mātou ngā rerekētanga o te pāpātanga mate i waenga i ngā takiwā rohe tāone me ngā takiwā tuawhenua, ā, he nui ake tonu te tūponotanga e pā atu ai ngā tauārai ki te āhei ki te taurimatanga mātāmua. Nā runga anō i ēnei rerekētanga he mea nui kia pai te whakarato i ngā āhuatanga waiwai o te ratonga hauora, puta noa i te motu. Te whakatūturu e whakawhiwhia ana te hunga ki te tiakitanga e hiahiatia – ahakoa he aha te āhuatanga ohapori, te tauwāhi matawhenua, te hauātanga, ētahi atu āhuatanga matawhenua rānei – tētahi tino whakaarotau.
Ko te koke whakamua nō ngā tau tata kua hipa – me tō mātou ngākau titikaha kia tutuki ngā wero kei mua i te aroaro – e whāki ana i te manawanui o te rāngaimahi hauora me te manawaroa o ngā tāngata takitahi, ngā whānau me ngā hapori e whakaratoa ana e mātou. Mā te hunga ngākaunui ki te kaupapa me ā rātou mahi, puta noa i tō tātou pūnaha hauora, e whakatakoto te tūāpapa o ngā pae ora mō ngā tāngata katoa o Aotearoa.
Ka nui taku hiahia kia kite he pēhea ngā raraunga me ngā māramatanga i hopukia ki te pūrongo e whakamahia ai e te Manatū Hauora, tae atu ki te pūnaha hauora whānui, kia whai mōhio te whakamahere anamata.
Ngā mihi
Audrey Sonerson
Te Tumu Whakarae mō te Hauora
Executive summary He whakarāpopototanga
Purpose
The Ministry of Health – Manatū Hauora produces the Health and Independence Report annually under section 3C of the Health Act 1956. It provides a comprehensive overview of the health and wellbeing of New Zealanders and the performance of the health system. This report, covering the 2024 calendar year, draws on a wide range of data and indicators to inform decision-making, support evidence-based policy and guide strategic planning across the health sector and beyond.
Key findings
The New Zealand health system is experiencing increased demand for services, driven by interrelated factors that span population needs, population health and the wider factors influencing health and system performance. Key findings are grouped by the report sections: ‘People of New Zealand’, ‘Health status’, ‘Health drivers’ and ‘Health system’.
1. People of New Zealand
The New Zealand population is growing. In 2024, the estimated resident population increased by 48,500 people (0.9%) from the year before to 5,356,700. It is projected to grow to 6,134,100 by 2044 (14.5% higher than today).
Currently, around one in six New Zealanders are aged 65 years and over. This is projected to increase to 22% of the population (around 1.36 million people) by 2044.
The population is becoming more diverse. In 2023, nearly a third (28.8%) of all New Zealanders were born overseas, from over 200 different birthplaces. By major ethnic group (total response ethnicity) the population is 17.8% Māori, 8.9% Pacific peoples, 17.3% Asian peoples, 1.9% Middle Eastern/Latin American/African and 67.8% European/Other.
The 2023 Household Disability Survey identified 17.0% of the population as disabled (851,000 people). The prevalence of disability was 10% for children and 18% for adults, however, within the adult population, 35% of adults aged 65 years and over were disabled.
2. Health status
The health status of New Zealanders presents as a mixed picture, reflecting progress in some areas and persistent challenges in others. Life expectancy in New Zealand is high by international standards; however, people living in areas of high socioeconomic deprivation, and Māori and Pacific peoples, still experience shorter lives and higher burden of disease.
Most adults rate their health as good, very good or excellent (85.4%), but this is down from 91.4% a decade ago. Rates of self-rated good health are lower for adults living in the most socioeconomically deprived neighbourhoods (79.4%), Māori adults (77.1%), Pacific adults (81.9%) and disabled adults (60.0%).
Non-communicable diseases are the leading contributors to health loss (death and disability) in New Zealand. The Government Policy Statement on Health 2024–2027 (Ministry of Health 2024c) includes the ‘5+5’ concept, which focuses on accelerating action to address five non-communicable diseases: cancer, cardiovascular disease, respiratory disease, diabetes and poor mental health. Together, these conditions account for around 80% of deaths and a considerable amount of the health loss New Zealanders experience. Key findings for these five conditions include the following.
- Cancers are the leading cause of death in New Zealand. While advances in early detection and treatment have improved survival rates, disparities in cancer rates and outcomes continue. Cancer screening programmes show an improving trend for breast cancer and cervical cancer screening coverage but a declining trend in bowel cancer screening.
- Ischaemic heart disease, the most common form of cardiovascular disease, is the second leading cause of death. Rates of death and disease from ischaemic heart disease differs by ethnic group and gender; it is higher for Māori and Pacific peoples and higher for males than females.
- Chronic respiratory diseases contribute to high levels of mortality, morbidity and health service use. These diseases are the third leading cause of death for Māori. Some of the most common respiratory diseases are chronic obstructive pulmonary disease, asthma, occupational lung diseases and pulmonary hypertension.
- Diabetes rates continue to increase. Rates are highest for Pacific peoples and Indian people. People living in the most socioeconomically deprived quintile have rates of diabetes 2.7 times higher than those in the least deprived quintile.
- Rates of psychological distress have climbed, especially for those aged 15–24 years (22.9%) and disabled adults (33.2%). Rates of unmet need for mental health and addiction services have increased, especially for disabled adults (22.2%) and disabled children (33.2%).
3. Health drivers
The conditions in which people live, and the access they have to everyday material needs, influence their health needs. In 2024, there were 156,000 children (13.4%) living in material hardship. Within this overall measure, rates were 23.9% for Māori children, 28.7% for Pacific children and 21.0% for disabled children, compared with 6.8% for Asian children and 10.1% for European/Other children.
Rates of daily smoking decreased to 6.9% of adults, and rates of hazardous drinking reduced to 16.6% of adults. However, fewer adults met nutrition guidelines (5.8%), and fewer met physical activity guidelines (46.6%). Obesity rates continued to increase for adults (33.8%) and children (12.5%), and the daily vaping rate rose to 11.1% of adults.
Determinants of health contribute to and compound differences in health outcomes, and while they explain some of the differences in outcomes, they do not do so completely. Māori living in areas of high deprivation have lives that are on average 7.4 years shorter than non-Māori, non-Pacific peoples living in the same areas. For Pacific peoples, this gap is 4.6 years.
4. Health system
This section assesses the state of the health system, including strategy, funding, workforce, experience of care, primary care and hospital care. It reports as follows.
- Trust in the health system has decreased to 6.1 out of 10, from 7.0 out of 10 a decade ago.
- Progress in terms of clinical quality and safety is mixed. There have been improvements in the areas of perioperative mortality, falls, and surgical site infections. Results have stagnated or worsened for pressure injuries, health care-associated infections, and perinatal and maternal mortality.
- Barriers to accessing primary care have increased: a quarter of all adults and almost one in five children report having had a medical problem but not seeing their GP due to the wait time for an appointment. Cost was reported as a barrier to seeing a GP by 15.5% of adults.
- Childhood immunisation rates have declined since 2015, especially for those living in the most socioeconomically deprived neighbourhoods, and for Māori and Pacific children.
- Nearly half of all adults (44.9%) avoided going to a dental health care worker due to cost. This was especially true for adults living in the most socioeconomically deprived neighbourhoods (51.7%), Pacific adults (57.2%), Māori adults (54.1%) and disabled adults (53.1%).
- Wait times for specialist assessment and elective treatment have increased, and emergency department volumes continue to increase, having risen 4.4% from the previous year.
- The proportion of hospital bed days used for acute care has increased. The total number of discharges for acute care rose by 22.7% between 2015 and 2023, and total bed days used for acute care rose by 28.0% over this period. This corresponds with reduced bed days for planned care services (arranged and elective care).
- Despite increases in health funding over the past two decades, and recent increases in health workforce numbers, the demand for services from New Zealanders is increasing.
5. Looking ahead
The Health and Independence Report 2024 paints a picture of a health system where services are in demand but not always timely or accessible. It highlights progress in some areas and provides invaluable insight into where the greatest opportunities lie and where future efforts should be targeted. Through bold, focused action – reflected in work already under way – it is possible to build a more productive, accessible, and sustainable health system that meets the changing needs of New Zealanders.
Introduction He kupu whakataki
The Health and Independence Report is a key accountability document produced by the Ministry of Health – Manatū Hauora. Under section 3C of the Health Act 1956, the Director-General of Health is required to produce a report each year that describes the state of public health in New Zealand; this fulfils that requirement.
This report covers the 2024 calendar year and presents a wide range of data broken down by deprivation area, ethnic group, age group, gender and disability status. Most of the data presented is from 2024. Where 2024 data is not available, the report uses the most up-to-date data available instead.
The Health and Independence Report 2024 provides insights into many factors that shape the health and wellbeing of New Zealanders, to offer a robust picture of how individuals and communities are faring and how effectively the health system is performing.
The first section, ‘People of New Zealand’, provides an overview of the population and how it is changing. This includes information on population growth, ageing and increasing diversity, and information about the rural population and disabled population.
The second section, ‘Health status’, presents population health measures, such as self-rated health and parent-rated child health. It also discusses health expectancy, life expectancy and mortality rates for the population. This section covers the prevalence and burden of non-communicable diseases, communicable diseases and multimorbidity.
The third section, ‘Health drivers’, discusses the broader factors that shape population health, including the determinants of health (such as poverty, housing and employment) and risk and protective factors. These are crucial for building long-term improvements in population wellbeing.
The fourth section, ‘Health system’, examines how the New Zealand health system is performing. It details health funding over time and changes in the health workforce. The section describes people’s experience of care: the quality and safety of the health care that New Zealanders receive, access and barriers to primary care, immunisation rates, hospitalisation rates and wait times across the system. It explores how well the system is meeting current needs at each level: primary care, specialist assessment and treatment, and emergency care.
The final section, ‘Looking ahead’, provides an overview of the current state of New Zealand’s health system, recognising progress made and highlighting areas where more work is needed. It outlines priorities and areas of focus for the next 12 months and sets out an ambition for a system that delivers well for all New Zealanders.
Sources and methods Ngā mātāpuna me ngā tikanga
Key concepts
Age standardisation
Age standardisation is a statistical method used to compare health-related rates (like mortality or disease incidence) between populations that have different age structures. This enables a more accurate picture of disease burden between groups. This report uses the World Health Organization (WHO) standard world population as the standard population for consistency with Health New Zealand – Te Whatu Ora data web tools.
Confidence intervals
A confidence interval gives an indication of uncertainty around a single value (such as an age-standardised rate). Confidence intervals are calculated with a stated probability; in this report, 95% (that is, each confidence interval has a 95% probability of containing the true value). The confidence interval is influenced by the sample size of the group. As the sample size becomes smaller, the confidence interval becomes wider, and there is less certainty about the rate. When figures in this report contain a confidence interval, it is presented using error bars on points or bars, or shaded areas along lines.
New Zealand Deprivation Index
The New Zealand Deprivation Index (NZDep2018) is a measure of socioeconomic deprivation in New Zealand, based on data collected from the 2018 Census. It assigns small geographic areas (meshblocks) a deprivation score from 1 (least deprived) to 10 (most deprived) (deciles) or from 1 to 5 (quintiles). These scores are derived from nine variables, reflecting dimensions such as income, employment, education, housing and access to transport and communication.
Geographic Classification for Health
The Geographic Classification for Health (GCH) is a rural-urban geographic classification developed by Otago University that is specific to health. It defines urban and rural categories that are based on distance to urban centres and relative size of the population. The GCH has two urban categories (U1 and U2) and three rural categories (R1, R2 and R3). These range from main urban centres (U1) to remote and isolated communities (R3). In this report, we have grouped R1, R2 and R3 into a single ‘rural’ classification.
Ethnic group classification
This report uses total response ethnicity whenever available from published data sources. Total response ethnicity recognises all aspects of someone’s ethnicity. However, datasets within the health sector have predominantly used prioritised ethnicity, which allocates people to a single ethnic group in the order Māori, Pacific peoples, Asian peoples, European/Other. Prioritised ethnicity allows for comparison between ethnic groups without overlapping.
Data sources
Data in this report is sourced from agencies including the Ministry of Health, Health New Zealand, Stats NZ – Tatauranga Aotearoa and the Health Quality & Safety Commission (HQSC) – Te Tāhū Hauora, in addition to many other data sources and publications. Further information about key data sources used in this report are described here.
The New Zealand Health Survey
The New Zealand Health Survey (the Health Survey) collects information about the health and wellbeing of adults and children in New Zealand, providing evidence to support health policy and strategy development. It has been completed every year since 2011/12.
The survey provides information on selected health risk behaviours (such as, smoking, diet, physical activity, and alcohol and drug use); the health status of New Zealanders, including their self-reported physical and mental health status; the prevalence of selected conditions, including diabetes; and use of health services.
The Health Survey presents results by:
- ethnic group: Māori, Pacific, Asian and European/Other, using total response ethnicity
- age: adults (aged 15 years and over) and children (aged from birth to 14 years)
- gender: male, female or another gender, such as non-binary
- disability status: using the Washington Group Short Set (see the ‘Disabled population’ section)
- deprivation: using NZDep2018 quintiles.
Further information about the Health Survey can be found in the Methodology Report (Ministry of Health 2024h).
Census and demographic data
New Zealand conducts a Census of Population and Dwellings every five years. The Census collects limited health information but contains a lot of social and economic information that is useful for this report in describing the factors that determine health. In addition, the Census forms the basis for determining New Zealand populations when calculating rates. Population projections are based on Census data, based on assumptions about factors such as migration, fertility and mortality.
People of New Zealand Ngā tāngata o Aotearoa
As a population grows, ages and becomes more diverse, demand for health care tends to rise. An ageing population typically leads to higher rates of long-term conditions such as cancers, heart disease, diabetes, and dementia, and a more diverse population requires appropriate health care to address varying health needs. The New Zealand population is steadily growing, ageing, and changing because of natural increases (births minus deaths) and migration.
Population
The population is growing
New Zealand has experienced steady population growth for the last 47 years. In the year ending December 2024, the population grew by around 48,500 people (0.9%), to reach an estimated 5,356,700 people (Stats NZ 2024g). Population growth is projected to continue. Twenty years from now (in 2044), the population is expected to reach 6,134,100, representing an increase of around 14.5% (777,400 more people) (Health New Zealand 2025s).
Until the early 1960s, population increases were driven primarily by natural growth; that is, births each year minus deaths. However, natural increases slowed in the 1960s and have slowed more significantly since 2010. In the year ended December 2024, 58,341 live births were registered in New Zealand (Stats NZ 2025b). This was 1,386 more (2.4% higher) than in 2023, when births had dropped to the lowest in 20 years. Annual births have been below 60,000 since 2016.
Age-specific fertility (or birth) rates measure the number of live births among 1,000 women in a particular age group in a given period (usually a year). Over the past decade, fertility rates have generally decreased, especially for women under 30.
The total fertility rate summarises age-specific fertility rates into a single numerical indicator of fertility. In 2024, the total fertility rate in New Zealand was 1.56 births per woman, the same as 2023. The rate was relatively stable from 1980 to around 2012, averaging 2.02 births per woman. After 2013, the rate steadily declined; it has remained below 1.80 since 2018. The low fertility rate is due to a combination of fewer births and an increased number of women of reproductive age (Stats NZ 2025b).
Decreasing birth rates are a global phenomenon, and this trend is particularly evident in high-income nations such as New Zealand (Nargund 2009). Therefore, in recent years (apart from in 2020–2022 during the COVID-19 pandemic), immigration has been the primary driver of population growth in New Zealand.
Migration contributes to population growth and increasing diversity
Migration impacts the population size, age structures and ethnic diversity – requiring the health system to adapt to changing needs.
In 2024, natural growth accounted for 20,619 more people (Stats NZ 2025b) and net migration contributed an additional 27,092 (Stats NZ 2025l).
Provisional estimates of migration (a person changing their country of residence) for the year to December 2024 compared with the year to December 2023 were as follows (Stats NZ 2025i):
- migrant arrivals: 155,800 (down 32%)
- migrant departures: 128,700 (up 27%). This is the highest on record for an annual period
- net migration gain: 27,092. This was down from the net migration gain of 128,300 in December 2023, but just below the long-term average net gain of 29,100 (December years 2001–2019, before the COVID-19 pandemic) (Figure 1).
Figure 1: Estimated migration by direction, rolling year ended December 2014–December 2024
Use arrow keys to navigate the key indicator items.
- Download
- Download dataset
- Source
Stats NZ (2025i)
In the year to December 2024, New Zealand’s largest net migration gains, by country of citizenship, were from India (21,517 people), followed by the Philippines (12,504 people) and China (6,381 people).
For New Zealand citizens leaving to live in other countries, estimates for the year to December 2024 were as follows:
- There was a net migration loss of New Zealand citizens of 47,100 people – the largest of any calendar year to date. This was a result of there being 72,000 departures and only 24,900 arrivals (Stats NZ 2025l).
- New Zealand citizens aged 18–30 years made up 38% of the 72,000 departures.
- New Zealand citizens migrating to Australia made up around 56% of the 72,000 departures.
People in New Zealand experience longer lives than those in most countries
Over time, life expectancy in New Zealand has increased. Life expectancy at birth for a person born in 1960–1962 was 68.4 years for males and 73.8 years for females (Stats NZ 2025k). For people born in 2022–2024, life expectancy has increased to 80.3 years for males and 83.7 years for females (Stats NZ 2025b).
While most countries in the world experienced a decrease in life expectancy due to the COVID-19 global pandemic, New Zealand was one of a handful of countries where this metric continued to increase. New Zealand’s life expectancy, taken across the total population, is higher than the world average, and higher than the average in OECD countries, a group of nations with comparable levels of socioeconomic development.
Figure 2 compares New Zealand life expectancy at birth in 2022 (82.8 years) with Australia (83.2 years), European Union countries (80.8 years), OECD member counties (79.6 years) and the world (71.9 years) (World Bank 2024).
Figure 2: Impact of COVID-19 on life expectancy at birth, comparing New Zealand with international data, 1990–2022
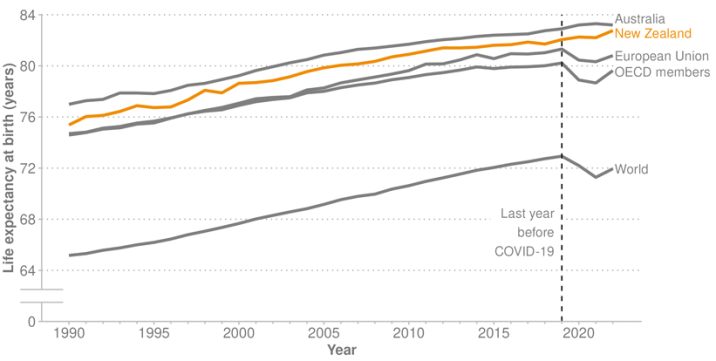
Source: World Bank (2024)
The population is ageing
Over the next 20–30 years, older adults will make up an increasingly large proportion of the population. Increasing age often comes with rising rates of disability and health need, resulting in greater reliance on health care services.
In 2024, New Zealanders aged 65 years and over (897,490 people) made up around 17% of the population. In 2034, New Zealand is expected to be a ‘super-aged’ society; projections indicate that more than 20% of the population will be aged over 65 years. By 2044, people aged 65 years and over are expected to make up 22% of the population (around 1.36 million people) (Health New Zealand 2025s).
The old-age dependency ratio refers to the number of people aged 65 years and over relative to the number of working-age people (15–64 years) in a population. The OECD indicator report (OECD 2025b) in 2022 shows that New Zealand’s old-age dependency ratio was 27.7% in that year (indicating 27.7 older people for every 100 working-age people). This is lower than the OECD average (31.3%) but is up from 20.2% in 2004 and projected to increase.
The population pyramids in Figure 3 display the changing population of New Zealand in 10-year increments, from 2004 to 2044: the black outline highlights the 2024 population shape. In 2004, the wide base and narrow top of the pyramid indicates a younger population, with fewer people in the older-age categories. By 2044, the pyramid is projected to be more top-heavy, with more people aged 65 years and over than those aged under 20 years (Health New Zealand 2025s).
Figure 3: Age distribution of the New Zealand population, by sex, comparing 2024 (black outline) with ten-year increments, 2004–2044
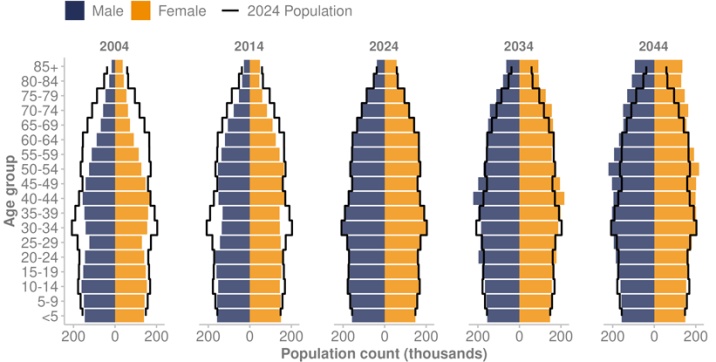
Source: Health New Zealand (2025s)
The prevalence of people with a long-term condition (such as cancer, cardiovascular disease or dementia) and/or a disability, is highest in older age groups. Consequently, due to increasing numbers of older people and declining mortality rates (people living longer), there are more people in the population needing care and support for longer. If the current funding model continues, care of those aged 65 years and over is expected to account for approximately 50% of Health New Zealand’s total expenditure by 2025/26 (Health New Zealand 2024h).
In 2022/23, aged care services in the community (aged residential care and home and community support) provided services to people with disabilities and long-term health conditions. Around 32,000 people lived in aged residential care facilities and a further 80,000 people lived at home and received services such as personal care, cooking, cleaning and respite care. These aged care services, supporting 2.1% of the population, comprise a significant part of New Zealand’s health system, receiving nearly $2 billion in funding in 2022/23 (8% of total health funding) (Health New Zealand 2024e).
In 2024, people aged 65 years and over (around 17% of the New Zealand population) accounted for 30.8% (4,250,519) of total GP consultations and 32.9% (1,606,738) of total nurse consultations in primary care (Health New Zealand unpublished data 2025).
At the same time as the general population, the health care workforce is also ageing. Of general practitioners[1] (GPs) with an annual practising certificate in June 2020, 17.0% were at or over the common retirement age of 65 years. Among this older cohort, 39.6% no longer held a practising certificate in June 2024. The proportion of GPs aged 65 years and over had increased to 21.0% by June 2024 but is forecast to decrease to 18.6% by 2030 as more younger doctors join the GP workforce (Health New Zealand unpublished data 2025).
[1] The term 'general practitioner' refers to doctors registered by the Medical Council of New Zealand with the vocational scope of general practice, indicating a doctor fully qualified in general practice at a level comparable to a hospital specialist. The forecast is based on projecting forward GP entry and exit patterns over the years 2021–2024 and makes no assumptions about additional doctors that may take up GP training in future years.
Ethnicity
The 2023 Census recorded the following information about the ethnic composition (total response ethnicity) of the New Zealand population (Stats NZ 2024a):
- European ethnicities remained the largest proportion, at 67.8% (nearly 3.4 million people).
- Māori made up 17.8% of the population (887,493 people).
- Asian peoples made up 17.3% (861,576 people).
- Pacific peoples made up 8.9% (442,632 people).
- Middle Eastern/Latin American/African (MELAA) made up 1.9% (92,760 people).
The population is becoming increasingly diverse
New Zealand’s population is becoming increasingly diverse, with a growing range of ethnicities, cultures and languages represented across the country. This demographic change is contributing to the evolving social landscape of New Zealand, and the health system must also evolve to meet the unique needs of its communities.
The proportion of New Zealanders born overseas has increased, rising from 15.8% in 1991 to 28.8% in 2023. Residents in this group originate from over 200 different countries (Stats NZ 2024c).
Increasing diversity is particularly evident among younger age groups, as follows.
- One in three children have at least one parent who did not grow up in New Zealand and who is multilingual (University of Auckland 2024b).
- One third of people at age 12 identify with more than one ethnic group (Neumann et al 2023).
- Ethnic population changes at the youngest ages indicate how New Zealand’s population will look in the future. Māori and Pacific populations in New Zealand have a younger age structure than other ethnic groups. In 2023, 29.6% of Māori and 30.7% of Pacific peoples were aged 0–14 years, compared with 20.7% of Asian and 17.9% of European populations (Stats NZ 2025a).
Rural population
Throughout New Zealand, people live in a wide range of urban centres and rural communities. The Geographic Classification for Health (GCH) classifies all areas in New Zealand as rural or urban according to their proximity to larger urban areas with respect to health (University of Otago). Data from the GCH (see Table 1) indicates that most of the New Zealand population is urban, but the size of the rural population (R1–3) is significant, comprising 19.9% of the population.
| GCH category | Description | Population (%) |
|---|---|---|
| Urban 1 | Major urban centres | 61.2 |
| Urban 2 | Provincial cities | 18.9 |
| Rural 1 | Least remote rural communities | 12.8 |
| Rural 2 | Moderately remote rural communities | 6.1 |
| Rural 3 | Most remote rural communities | 1.0 |
Note: Population proportions were calculated from the 2023 Census and the 2018 GCH (the most recent available), resulting in a mismatch between years and the Statistical Area 2 versions. Applying the 2018 GCH to 2023 Census excludes around 5.7% of the population from assignment to a GCH category.
Source: University of Otago (nd), Stats NZ (2025a)
The 2023 Census found that around one-quarter of people aged over 65 years lived in rural communities. Between 2013 and 2023, the proportion of those aged over 65 years grew from 17.9% to 21.5% of the rural population. This increase was higher than the equivalent change in urban areas.
The rural population comprised 80.8% European, 23.6% Māori, 5.0% Asian and 3.8% Pacific peoples. In 2023, 26.1% of the Māori population lived rurally, compared to 23.5% among European, 8.8% among Pacific peoples and 6.0% for Asian.
Rural communities have poorer overall health outcomes than those living in urban centres. Over 2018–2020, rural amenable mortality rates were 20% higher than they were for urban populations. Amenable mortality is defined as deaths under age 75 years that could potentially have been avoided, given effective and timely health care (Ministry of Health 2023c).
Disabled population
This section of the report provides information about the disabled population in New Zealand, using a variety of data sources; these are described more fully in the ‘Technical notes’ section at the end of this report.[2]
Key data sources for this section include:
- the 2023 New Zealand Household Disability Survey, which uses screening questions to identify people with a disability based on question sets developed by the Washington Group on Disability Statistics (Stats NZ 2025e)
- the Health Survey uses a slightly different definition of disability, which results in a considerably smaller proportion of the adult population being identified as disabled compared with the population identified by disability-specific surveys (Ministry of Health 2024h).
Significant gaps remain in data and information about disabled people, limiting the extent to which we can identify conditions/impairments and fully measure and report on health needs, care experiences, and outcomes.
The 2023 Household Disability Survey identified 17% of New Zealanders as disabled. This equates to 851,000 people (Stats NZ 2025d). Of these, 98,000 were children (aged 0–14 years) and 753,000 were adults (aged 15 years and over).
The proportion of people identified as disabled differed by population group, as follows.
- Females were more likely to be disabled than males, at 18% and 15% respectively (89,000 more disabled females than males). Females were more likely to be disabled at all stages of life, except for childhood (Stats NZ 2025d).
- The proportion of people identified as disabled was 10% for children and 18% for adults. The prevalence of disability steadily increased by age, to be 35% for adults aged 65 years and over.
- People in the LGBTIQ+ population were more likely to be disabled (29%) than those in the non-LGBTIQ+ population (17%). Adjusting for age, the LGBTIQ+ rate was 31%.
- By ethnic group (total response), the proportion of people identified as disabled (not age-adjusted) was 21% for Māori, 16% for Pacific peoples, 9% for Asian peoples and 18% for European.
- For Māori children, the prevalence of disability was 14%; higher than the national rate (10%). For Māori adults, the prevalence was 24%, higher than the national rate (18%).
Figure 4: Disability prevalence by ethnic group (total response) and age group, 2023
Use arrow keys to navigate the key indicator items.
- Download
- Download dataset
- Source
Household Disability Survey 2023: Stats NZ (2025e)
[2] Differences in definitions, collection criteria and thresholds across data sources can result in varying numbers and prevalence figures, depending on the source.
For many measures, disabled people fare worse than non-disabled people
Results throughout this report show that disabled adults and children are more likely than non-disabled adults and children to have poorer health outcomes and be disadvantaged in terms of the determinants of health, such as poverty, inadequate housing and access to health care.
For adults, the 2023/24 Health Survey found as follows.
- Only 60.0% of disabled adults rated their health as good (defined as good, very good or excellent health), compared with 87.8% of non-disabled adults.
- Disabled adults were more likely to experience barriers to accessing primary care: 32.1% of disabled adults reported an unmet need for a GP due to wait time for an appointment, compared with 25.0% of non-disabled adults.
- Of disabled adults, 22.3% reported cost as a barrier to seeing a GP, compared with 14.9% of non-disabled adults.
The 2023 Household Disability Survey reported higher levels of income inadequacy for disabled adults: over half of disabled adults (53%) did not have enough or had only just enough income to meet basic needs (such as food, clothing and housing), compared with 33% of non-disabled adults (Stats NZ 2025d).
The Household Disability Survey also reported that disabled people were more likely to live in lower quality housing; that is, they were more likely to:
- live in colder homes (29% of disabled people compared with 19% of non-disabled)
- live with damp (25% of disabled people compared with 20% of non-disabled people)
- live in a home needing major repairs (24% of disabled people compared to 14% of non-disabled people).
For children, the 2023/24 Health Survey found as follows.
- Among parents or primary caregivers of disabled children, 88.3% reported their child to be in good health (defined as good, very good or excellent health), compared with 97.8% of parents or primary caregivers of non-disabled children.
- Disabled children (aged 5–14 years) were much more likely to live in households where food ran out sometimes or often in the past year: 41.0%, compared with 25.0% for non-disabled children.
- The rate of unmet need for professional help with mental health for disabled children (aged 2–14 years) was 33.2%, compared with just 3.8% for non-disabled children.
Intellectual disability is more prevalent in specific groups, and has meaningful health impacts
The term ‘intellectual disability’ describes a difficulty understanding, concentrating, learning and remembering new things in a person’s everyday life (IHC 2025). The Intellectual Disability (Compulsory Care and Rehabilitation) Act 2003 defines ‘intellectual disability’ as a permanent impairment that:
- results in an IQ of 70 or less
- results in significant deficits in adaptive functioning in areas such as communication, self-care, home living and social skills
- becomes apparent before a person reaches the age of 18.
The report From Data to Dignity: Health and Wellbeing Indicators for New Zealanders with Intellectual Disability (IHC 2023) provides the following insights about New Zealanders living with intellectual disability.
- The prevalence of intellectual disability in 2018 was identified as 1.0% of the population. This was similar to the estimated prevalence in 2008 (1.1%).
- More than one in five people (21.4%) with intellectual disability live in the most deprived neighbourhoods (decile 10), compared to 11.2% of people without intellectual disability.
- Rates of intellectually disability were higher in males (1.0%) than females (0.6%).
- Māori have the highest rates of intellectual disability (1.3%), followed by Pacific peoples (0.9%) and European (0.8%). The Asian and MELAA ethnic groups have the lowest rates of intellectual disability, at 0.3% and 0.4% respectively.
- Life expectancy is much lower for those with an intellectual disability. Life expectancy for females with intellectual disability is 65.7 years, compared to 83.7 years for females without intellectual disability. Life expectancy for males with intellectual disability is 65.3 years, compared to 80.3 years for males without intellectual disability.
- People with intellectual disabilities experience higher rates of coronary heart disease, chronic obstructive pulmonary disease, diabetes, dementia and mood disorders.
Health status Te tūnga hauora
This section explores key aspects of health status, such as self-rated health, life expectancy, mortality, and perinatal and maternal mortality. It also examines the prevalence and impact of non-communicable diseases and communicable (infectious) diseases. These measures provide valuable insights into the health and wellbeing of New Zealanders.
Population health measures
Population health measures provide a comprehensive overview of the health and wellbeing of New Zealand’s population, offering key insights into overall health status, disease burden and mortality trends.
This section examines a range of indicators, including self-rated health and parent-rated child health, which reflect subjective wellbeing and self-perceived health status. It also examines objective measures such as life expectancy, health expectancy and mortality rates, including perinatal and maternal mortality. Additionally, it discusses the prevalence and impact of non-communicable diseases, communicable (infectious) diseases and multimorbidity, highlighting their influence on health outcomes.
Self-rated health
Self-rated health is a measure of an individual’s perception of their own health. The Health Survey asks individuals to rate their health on a scale from excellent to poor. For 2023/24, most adults (15+ years: 85.4%) reported being in good health (defined as good, very good or excellent). This is similar to the previous year, 2022/23 (86.2%), but down from a high of 91.4% a decade ago.
Most adults rate their health as good, but gaps exist
For the year 2023/24, disabled adults were less likely (60.0%) to report being in good health, than non-disabled adults (87.8%). Disabled adults’ self-rated good health was up from last year (57.4%), but down from a high of 62.0% in 2021/22.
Adults living in the most socioeconomically deprived neighbourhoods were less likely (79.4%) to report being in good health than those living in the least deprived neighbourhoods (88.9%). Figure 5 shows self-reported good health by deprivation quintile between 2011/12 and 2023/24. Rates of self-reported good health dropped over this time for adults in all deprivation quintiles.
Figure 5: Percentage of adults aged 15+ years with good or better self-rated health, by deprivation quintile, 2011/12–2023/24
Use arrow keys to navigate the key indicator items.
- Download
- Download dataset
- Source
Health Survey (Ministry of Health 2024b)
Rates of self-rated good health differed by ethnic group (Figure 6). In 2023/24:
- 77.1% of Māori adults reported being in good health, down from 83.8% in 2011/12
- 81.9% of Pacific adults reported being in good health, down from 87.2% in 2011/12
- Asian adults had the highest level of self-rated good health (88.8%, similar to 2011/12: 89.1%), followed by European/Other adults (86.0%, down from 90.0% in 2011/12).
Figure 6: Percentage of adults aged 15+ years with good or better self-rated health, by ethnic group (total response), 2011/12–2023/24
Use arrow keys to navigate the key indicator items.
- Download
- Download dataset
- Source
Health Survey (Ministry of Health 2024b)
Most parents rate their child’s health as good, despite a small decrease over the decade
For the year 2023/24, according to parents or caregivers responding to questions about child health (parent-rated child health) in the Health Survey, most children (96.5%) were in good health, defined as good, very good or excellent. This represents a small decrease from the rate of 97.8% in 2011/12.
Rates of good health (according to parent-rated child health) were similar across ethnic groups: 95.7% of Māori children, 97.4% of Pacific children, 96.9% of Asian children and 96.5% of European/Other children were in good health, as rated by their parents.
In the year 2023/24, parents or primary caregivers of disabled children were less likely to report their child to be in good health (88.3%) compared with parents or caregivers of non-disabled children (97.8%).
Life expectancy
Life expectancy differs by population group
In New Zealand there are large life expectancy gaps between different population groups. Life expectancy by deprivation decile shows a stark gradient. Individuals living in the most socioeconomically deprived neighbourhoods experience significantly shorter lives compared to those in the least deprived neighbourhoods: a gap of around a decade.
Figure 7 shows how life expectancy steadily increases as deprivation decreases, highlighting a consistent link between socioeconomic disadvantage and health outcomes. Note that 2017–2019 data is the most recent available data that includes ethnic group, deprivation area and gender.
By ethnic group, Māori males have the lowest life expectancy, at 73.4 years, followed by Pacific males, at 75.4 years. Māori females and Pacific females also have lower life expectancy than average, at 77.1 and 79.0 years respectively. In New Zealand, Asian females have the highest life expectancy, at 87.9 years, followed by Asian males, at 85.1 years. For European/Other, life expectancy is 84.5 years for females and 81.0 years for males.
Figure 7: Life expectancy at birth, by deprivation decile and gender, 2017–2019
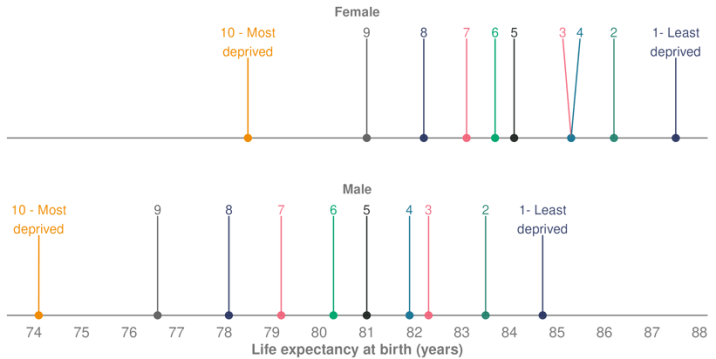
Source: Stats NZ (2021)
Despite life expectancy increases, people live more years in poor health
Healthy life expectancy is a population health indicator from the Global Burden of Disease (GBD) study that estimates the average number of years a person can expect to live in good health, adjusted from total life expectancy by considering the impacts of morbidity. New Zealanders are living longer and spending more time in good health; however, life expectancy has increased faster than healthy life expectancy, which means they also spend more years in poor health.
Figure 8 shows changes in life expectancy and healthy life expectancy between people born in 2000, 2010 and 2021, according to the Global Burden of Disease study. In 2000, healthy life expectancy was 66.2 years for males and 68.1 years for females. By 2021, this had risen to 69.9 years for males and 70.4 years for females: an increase of 3.7 years for males and 2.3 years for females. At the same time, life expectancy increased by 4.8 years for males and 3.3 years for females (GBD 2021).
Figure 8: Life expectancy, healthy life expectancy and years in poor health, at birth, by sex, 2000, 2010, 2021
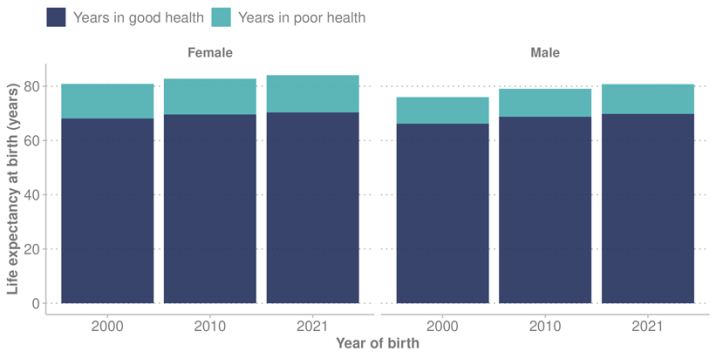
Source: Institute for Health Metrics and Evaluation (2024)
Mortality
Data for this section is sourced from Health New Zealand’s Mortality Data Web Tool (Health New Zealand 2025l). In the web tool, data for 2022 is preliminary, because Health New Zealand is yet to receive cause-of-death information for some deaths from the coroner.
In 2022 (the most recent data available), there were 38,736 deaths registered in New Zealand, and the overall age-standardised mortality rate was 380.9 deaths per 100,000 population (Health New Zealand 2025l). While the total number of deaths has increased with the growing population, the mortality rate has decreased over time. About 50 years ago (in 1972), the mortality rate was 847.1 deaths per 100,000 population.
In 2022, for the total population, preliminary data shows the leading causes of death were cancers, ischaemic heart disease[3] and cerebrovascular disease[4] (108.0, 42.2 and 19.7 deaths per 100,000 population respectively).
In 2022, the overall mortality rates for Māori (610.8 per 100,000 population) and Pacific peoples (606.0 per 100,000 population) were higher compared with those for other ethnic groups. Asian peoples had the lowest rates (215.2 per 100,000), followed by European/Other (360.2 per 100,000 population).
[3] Ischaemic heart disease (also known as coronary artery disease) is the most common form of cardiovascular disease.
[4] Cerebrovascular diseases are conditions that affect blood flow and blood vessels in the brain.
Perinatal and maternal mortality
Birth outcomes are a key indicator of maternal and infant health, reflecting the quality of health care systems and broader social determinants of health. This section examines perinatal and maternal mortality rates.
OECD data (OECD 2024) shows New Zealand’s infant mortality rate was 4.6 deaths per 1,000 live births in 2019, having reduced from 6.3 in 2000. Since then, rates have remained stable. The New Zealand rate is higher than the rate in many OECD countries, such as Canada (4.4), the United Kingdom (4.0) and Australia (3.3), but lower than the rate in the United States (5.6 deaths per 1,000 live births in 2019).
Perinatal mortality has not reduced over time
Key findings from the latest Perinatal and Maternal Mortality Review Committee (PMMRC) report, released July 2024 (HQSC 2024d) include the following.
- There has been no statistical change in perinatal mortality[5] rates in New Zealand over the last 15 years, from 2007 to 2021.
- Significant inequities, related to a number of factors, including ethnicity, have always occurred in perinatal mortality. These inequities remain unchanged for Māori, Pacific and Indian populations.
- Some combinations of ethnicity and other factors (such as socioeconomic deprivation) have more than twice the risk of perinatal mortality compared to the population with the lowest risk.
The PMMRC reports that in 2021 (latest data available) there were 707 perinatal-related deaths, made up of 205 late terminations, 311 stillbirths and 191 neonatal deaths. This was an overall annual perinatal-related mortality rate of 11.2 mortalities per 1,000 births.
These numbers show some inequities, as follows.
- By deprivation quintile: Those living in areas of highest socioeconomic deprivation (quintile 5) had higher mortality rates (12.9 mortalities per 1,000 births) than those living in the least socioeconomically deprived neighbourhoods (8.9 mortalities per 1,000 births).
- By maternal age group: The highest perinatal mortality rates were for those aged under 20 years (16.6 mortalities per 1,000 births) and those aged 40 years and over (14.5 mortalities per 1,000 births). This compares with 9.2 mortalities per 1,000 births for people aged 25–29 years and 9.3 mortalities per 1,000 for those aged 30–34 years.
- By ethnic group (maternal prioritised ethnicity), mortality rates were:
- Indian peoples – 14.4 mortalities per 1,000 births
- Pacific peoples – 12.6 mortalities per 1,000 births
- Māori – 10.7 mortalities per 1,000 births
- other Asian peoples – 8.6 mortalities per 1,000 births
- New Zealand European – 10.6 mortalities per 1,000 births
- other European – 6.2 mortalities per 1,000 births.
[5] Perinatal mortality is fetal and early neonatal death from 20 weeks’ gestation (or weighing at least 400g, if gestation is unknown) until midnight of the sixth day of life.
Suicide is the largest contributor to maternal mortality
A maternal death is the death of a person while pregnant or within 42 days of the end of the pregnancy (miscarriage, termination or birth), irrespective of the duration and site of the pregnancy, from any cause related to or aggravated by the pregnancy or its management.
Cause of maternal death is sub-classified into four categories: direct, indirect, unknown/undetermined and coincidental (HQSC 2024d). In 2018, the PMMRC adopted the WHO revision to include deaths by suicide with direct maternal deaths.
Maternal mortality is a rare event. The PMMRC reported only 147 such deaths in New Zealand between 2006 and 2021 and found as follows.
- Suicide was the leading cause of maternal death, accounting for over 40% of direct maternal mortality events (n=80). This means that, over the 16 years when these 80 deaths occurred, approximately two deaths per year were by suicide. Wāhine Māori had three times the suicide rate of New Zealand Europeans.
- Māori and Pacific peoples have over twice the rate of maternal mortality of the group with the lowest rate (European). If the Māori and Pacific mortality rates were the same as the European rates, overall maternal mortality in New Zealand would be 30% lower (HQSC 2024d).
Non-communicable diseases
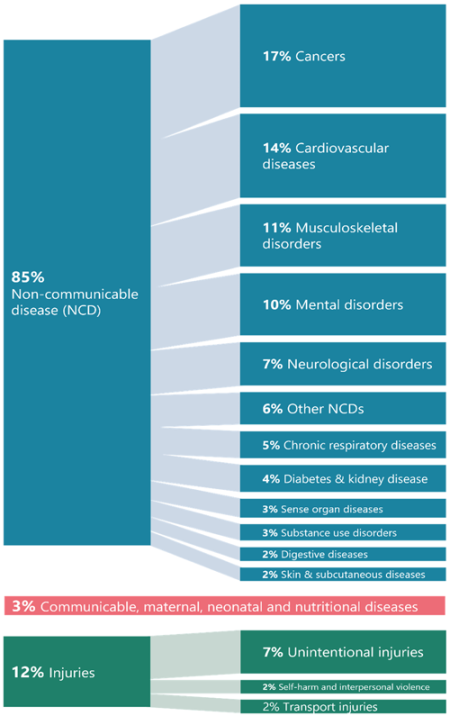
Non-communicable diseases are the leading cause of health loss in New Zealand, contributing most to nationwide death and disability. The 2021 GBD study (Institute for Health Metrics and Evaluation 2021) indicates that 85% of all health loss (death and disability combined) in New Zealand is attributable to non-communicable diseases (Figure 9).
Unlike communicable (infectious) diseases, non-communicable diseases are not transmitted from person to person but are largely influenced by wider determinants, environmental conditions and risk factors. Non-communicable diseases disproportionally affect Māori and Pacific peoples, further compounding health inequities.
The Government Policy Statement on Health 2024–2027 (Ministry of Health 2024c) sets out the ‘5+5’ concept, which focuses on addressing five key risk factors (alcohol, tobacco, poor nutrition, physical inactivity and adverse social and environmental factors) to reduce five non-communicable diseases: cancer, cardiovascular disease, respiratory disease, diabetes and poor mental health. Together, these conditions account for around 80% of deaths from non-communicable diseases in New Zealand and a considerable amount of the health loss New Zealanders experience. This section provides an overview of prevalence, impact and trends in relation to these five major non-communicable diseases.
Figure 9: Proportion of disability-adjusted life years lost by high-level cause (GBD levels 1 and 2), 2021
Source: Institute for Health Metrics and Evaluation (2024)
Cancers
Cancers are the leading cause of death and health loss in New Zealand, and have significant impact on individuals, families and health care systems. Advances in early detection and treatment have improved survival rates, but disparities in cancer rates and outcomes remain a challenge. Determinants of health and environmental factors play a big role in shaping health outcomes generally and cancer outcomes specifically.
Cancer incidence has remained stable over time, but age and ethnicity play a role
In 2022, there were 28,275 new cancer registrations in New Zealand (Health New Zealand 2024f). This equates to around 77 people being diagnosed with cancer every day. The most common cancer types for males were prostate (4,334), colorectal (1,849), melanoma (1,668) and lung (1,170). The most common cancer types for females were breast (3,660), colorectal (1,696), melanoma (1,427) and lung (1,347).
In 2022, the overall age-standardised rate of cancer registrations was 338.6 registrations per 100,000 population. This rate of new cancers has been stable over the last 10 years. The number of new cancer registrations has increased, due to the growing and ageing population. In 2013, there were 22,505 new cancer registrations (compared with 28,275 in 2022).
Generally, the incidence of cancer rises with age. Most new cancer registrations are for people aged 60 years and over; in 2022, 73.6% of cancers (20,812 of the 28,275 cancers) occurred in this older age range. Figure 10 displays the rate of new cancer registrations by age group.
Figure 10: Rate of new cancer registrations per 100,000 people, by age group, 2022
Use arrow keys to navigate the key indicator items.
- Download
- Download dataset
- Source
Health New Zealand (2024f)
Source: Health New Zealand (2024f)
The burden of cancer is not carried evenly across the population. Figure 11 shows age-standardised new cancer registrations by ethnic group. In 2022, the rate of cancer for Māori and Pacific peoples was 409.3 and 396.1 respectively. The rate for European/Other was 347.6. Asian peoples had lower age-standardised rates of cancer, at 205.8 new cancer registrations per 100,000 people.
Figure 11: Age-standardised rate of new cancer registrations per 100,000 people, by ethnic group (prioritised ethnicity), 2013–2022
Use arrow keys to navigate the key indicator items.
- Download
- Download dataset
- Source
Health New Zealand (2024f)
While overall cancer mortality has decreased, it remains higher for Māori and Pacific peoples
In 2022, 10,536 people died from cancer in New Zealand; this represents an average of 29 cancer deaths every day (Health New Zealand 2024f).[6] The age-standardised rate of cancer deaths in 2022 was 108.0 deaths per 100,000 New Zealand population. The rate of deaths from cancer has been slowly declining over the past 10 years, as survivability improves. In 2013, the rate of cancer deaths was 122.9 deaths per 100,000 people. The number of deaths has slowly increased with the growing population (Health New Zealand 2024f).
In 2022, age-standardised death rates from cancers were higher for Māori (169.6 deaths per 100,000 Māori) and Pacific peoples (151.8 deaths per 100,000 Pacific peoples). These higher rates have been constant over time, in contrast to the declining rate of cancer deaths across the total New Zealand population. In 2022, the rate of death from cancers for European/Other was 105.1 deaths per 100,000. In terms of ethnicity, the lowest rate of death was for Asian peoples, at 57.2 deaths per 100,000.
[6]Mortality data is sourced from Health New Zealand’s Cancer Web Tool. Data for 2022 is preliminary, awaiting cause-of-death information for some deaths.
Over time, cancer survival has improved for some cancers more than others
Survival rates for most cancers have improved. Figure 12 shows the change in net five-year cancer survival for the nine most diagnosed cancers (that is, the cancers with the highest registration/incidence rate). Survival rates are shown using two years of combined data, for 1998–99 and 2020–21.
In 2020–21, 67.6% of all cancer patients survived at least five years after diagnosis, up from 58.0% in 1998-99. Cancer survival improved markedly for people with non-Hodgkin’s lymphoma, rising from 47.9% net five-year survival in 1998–99, to 68.4% in 2020–21. Survival also improved considerably for people with leukaemia, rising from 37.6% net five-year survival in 1998–99, to 57.7% in 2020–21 (Te Aho o Te Kahu – Cancer Control Agency unpublished data).
Figure 12: Net five-year survival for the nine most diagnosed cancers, 1998–99 and 2020–21
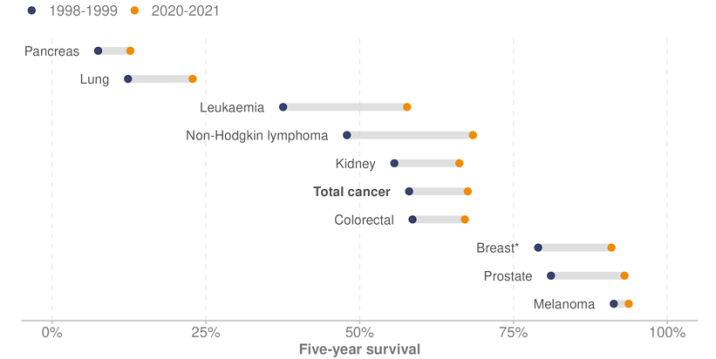
* Female breast cancer only
Download dataset (CSV, 480 B)
Note: Net survival (Pohar-Perme) using period method and ethnic specific life tables.
Source: Health New Zealand unpublished data (2025)
A large proportion of cancers are preventable
The cancer prevention report (Te Aho o Te Kahu – Cancer Control Agency 2022) states that approximately 30–50% of cancers are preventable by reducing or removing everyone’s exposure to the cancer risk factors present in people’s lives and environments: tobacco, alcohol, poor nutrition, physical inactivity, excess body weight, excessive exposure to ultraviolet radiation and chronic infections. The report also highlights that inequity exists at every step of the cancer continuum, from exposure to risk factors, how likely a person is to develop cancer, how quickly they are diagnosed, how accessible and appropriate their treatment is, and how they are supported through the cancer journey.
The number of cancers diagnosed in New Zealand is projected to increase from 25,700 per year in 2015–2019 to 45,100 a year by 2040–2044. This is a 76% increase, alongside a projected population growth of 22% (Teng A et al 2024). This reinforces the need for both cancer prevention and treatment service planning.
Early detection and diagnosis are key
A key goal of the New Zealand Cancer Action Plan 2019–2029 (Ministry of Health 2020) is to improve cancer survival rates across New Zealand. Achieving this goal requires diagnosis and treatment that takes place as early as possible. However, compared to other countries, there are high rates in New Zealand of first cancer diagnoses that occur after an emergency or acute (unplanned) hospital admission, which is likely to be after the cancer has been progressing for some time (Te Aho o Te Kahu – Cancer Control Agency 2024).
Te Aho o Te Kahu – Cancer Control Agency’s 2024 report Route to diagnosis shows that, in New Zealand, the age-standardised proportion of cancer diagnosed after an emergency or unplanned admission[8] between 1 January 2017 and 31 December 2021 was 20.7% across all cancers, with variation between cancer types. For example, 69.5% of pancreatic cancer and 51.3% of lung cancer were diagnosed after an emergency or unplanned admission, compared with 4.4% of breast cancer.
People diagnosed this way frequently present with severe symptoms indicating an advanced stage of disease. This often results in poorer survival and/or poorer health outcomes compared with those diagnosed though pathways enabling earlier detection, such as primary care and community-based diagnostic services.
[8] The definition of a ‘cancer diagnosis following emergency or acute (unplanned) hospital admission’ is a cancer diagnosis that occurs within 30 days of an emergency or acute admission (unplanned admission) to hospital, regardless of whether the reason for the visit is related to the cancer that is subsequently diagnosed.
For most people, cancer treatment is fast and of high quality, but inequalities persist
Across New Zealand, cancer services deliver high-quality care for most people, most of the time. However, there are inequities at every stage of the cancer continuum, including a person’s exposure to cancer-causing risk factors, speed of diagnosis, ability to access high-quality cancer treatment, timely referral to specialist care and level of palliative care available. These inequities contribute to poorer health outcomes.
The New Zealand health target for cancer treatment is that, by 2030, 90% of patients receive cancer management within 31 days of the decision to treat (Ministry of Health 2024e). This target is intended to drive rapid access to health services for patients with cancer and the delivery of better coordinated, faster, quality care.
For the quarter ended December 2024, 85.9% of patients received cancer management within 31 days of the decision to treat. This was similar to the same time the previous year (85.7%), but down from 87.7% in 2019/20 (Health New Zealand 2025h).
Cancer screening
Cancer screening looks for signs of cancer (or its precursors) in people who do not have symptoms. It aims to improve early diagnosis of cancer, which increases options for early intervention and treatment and improves cancer survivability (Health New Zealand 2025c). New Zealand has population-based screening programmes for breast cancer, cervical cancer and bowel (colorectal) cancer.
Breast screening rates are improving after a decline during the COVID-19 pandemic
Breast cancer is the most common cancer affecting women in New Zealand. In 2022, 3,660 women were diagnosed with breast cancer: more than 10 women on average every day. The number of breast cancer diagnoses has increased over time because of the growing and ageing population: in 2017, 3,304 women were diagnosed with breast cancer. However, the age-standardised rate of breast cancer (per 100,000 women) has been similar (94.4 in 2017 and 96.5 in 2022) (Health New Zealand 2024f).
Breast screening is offered every two years to eligible women aged 45–69 years.[9] Screening aims to save lives by finding breast cancer early, before it spreads. The breast screening coverage target is for at least 70% of eligible women in New Zealand to be screened every two years. In December 2024, the overall two-year breast screening coverage rate was 69.8%, up from 67.9% in December 2023 (Health New Zealand 2025b).
Figure 13 shows breast screening coverage by ethnic group from 2010 to 2024, alongside the target rate. Breast coverage rates are lowest among Asian peoples (61.8%) and Māori (63.1%), followed by Pacific peoples (69.0%) and European/Other (72.9%). COVID-19 restrictions had a significant impact on the breast screening programme, reducing coverage rates in 2020 and 2021. Since then, rates show an improving trend.
Figure 13: Breast screening coverage, eligible women aged 45–69 years, by ethnic group (prioritised ethnicity), 2010–2024
Use arrow keys to navigate the key indicator items.
- Download
- Download dataset
- Source
Health New Zealand (2025b)
[9] In October 2024, the age for free breast screening was extended in Nelson and Marlborough to women aged 70–74. The extension for the rest of New Zealand will launch in October 2025; it will be phased in year on year up to the age of 74.
Cervical screening rates show progress but remain uneven
Cervical cancer is one of the most preventable cancers. Prevention measures include vaccination for the human papillomavirus (HPV), cervical screening and prompt, quality treatment (WHO 2024a). With HPV immunisation and cervical screening, New Zealand aims to eliminate cervical cancer (Health New Zealand 2025c).
In 2022, 164 people were diagnosed with cervical cancer, compared with 171 in 2017. The age-standardised rate (per 100,000 people) also reduced over this time, from 3.2 in 2017 to 2.8 in 2022 (Health New Zealand 2024f).
The National Cervical Screening Programme is offered to women aged 25–69 years. In September 2023, New Zealand changed from cytology-based screening to HPV primary screening. HPV screening looks for high-risk subtypes of HPV, which, if persistent, can cause cell changes that may lead to cancer. The sample is collected as a swab (either as a self-test or with assistance from a health care provider), or as a cervical sample taken by a healthcare provider.
The coverage target for cervical screening is for at least 80% of the eligible population to have had a cervical screen or a follow-up test within specified timeframes. For the cytology-based programme, the timeframe was every three years; for HPV screening, it is every five years.
Figure 14 shows cervical screening coverage at December 2024 alongside the target rate. Of the total eligible population, 72.7% of people are up to date. By ethnic group, rates were 64.6% for Māori, 71.2% for Pacific peoples, 63.1% for Asian peoples and 78.5% for European/Other. Coverage was declining for most ethnic groups before COVID-19, then fell more sharply during the pandemic. From 2022, coverage has shown an improving trend.
Figure 14: Cervical screening coverage, women aged 25–69 years, by ethnic group (prioritised ethnicity), 2010–2024
Use arrow keys to navigate the key indicator items.
- Download
- Download dataset
- Source
Health New Zealand (2025n)
Bowel screening shows a downward trend, with a small improvement over the past year
The National Bowel Screening Programme is free for people aged 60–74 years. It is offered every two years to eligible people to help detect bowel cancer. It aims to save lives by finding cancer at an early stage, when it can often be successfully treated (Health New Zealand 2025c).
In 2022, 3,545 people were diagnosed with bowel cancer, up from 3,032 in 2017. The age-standardised rate of bowel cancer (per 100,000 people) has been similar over this time: 39.2 in 2017 and 40.3 in 2022 (Health New Zealand 2024f).
The coverage target for bowel screening is for at least 60% of the eligible population to have had bowel screening within the previous two years.
Figure 15 shows coverage at October 2024, alongside the target rate. There was an overall decline in participation after October 2020; however, a small improvement was evident for most population groups in the year ended October 2024. At this time, for the total eligible population, participation was 57.6%, up from 57.5% the year prior (in October 2023). By ethnic group, participation rates in October 2024 were 50.8% for Māori, 38.9% for Pacific peoples, 44.0% for Asian peoples and 62.1% for European/Other.
Figure 15: Bowel screening coverage, people aged 60–74 years, by ethnic group (prioritised ethnicity), 2020–2024
Use arrow keys to navigate the key indicator items.
- Download
- Download dataset
- Source
Health New Zealand (2025m)
Cardiovascular and cerebrovascular disease
Cardiovascular and cerebrovascular diseases are a group of disorders of the heart and brain that affect blood flow and blood vessels. Ischaemic heart disease (also known as coronary artery disease) is the most common form of cardiovascular disease. It occurs when the coronary arteries become narrowed or blocked due to a build-up of plaque (atherosclerosis), reducing oxygen supply to the heart. In 2022, ischaemic heart disease accounted for 4,602 deaths in New Zealand, an age-standardised rate of 42.2 deaths per 100,000 people (Health New Zealand 2025l).
The rate of death from ischaemic heart disease differs by ethnic group and gender. In 2022, after adjusting for age, the rate of death per 100,000 population from ischaemic heart disease was highest for Māori (68.7) and Pacific peoples (66.4), compared to 39.5 for European/Other, and 24.0 for Asian peoples. Males have higher mortality from ischaemic heart disease than females (60.7 compared with 25.8 per 100,000, age-standardised).
Hospitalisation rates for cardiovascular disease as the primary cause of admission (Figure 16) are also higher in males than females. Māori and Pacific peoples have disproportionately higher and increasing age-standardised rates of hospitalisation for cardiovascular disease, compared with Asian peoples and European/Other.
Figure 16: Age-standardised rate of hospitalisations for cardiovascular disease per 1,000 people, by gender and ethnic group (prioritised ethnicity), 2015–2024
For females
Use arrow keys to navigate the key indicator items.
- Download
- Download dataset
- Source
Health New Zealand unpublished data (2025)
For males
Use arrow keys to navigate the key indicator items.
- Download
- Download dataset
- Source
Health New Zealand unpublished data (2025)
In New Zealand, stroke and other cerebrovascular diseases (conditions that affect blood flow and blood vessels in the brain) accounted for 2,275 deaths in 2022, an age-standardised rate of 19.7 deaths per 100,000 population. Females had higher mortality from cerebrovascular diseases than males (20.1 compared with 19.0 per 100,000, age-standardised) (Health New Zealand 2025l).
Stroke Aotearoa New Zealand describes strokes as the leading cause of adult disability in New Zealand. More than 9,000 strokes occur each year. One in four people over the age of 25 will experience a stroke in their lifetime (Stroke Aotearoa New Zealand 2025).
If current rates of stroke remain unchanged and population projections hold, the number of hospitalisations for stroke is expected to rise to approximately 38,000 per year by 2043, up from 23,446 in 2023 (an increase of 62.3%) (Ministry of Health unpublished data 2025).
Diabetes and chronic kidney disease
Type 2 diabetes is the most common type of diabetes (90% or more of cases). It occurs when the body does not produce enough insulin, and/or the cells in the body do not recognise the insulin that is present. Type 2 diabetes can be reduced through protective factors such as healthy eating, being physically active and maintaining a healthy weight (Health New Zealand 2024q).
The Virtual Diabetes Register[10] shows that 323,716 people were living with diabetes in New Zealand in 2023. Over the last 10 years, there has been an increase in the estimated age-standardised prevalence of diabetes, from 37.3 per 1,000 population in 2014 to 44.3 per 1,000 in 2023.
Those living in the most socioeconomically deprived neighbourhoods (deprivation quintile 5) had an age-standardised prevalence of diabetes 2.7 times higher than those living in the least socioeconomically deprived neighbourhoods (deprivation quintile 1).
In 2023, Pacific peoples had the highest estimated age-standardised prevalence of diabetes (125.5 per 1,000 population), followed by Indian peoples[11] (103.4 per 1,000 population), Māori (71.6 per 1,000 population) and European/Other (32.0 per 1,000 population).
If current rates of diabetes remain unchanged and population projections hold, the number of people with diabetes is expected to rise to over half a million people by 2043 (an increase of more than 200,000 people or approximately 60.8% compared to 2023).[12]
For all ethnic groups, the prevalence of diabetes increases with age, peaking between 70 and 84 years before declining (Figure 17).
Figure 17: Rates of diabetes per 1,000 people, by ethnic group (prioritised ethnicity) and age group, 2023
Use arrow keys to navigate the key indicator items.
- Download
- Download dataset
- Source
Health New Zealand (2025t)
Chronic kidney disease is an umbrella term used to describe any long-term condition that adversely affects kidney structure and function. It can lead to kidney failure, which is fatal if not treated by either dialysis or a kidney transplant. The main causes of chronic kidney disease are diabetes (approximately one in three people with diabetes will end up with some kidney damage) and high blood pressure. Other risk factors include unhealthy weight, family history of kidney disease and tobacco use (Health New Zealand 2024g).
[10] The Virtual Diabetes Register includes Type 1 and Type 2 diabetes and excludes gestational diabetes.
[11] The distribution of diabetes varies considerably within Asian peoples; prevalence is highest in the Indian population. For this reason, data is presented separately for the Indian subgroup. Other Asian peoples are combined within the European/Other group.
[12] This projection is based on a broader Virtual Diabetes Register definition for its 2023 baseline (347,500 people). It has been expanded to include individuals not enrolled with a primary health organisation and those who were alive at any time during the calendar year (Health New Zealand 2023).
Mental health
Mental health is a vital component of overall wellbeing and a significant contributor to the health of individuals, whānau and communities. The WHO defines mental health as a state of mental wellbeing that enables people to cope with the stresses of life, realise their abilities, learn well and work well, and contribute to their community (WHO 2022b).
In New Zealand, mental health conditions are a common factor affecting population health. According to the GBD study, in 2021 mental health disorders accounted for 10% of total health loss nationwide (Institute for Health Metrics and Evaluation 2024).
In July 2024, the Government introduced five mental health and addiction targets (Health New Zealand 2025k), as Table 2 shows.
| Target | Description | Result Q2 2024/25 |
|---|---|---|
| Faster access to specialist mental health and addiction services | 80% of people accessing specialist mental health and addiction services are seen within three weeks | 81.9% |
| Faster access to primary mental health and addiction services | 80% of people accessing primary mental health and addiction services through the Access and Choice programme are seen within one week | 83.9% |
| Shorter mental health and addiction-related stays in emergency departments (EDs) | 95% of mental health and addiction-related ED presentations are admitted, discharged or transferred from ED within six hours | 65.0% |
| Increased mental health and addiction workforce development | 500 mental health and addiction professionals are trained each year | 457 |
| Strengthened focus on prevention and early intervention | 25% of mental health and addiction investment is allocated towards prevention and early intervention | 24.4% |
Source: Health New Zealand (2025k)
This section of the report presents indicators relating to mental health in New Zealand, including rates of psychological distress, rates of unmet need for mental health and addiction services, and suicide rates. In addition, mental health and addiction-related ED information is included in the ‘Emergency or unplanned care’ section of this report.
Rates of psychological distress have climbed over the last decade. Adult respondents (aged 15+ years) are categorised as experiencing high or very high psychological distress if they have a score of 12 or more on the Kessler Psychological Distress Scale. The 2023/24 Health Survey (Ministry of Health 2024b) found that 13.0% of adults aged 15 years and over had experienced high or very high levels of psychological distress in the four weeks prior to the survey, compared with 6.2% in 2013/14.
The 2023/24 Health Survey found that rates of high or very high psychological distress differed for population groups, as follows.
- Females had a higher rate (15.5%) than males (10.2%).
- Rates were higher for disabled adults (33.2%) than non-disabled adults (11.2%).
- Adults living in the most socioeconomically deprived neighbourhoods were more likely (16.9%) to experience high or very high levels of psychological distress than those living in the least deprived neighbourhoods (10.0%).
- Rates were higher for Māori (19.5%) and Pacific adults (20.0%) than for Asian adults (9.2%) and European/Other adults (12.9%).
Rates of high or very high levels of psychological distress were highest in young adults aged 15–24 years (22.9%), followed by those aged 25–34 years (18.0%). Rates of high or very high psychological distress decrease as age increases: see Figure 18.
Figure 18: Percentage of people experiencing high or very high psychological distress, by age group, 2023/24
Use arrow keys to navigate the key indicator items.
- Download
- Download dataset
- Source
Health Survey (Ministry of Health 2024b)
Unmet need for mental health or addiction services
Health Survey results from 2023/24 show that rates of unmet need for mental health or addiction services (defined as a person feeling like they needed professional help for their emotions, stress, mental health or substance use in the past 12 months, but not receiving that help) have also increased, as follows.
- 10.7% of adults had an unmet need for professional help for their emotions, stress, mental health or substance use in 2023/24, compared to 4.9% in 2016/17.
- In 2023/24, unmet need for professional mental health support was highest among adults aged 25–34 years (16.2%).
- In 2023/24, rates of unmet need for professional mental health support were 14.7% for Māori, 12.7% for Pacific peoples, 7.7% for Asian peoples and 10.9% for European/Other.
- 6.5% of children had an unmet need for professional mental health support in 2023/24, compared to 4.8% in 2016/17.
- Disabled adults were more likely to report unmet need for professional mental health support than non-disabled adults (22.2% and 9.6%, respectively). Differences were even greater for disabled and non-disabled children (33.2% and 3.8%, respectively).
Suicide
This section reports the annual rate of suspected self-inflicted death (suspected suicide). Note, it is important not to conflate mental illness with suicide or equate these figures with some measure of the performance of the mental health system. People who die by suicide are almost always acutely distressed, but they do not necessarily have a mental health diagnosis. The reasons that people take their own lives are complex, and factors contributing to a death by suicide accumulate over time.
In the year ended 30 June 2024, there were 617 suspected[13] self-inflicted deaths in New Zealand (Health New Zealand 2024p). The overall age-standardised rate of suspected self-inflicted deaths was 11.2 per 100,000 population. This rate was 3.6% lower than the average over the last 15 years, but the difference was not statistically significant, as suicide rates are highly variable.
The suspected self-inflicted death rate is higher for males than females. In 2023/24, the age-standardised rate per 100,000 population was 15.9 for males and 6.4 per 100,000 for females.
Māori experience high rates of suspected self-inflicted deaths. In 2022/23,[14] the age-standardised rate for Māori was 16.3 deaths per 100,000 Māori, compared with 9.0 for non-Māori. Māori males have the highest rate of suspected self-inflicted deaths. In 2022/23, the age-standardised rate for Māori males (24.8) was about two times the rate of non-Māori males (12.7).
[13] Confirmed suicide rates generally follow the same pattern as suspected suicide rates.
[14] Māori population estimates for 2023/24 are not currently available.
Respiratory diseases
Chronic (non-communicable) respiratory diseases affect the airways and other structures of the lungs. Chronic respiratory diseases are a significant health issue in New Zealand, contributing to high levels of mortality, morbidity and health service use. Some of the most common are chronic obstructive pulmonary disease (COPD), asthma, occupational lung diseases and pulmonary hypertension. Risk factors include tobacco smoke, poor housing conditions (including cold, damp, mouldy and overcrowded houses) (EHINZ (nd)-a), air pollution, occupational chemicals and dusts, and frequent lower respiratory infections during childhood (WHO (nd)).
Mortality data from 2022 shows chronic lower respiratory disease was the third leading cause of death for Māori (behind cancer and ischaemic heart disease), with an age-standardised rate of 42.1 deaths per 100,000 Māori population (Health New Zealand 2025l).
Chronic obstructive pulmonary disease is more common for Māori and Pacific peoples
Chronic obstructive pulmonary disease is the most common respiratory disease. The HQSC reports the following in regard to the prevalence of COPD (HQSC 2024c).
- In 2023, about 66,000 people aged 45 years and over and enrolled in a primary health organisation were estimated to have COPD (3.2% of the population).
- Prevalence increases with age, from 1.5% in those aged 45–64 years to 6.9% in those aged 75 years and older.
- Across all age groups, Māori had the highest estimated rate of COPD, and Asian peoples the lowest rate. Among those aged 65–74 years, Māori had the highest prevalence (11.8%), followed by Pacific peoples (5.1%), European/Other (4.1%) and Asian peoples (1.2%).
If current rates of COPD remain unchanged and population projections hold, the number of hospitalisations for COPD is expected to rise to around 23,100 per year by 2043, up from 11,210 hospitalisations in 2023 – an increase of 106.0% (Ministry of Health unpublished data 2025).
Multimorbidity
Multimorbidity is the presence of two or more long-term health conditions that collectively influence a person’s health (Stanley et al 2018). Having multimorbidity is associated with reduced quality of life, higher mortality and polypharmacy (concurrent use of multiple medicines that can lead to increased risk of complications). People with multimorbidity generally have higher health needs and require more complex care, often resulting in high treatment burden, greater health service use and greater use of unplanned care.
The P3 index (pharmaceutical-based mortality risk index) is based on pharmaceutical dispensing records and can identify people being treated for specific morbidities based on prescribed medication (Stanley et al 2018).[15] This report uses this index to identify people with multimorbidity, as it identifies people with a condition across a wider population and includes a broader spectrum of health severity than the alternative hospitalisation-based index.
The P3 index includes conditions of varying severity, including osteoporosis, psychotic illnesses and malnutrition, along with common combinations of conditions such as diabetes and gastric acid disorder, depression and cardiovascular disease.
An estimated 35.9% of New Zealand adults (18 years and over) were identified with multimorbidity in 2024, up from 31.3% in 2020. The most common conditions were gastric acid disorder (19.6%), reactive airway disease (16.8%) and a cardiovascular disease (16.0%). Figure 19 shows that between 2020 and 2024, the rate of adults with multimorbidity increased at about 3.5% per annum. During this period, the adult population in New Zealand increased by around 0.6% per annum.
Figure 19: Rate of adults (18+ years) with multimorbidity per 100,000 people, 2020–2024
Use arrow keys to navigate the key indicator items.
- Download
- Download dataset
- Source
Ministry of Health unpublished data (2025)
People in older age groups are more likely to have multimorbidity. In 2024, 60% or more of people aged 65 years and over had two or more long-term conditions (Figure 20). These results are consistent with other publications using the P3 index (Stanley et al 2018, Gurney et al 2020) that have highlighted the strong association between age and multimorbidity.
The age groups with the largest change for this measure between 2020 and 2024 were younger: the 25–34-year group and the 35–44-year group. The rate of multimorbidity increased in these age groups by 30.7% and 20.8% respectively. The implications for the health system are that the health care demands and costs associated with caring for people with multimorbidity are growing for all age groups, though the rate of people with multimorbidity is still highest in the older population.
Figure 20: Rate of adults (18+ years) with multimorbidity per 10,000 people, by age group, 2020 and 2024
Use arrow keys to navigate the key indicator items.
- Download
- Download dataset
- Source
Ministry of Health unpublished data (2025)
Figure 21 shows that the proportion of adults with multimorbidity is increasing with age in most ethnic groups, except for Māori and Pacific peoples aged 85 years and above (however, at this oldest age group, the proportions become less reliable for Māori and Pacific peoples because of small numbers). Because the P3 index uses dispensed pharmaceuticals to identify people with multimorbidity, it is affected by people’s ability to access care. Māori and Pacific peoples are more likely to experience barriers to primary care, including the cost of prescriptions (Ministry of Health 2024b). Additionally, for certain conditions included in the P3 index, Māori and Pacific peoples are more likely to be underdiagnosed (and thus under-treated) (Gurney 2020). As a result, the P3 index likely underestimates the prevalence of multimorbidity for Māori and Pacific peoples. Assessing P3 multimorbidity alongside other measures (such as previous hospitalisations) can provide additional insights.
Figure 21: Percentage of people with multimorbidity, by age group and ethnic group (total response), 2024
Use arrow keys to navigate the key indicator items.
- Download
- Download dataset
- Source
Ministry of Health unpublished data (2025)
[15] The P3 index identifies people who are being treated for a condition with a medication. It does not include people with a condition not yet diagnosed and/or not using medications to treat or control it.
Communicable diseases
Communicable diseases remain a public health challenge in New Zealand. These diseases are caused by pathogenic microorganisms, such as bacteria, viruses, parasites or fungi. They can be spread in the community through direct contact, via the air, through contaminated food or water, by blood or other body fluids, and by infection from insects or other animals.
Communicable diseases can spread and cause serious illness, resulting in hospitalisation, disability, chronic disease or death. They can have major economic, education, employment, social and global repercussions (as COVID-19 and antimicrobial-resistant infections have demonstrated). Immunisation plays a vital role in reducing the spread of some communicable diseases and protecting the health of individuals and communities. See the ‘Immunisation’ section below.
This section provides an update for the following conditions: COVID-19, pertussis (whooping cough), invasive meningococcal disease, measles, rheumatic fever, sexually transmitted infections, human immunodeficiency virus / acquired immunodeficiency syndrome (HIV/AIDS) and antimicrobial resistance.
COVID-19
The first case of COVID-19 was recorded in New Zealand on 28 February 2020. Since then, to the year ended 31 December 2024, more than two million cases have been recorded in New Zealand, resulting in 4,534 deaths (Ministry of Health 2025a).[16] For the year ended December 2024, 664 deaths were attributed to the disease.
The immediate phase of the pandemic has receded, but COVID-19 remains. It has added a new disease to the burden of other respiratory illnesses, such as pertussis (whooping cough), influenza and respiratory syncytial virus.
Figure 22 displays the weekly count of New Zealand hospital admissions for COVID-19 from 2020 to 2024, showing 44,513 hospitalisations. In the 2024 calendar year alone, there were 8,793 admissions to hospital for COVID-19. Weekly hospitalisations for COVID-19 reached a peak of 1,110 in the week ending 13 March 2022. Since then, hospitalisation numbers have fluctuated; maximum weekly hospitalisations were 417 in 2023 and 371 in 2024 (Ministry of Health 2025a).
Figure 22: Weekly count of hospital admissions for COVID-19, 2020–2024
Use arrow keys to navigate the key indicator items.
- Download
- Download dataset
- Source
Ministry of Health (2025a)
Long COVID is another contributor to the burden of COVID-19 in New Zealand. Although the exact prevalence of long COVID in the population is not currently known, research is ongoing (Victoria University of Wellington – Te Herenga Waka 2025). The Ministry of Health has published guidelines and several evidence briefs on the subject (Ministry of Health 2024f).
[16] This number includes all deaths where COVID-19 was determined to have been the underlying cause of death or a contributory cause of death.
Pertussis (whooping cough)
Pertussis (whooping cough) is a bacterial respiratory infection caused by Bordetella pertussis. It is highly transmissible and is one of the most infectious vaccine-preventable diseases in humans. The disease is most severe in infants in the first few months of life (Health New Zealand 2025r).
In New Zealand, a national pertussis epidemic was declared on 22 November 2024 following an increase in cases throughout the country. According to the Institute of Environmental Science and Research (ESR), for the year ended 31 December 2024, a total of 1,746 cases of pertussis were recorded in New Zealand. This compares to 141 cases in 2023 and 18 in 2022 (ESR 2025b).
In 2024, 160 cases of pertussis were hospitalised. Infants aged less than five months were the most likely to require hospitalisation. There were 71 cases of pertussis recorded for infants aged zero to five months; of these, 58 cases (82%) required hospitalisation.
Measles
Measles is a serious and highly contagious vaccine-preventable disease that can cause brain swelling, chest infections and death. In 2017, the WHO verified that New Zealand had eliminated measles; this status has been maintained. Elimination is defined as the absence of endemic measles transmission for 12 months or more, in the presence of a well-performing surveillance system (WHO 2013). This means that elimination status can be maintained even if imported cases occur (there was one case of measles in New Zealand in 2024, and 14 cases in 2023), provided cases do not lead to sustained community transmission (ESR 2025a).
Cases of measles are increasing internationally; the risk of measles being brought into New Zealand by travellers is very high.
Invasive meningococcal disease
Invasive meningococcal disease is a serious bacterial infection caused by the bacterium Neisseria meningitidis, known as a meningococcus. Vaccination protects against the most common strains of Neisseria meningitidis. The bacteria can cause severe illnesses, including meningitis (an infection of membranes that cover the brain) and septicaemia (blood poisoning) (Health New Zealand 2024m). Infection can result in long-term impairment, disability and/or death.
In 2024, there were 43 cases (40 confirmed and 3 probable) of invasive meningococcal disease reported in New Zealand. This is similar to 2021, higher than 2020, but lower than 2019, 2022 and 2023. There were two deaths from meningococcal disease in 2024; one in an infant aged less than one year and one in a young adult aged between 15–19 years.
Māori were disproportionately affected by meningococcal disease in 2024, accounting for 40% of all cases (17 out of 43) despite making up less than 18% of the New Zealand population. Among children, the disparity was even greater: Māori children accounted for 80% of cases (12 out of 15). For people aged 15–29 years, the majority (83% of cases; 10 out of 12) were European/Other (ESR 2025a).
Rheumatic fever
Strep throat (caused by group A Streptococcus bacteria) is a contagious bacterial infection of the throat and tonsils. If untreated, it can lead to rheumatic fever, which may cause the heart, joints, brain and skin to become inflamed and swollen. This inflammation can cause rheumatic heart disease with scarring of the heart valves (Health New Zealand 2024b).
New Zealand has historically had higher rates of rheumatic fever compared to comparable countries. Rheumatic fever risk is strongly influenced by the wider determinants of health, such as inadequate or overcrowded housing and socioeconomic deprivation.
In 2023/24 in New Zealand, 194 people were admitted to hospital for the first time with rheumatic fever: a rate of 3.7 per 100,000. This rate is higher than in 2022/23 (2.7 per 100,000) but similar to pre-COVID-19 rates (Health New Zealand 2024o).[17]
For Māori, there was a decrease in rates of hospitalisation between the years 2011/12 and 2015/16, then a stabilisation. However, Māori rates have increased, from 5.4 per 100,000 (48 cases) in 2021/22 to 8.0 per 100,000 (76 cases) in 2023/24.
Rates for Pacific peoples admitted to hospital for the first time with rheumatic fever fluctuated between 2011/12 and 2019/20. Rates declined over the pandemic but sharply increased from 6.7 per 100,000 (24 cases) in 2021/22 to 28.1 per 100,000 (104 cases) in 2023/24.
Figure 23: Rate of first-episode rheumatic fever hospitalisations per 100,000 people, by ethnic group (prioritised ethnicity), 2006/07–2023/24
Use arrow keys to navigate the key indicator items.
- Download
- Download dataset
- Source
Health New Zealand (2024o)
[17] Annual numbers are small and should be interpreted with caution.
Sexually transmitted infections
Sexually transmitted infections are common in New Zealand. Such infections can have serious and long-term impacts. Chlamydia and gonorrhoea can cause pelvic inflammatory disease, which is associated with infertility, chronic pelvic pain and poor pregnancy outcomes. Syphilis can cause serious illness if untreated and can be transmitted from mother to child during pregnancy, leading to stillbirth or congenital syphilis (Ministry of Health 2023a).
Data indicates that Māori and Pacific peoples; young people aged less than 25 years; and gay, bisexual and other men who have sex with men are disproportionately affected by sexually transmitted infections.
In New Zealand, cases of chlamydia, gonorrhoea and syphilis remain high, despite some recent decreases in case numbers (Institute of Environmental Science and Research 2025). In 2024:
- 27,684 cases of chlamydia were recorded, slightly down from 28,166 in 2023
- 7,581 cases of gonorrhoea were recorded, slightly down from 7,794 in 2023
- 767 cases of syphilis were recorded, up from 739 cases in 2023.
Over the period 2019–2024, 31 cases of congenital syphilis were reported.
Human immunodeficiency virus (HIV) acts by depleting the body’s normal immune defence mechanism. Without treatment, HIV causes acquired immunodeficiency syndrome (AIDS). Incidence rates of HIV in New Zealand remain low; most notified cases were first diagnosed overseas. Gay, bisexual and other men who have sex with men experience a disproportionate burden of new HIV infections, as do the Māori and Asian ethnic groups.
For the year ended 31 December 2024, 277 people were notified with HIV in New Zealand. This includes 95 people who were first diagnosed in New Zealand, 166 who were first diagnosed overseas and 16 people for whom information is still awaited (University of Otago 2025).
Antimicrobial resistance
Antimicrobials – including antibiotics, antivirals, antifungals and antiparasitics – are medicines used to prevent and treat infectious diseases in humans, animals and plants. Antimicrobial resistance occurs when bacteria, viruses, fungi and parasites become resistant and respond less well to antimicrobial medicines, sometimes losing their effectiveness in treating infections completely.
Antimicrobial resistance is on the rise globally. The WHO lists antimicrobial resistance among the top ten global health care challenges of the decade.
New Zealand has very high consumption of antimicrobials in human health compared with other developed countries. This high use is in part driven by inappropriate use of antimicrobials – for example, the use of antibiotics in patients with viral infections. The proportion of infections that are caused by drug-resistant microbes is lower in New Zealand than it is in many other countries – but rising. Hospitals in the Te Manawa Taki region of New Zealand continue to experience an outbreak of an antimicrobial-resistant bacterium known as a vancomycin-resistant enterococcus, first detected in late 2022 (Ministry of Health 2024d).
Health drivers Ngā ākitanga hauora
Health drivers are factors that influence population health. Health and wellbeing are influenced by the complex interplay of factors and conditions in which people are born, grow up, live, work and age. Data on health drivers provides insights into why health outcomes vary across time and between groups. Drivers include the determinants of health and risk and protection factors.
Health determinants can be broadly categorised into social, economic, cultural and environmental domains. These factors often intersect and compound one another, influencing individual and population health in complex ways. Risk and protection factors are specific exposures that change the likelihood of disease or poor health.
Many determinants of health are modifiable, meaning they can be influenced through policies and actions at societal, community and individual levels. While some factors can be shaped by individuals or communities, many, such as income, housing, healthy food affordability, education and access to health care, require development of effective, targeted, evidence-based strategies for meaningful improvements to occur.
Addressing health drivers plays a critical role in improving the inequitable, unfair and preventable differences in health outcomes that individuals and communities experience.
Determinants of health and wellbeing
Social and economic determinants of health drive health inequities. Information from the WHO shows that health and illness follow a social gradient in all countries: the higher the socioeconomic deprivation, the worse people’s health outcomes (WHO 2025).
In New Zealand, individuals living in the most socioeconomically deprived neighbourhoods experience significantly shorter lives compared to those in the least deprived neighbourhoods (see Figure 7 in the ‘Life expectancy’ section). Māori and Pacific peoples are overrepresented in the highest deprivation areas: by total response ethnicity, 40.5% of Māori and 52.0% of Pacific people live in the most deprived neighbourhoods, compared with 17.9% of Asian peoples and 14.4% of European (Stats NZ 2024h). Furthermore, Māori and Pacific peoples experience shorter lives compared with others in the same deprivation areas (Health New Zealand 2024k).
Poverty is increasing in New Zealand
Poverty and poor health are linked across nearly all indicators of wellbeing: socioeconomically disadvantaged populations experience worse health outcomes.
Material hardship is defined as lacking six or more essential items, such as putting off doctor’s visits, going without fresh fruit and vegetables or not being able to pay for adequate heating. In the year ended June 2024, 1 in 10 people in New Zealand (9.4%) were living in material hardship (Stats NZ 2025g). This rate has steadily increased since 2021, when 7.1% of people in New Zealand were living in material hardship.
Child poverty is more prevalent among Māori and Pacific peoples and in households with disabled people
In the year ended June 2024, 156,600 New Zealand children (one in seven, or 13.4% of all children) lived in households experiencing material hardship (Stats NZ 2024d; Stats NZ 2025c). Results for the year ended June 2024 are similar to those of the previous year, but up from 11.0% in the year ended June 2021.
The proportion of children living in material hardship differs by population group, as follows.
- In the year ending June 2024, nearly a quarter of Māori children (23.9%) and 28.7% of Pacific children lived in households experiencing material hardship, compared with 10.1% of European children and 6.8% of Asian children.
- Disabled children (21.0%) were more likely to experience material hardship than non-disabled children (12.3%).
- Children in households with at least one disabled person (22.6%) were also more likely to experience material hardship than children in households with no disabled individuals (9.5%).
Reducing material hardship is recognised as a priority in the Child and Youth Strategy 2024–2027 (Ministry of Social Development 2024), as material hardship directly influences a range of outcomes for children and young people that can persist into adulthood. These include:
- cognitive and socio-emotional development – negatively affecting the way a child’s brain develops
- school attendance and achievement – lower educational achievement
- health outcomes – worse physical and mental health in the present and in the future
- justice outcomes – poorer present and future outcomes, including youth and adult offending.
As rates of households experiencing material hardship increase, there has been an upward trend in household food insecurity. Food insecurity is defined as the limited or uncertain availability of nutritionally adequate and safe foods, or limited ability to acquire personally acceptable foods that meet cultural needs in a socially acceptable way. This means that people may not have enough to eat, may not be able to eat a varied diet with enough healthy food or may not be able to provide food to share at social occasions (Ministry of Health 2019).
The 2023/24 Health Survey found that 27.0% of children (aged 0–14 years) lived in households where food runs out often or sometimes. This rate increased from 20.0% in 2019/20. Childhood exposure to household food insecurity is higher in certain population groups, as follows.
- Among children in the most deprived neighbourhoods, 46.9% lived in households where food ran out often or sometimes, compared to 15.1% of children in the least deprived neighbourhoods.
- Over half of all Pacific children (54.8%) and one in three Māori children (34.3%) lived in households where food ran out often or sometimes. This compares to 21.9% of European/Other children and 17.1% of Asian children.
- 41.0% of disabled children lived in households where food ran out often or sometimes, compared to 25.0% of non-disabled children.
Unemployment adversely affects mental health and overall wellbeing, and its prevalence is sharply divided among demographic groups
Stats NZ data shows that unemployed people fare worse than employed people across a range of measures, including poorer life satisfaction and lower family wellbeing. Unemployment is associated with loss of social connectedness, poor mental wellbeing and not having enough money to meet everyday needs (Stats NZ 2020).
Unemployment increased to 4.7% for the year ended December 2024, up from 3.7% in the previous year (Stats NZ 2025h). This was the highest rate since 2016, when it was 5.1%. The number of unemployed people rose by 33,000 to 156,000 in the 12 months ending December 2024. Unemployment rose for both males and females. For males, the unemployment rate was 4.5% in December 2024, up from 3.5% in December 2023. For females, the unemployment rate was 4.9%, up from 4.0% in 2023.
Unemployment rose for all ethnic groups in 2024 (Figure 24). For Māori, the unemployment rate was 9.2% in December 2024, up from 7.9% in December 2023. For Pacific peoples, the unemployment rate was 9.5%, up from 6.6%. For Asian peoples, the rate was 4.5%, up from 3.3%. For European/Other, the unemployment rate was 3.8%, up from 3.1% in 2023.
Figure 24: Unemployment rate by ethnic group (total response), 2015–2024
Use arrow keys to navigate the key indicator items.
- Download
- Download dataset
- Source
Stats NZ (2025h)
For disabled people (in the June 2024 quarter), the unemployment rate was 11.0% (Whaikaha 2024). This was up from 7.9% in the in the June 2022 quarter (Whaikaha 2023).
In the December 2024 quarter, the seasonally adjusted proportion of young people aged 15–24 who were not in employment, education or training rose to 13.5%, up from 12.3% in the September 2024 quarter. The number of young people in this situation rose by 8,000 over the quarter, to 91,000 (Stats NZ 2025j).
Experience of discrimination
Some New Zealanders experience racism and discrimination in the health system. While these experiences are not unique to the health system, they are associated with barriers to accessing health services, including primary care (Harris 2012; Ministry of Health 2023b). Experiences of discrimination also have the potential to affect a wide range of health outcomes and risk factors (Harris 2012; Ministry of Health 2023b).
The Health Survey included questions on racial discrimination in 2011/12, 2016/17 and 2020/21 (Ministry of Health 2023b).[18] Analysis of the findings shows the following.
- Verbal abuse was the most common type of racial discrimination experienced across all ethnic groups, followed by unfair treatment by a health professional for Māori and Pacific adults.
- People who reported experiencing racial discrimination in the past 12 months also reported higher rates of psychological distress, lower rates of good/very good/excellent self-rated health and higher rates of unmet need for primary health care, compared to those who did not.
The 2023 Household Disability Survey found that more than 34,000 disabled people (around 11%) experienced difficulties due to being treated poorly or discriminated against when interacting with health professionals in the last 12 months (either seeking an appointment or accessing a service) (Stats NZ 2025d). This was about as common as experiencing difficulties due to cost.
The HQSC surveys adults about their experience as patients in primary care (HQSC 2024b). For the period ending November 2024, 8.1% reported they were treated unfairly at their last appointment. Reasons for unfair treatment include factors such as age, gender, ethnic group, income, religious beliefs or sexual orientation.
Other data sources offer valuable insights into the discrimination people encounter in their daily lives. In 2023, Stats NZ Wellbeing Indicators (Stats NZ 2025m) showed that 21.8% of New Zealanders aged 15 years and over had experienced discrimination for reasons including their age, gender or ethnic group in the past 12 months. This was similar to the rate in 2021 (21.4%), but up from 17.4% in 2018.
By population group, the Wellbeing Indicators show the following.
- Women were more likely to experience discrimination (23.9%) than men (19.3%).
- By ethnic group, Asian peoples were most likely to experience discrimination (28.2%), followed by Pacific peoples (26.9%) and Māori (26.8%). European/Other were least likely to experience discrimination (20.1%).
- Disabled people were more likely to experience discrimination (27.6%) than non-disabled people (21.2%).
The General Social Survey reported that 44.9% of LGBT+ people experienced some form of discrimination in the last 12 months; this rate is almost double that of non-LGBT+ people (20.4%). The rates were almost three times higher for transgender people (62.7%) compared to cisgender people (21.6%) (Stats NZ 2024j).
[18] Questions about racial discrimination covered specific forms of discrimination (mostly interpersonal) and only asked about discrimination in some settings (health care, employment and housing).
Housing
Quality of housing has major implications for people’s health. Poor housing is associated with a wide range of health conditions, such as respiratory diseases, cardiovascular disease, injuries, poor mental health and infectious diseases (WHO 2018). In New Zealand, evidence from the Health Research Council shows that cold, damp, mouldy homes and overcrowding contribute to infectious illnesses such as respiratory diseases, rheumatic fever and meningococcal disease (Health Research Council (nd)).
Housing profoundly affects young people’s health, wellbeing and development. Not only do dampness and mould pose risks for respiratory health, but housing stability is also crucial for young people. Disparities in housing quality, safety and security contribute to persistent inequities in child and youth wellbeing (University of Auckland 2024a).
Housing affordability is worsening, contributing to poverty and overcrowding
Housing affordability in New Zealand worsened in 2024. The proportion of all households spending more than 40% of their income on housing costs rose from 18.2% in 2023 to 19.7% in 2024 (Stats NZ 2025g). This housing cost burden disproportionally impacted renters and households in the lowest two income quintiles, as follows.
- Renters: 28.4% of all renters spend more than 40% of their income on rent, compared to households with a mortgage (14.8%).
- Households in the lowest two income quintiles: 31.7% of households in the lowest income quintile (income under $41,000) and 31.0% in the second income quintile (income between $41,600 to $69,999) spent more than 40% of their income on housing costs. Conversely, only 6.0% of households in the highest quintile (income greater than $153,700) spent more than 40% of their income on housing costs.[19]
[19] 79.2% of all single-parent households are in the two lowest income quintiles (with an annual household income of less than $46,000) (Stats NZ 2025f).
Many households are cold and crowded, potentially leading to poor health outcomes
In 2023, people who lived in a home they did not own were more likely to report their home was ‘always’ or ‘often’ colder in winter than they would like: 14.5% of owner-occupiers reported their homes were always or often colder than they would like, whereas 33.0% of non-owner-occupiers did so (Stats NZ 2024j).
Household crowding[20] continues to increase. The 2023 Census revealed that over 100,000 households (around 1 in every 16 households) experienced crowded living conditions in 2023, up from around 1 in 20 households in 2013 (Stats NZ 2024e). According to Environment Health Intelligence New Zealand (EHINZ), in 2018 Māori and Pacific peoples were more affected by household crowding; 38.5% of Pacific peoples and 20.8% of Māori lived in a crowded household (EHINZ (nd)-b).
[20] Stats NZ has measured household crowding since the 1980s. It is calculated on the number of bedrooms needed based on the demographic composition of the household.
Younger people and disabled people are more likely to experience homelessness
According to the 2023 Census, 112,496 people (2.3%) of the usually resident population were estimated to be severely housing deprived (homeless)[21]; this is an increase from 99,462 people (2.1%) in 2018 (Stats NZ 2024b).
Disabled people were more likely to experience severe housing deprivation. According to the Census, 4.1% of disabled people were estimated to be severely housing deprived: more than double the rate of non-disabled people (2.0%).
By age, children aged under 15 years and young people aged 15–29 years experienced higher rates of severe housing deprivation (3.2% and 2.9% respectively). The lowest rate was for older people (1.7% of people aged 65 years and over).
By ethnic group (total response), Pacific peoples were most affected by severe housing deprivation (6.6% of Pacific peoples), followed by Māori (3.9% of Māori).
[21] Severe housing deprivation is defined as living in severely inadequate housing due to a lack of access to minimally adequate housing. This means not being able to access a private dwelling to rent or own that has basic amenities (cooking facilities, safe drinking water, a kitchen sink, a bath or shower, a toilet and electricity).
Risks and protective factors
Social, economic, cultural, and environmental circumstances, such as access to healthy food and secure housing, shape individual health. A government can play a critical role in reducing exposure to risk factors. Examples include public health campaigns, taxation (such as on tobacco) and the funding of environments to support healthier lives (including walkable cities, bike lanes, and green spaces), as well as reducing the availability of unhealthy food.
The following risks and protective factors are covered in this section.
- overweight and obesity
- physical activity
- nutrition
- smoking and vaping
- alcohol.
Overweight and obesity
A recent study published in the Lancet (GBD 2025a) highlights the escalating global prevalence of people who are overweight or obese, projecting that by 2050 over half of adults and around a third of children and adolescents (GBD 2025b) worldwide will be overweight or obese. Being overweight or obese poses significant health risks, including increased incidence of diabetes, cardiovascular diseases and certain cancers; this trend is set to intensify existing health inequities globally. New Zealand has the third highest adult obesity rate in the OECD, and that rate continues to increase (Ministry of Health 2025b).
The 2023/24 Health Survey (Ministry of Health 2024b) found as follows.
- One in three adults in New Zealand (33.8% or nearly 1.5 million adults) were classified as obese (a body mass index (BMI) measured at 30.0 or above), up from 31.3% (1.25 million) in 2018/19.
- The prevalence of obesity was slightly higher for women (34.9%) than men (32.7%).
- Nearly half of adults (47.8%) living in the most socioeconomically deprived neighbourhoods had a BMI of 30.0 or above, compared to 25.7% of adults living in the least deprived neighbourhoods.
- The prevalence of obesity among adults differed by ethnic group: 65.0% of Pacific, 50.5% of Māori, 32.8% of European/Other and 15.9% of Asian adults had a BMI of 30.0 or above.
- Disabled adults were more likely to be classified as obese (44.3%) compared to non-disabled adults (32.9%).
Data from the World Health Organization (WHO) shows the age-standardised percentage of New Zealand adults classified as obese has increased significantly, from 21.4% in 2000 to 33.6% in 2022 (WHO 2024b). Globally, rates of obesity have increased across almost all countries on all continents. The only two countries that have seen reductions in the prevalence of adult obesity during the last two decades are France and Spain.
The 2022 age-standardised proportion of obese adults in New Zealand was higher than in Canada (26.2%) and the United Kingdom (26.8%), but was similar to Australia (30.2%) and lower than the United States (42.0%). There were significant differences between population groups across New Zealand, underscoring the impact of broader social and structural determinants of health.
Childhood obesity has increased in recent decades
Childhood body size is closely tied to excess body weight in adults. The Lancet study on the global, regional and national prevalence of overweight and obesity (GBD 2025b) reported that the global prevalence of obesity in children and adolescents has increased by 244% in the past 31 years and is forecast to increase a further 121% in the next 29 years.
In New Zealand, data from the 2023/24 Health Survey shows the following.
- One in eight children aged 2–14 years (12.5%) were classified as obese[22] in 2023/24, compared to 11.4% five years ago in 2018/19.
- About one in five children (21.9%) living in the most socioeconomically deprived neighbourhoods were classified as obese, compared to 5.4% of children living in the least deprived neighbourhoods.
- The prevalence of obesity among children differed by ethnic group: 37.8% of Pacific children and 15.3% of Māori children were classified as obese, compared with 9.1% of European/Other children and 5.7% of Asian children.
- Disabled children were more likely to be classified as obese (20.3%) than non-disabled children (11.7%).
[22] Obesity in children was defined as: a BMI equivalent to an adult BMI of 30 (or greater). BMI is calculated by dividing weight in kilograms by height in metres squared (kg/m²).
Physical activity
The Ministry of Health recommends that adults do at least 2.5 hours of moderate-intensity activity per week, spread out over the week. Data collected by the WHO shows that about two in five adults aged 18 years and over in New Zealand are physically inactive(WHO 2022a). This rate is similar to the rate in the United States, but higher than the rate in Australia and Canada, where it was around 30% (WHO 2022a).
The 2023/24 Health Survey found that fewer than half of adults (46.6%) met physical activity guidelines, down from 52.0% in 2013/14. Rates of physical activity differ by population group, as follows.
- Adults living in the most socioeconomically deprived neighbourhood were less likely to be physically active (42.4%) compared with adults in the least deprived neighbourhoods (52.3%).
- The most physically active groups were European/Other adults (49.7%) and Māori adults (48.5%), followed by Pacific adults (38.8%) and Asian adults (37.9%).
- Men were more likely to be physically active (50.4%) than women (43.0%).
- Disabled adults were least likely to be physically active (31.5%), followed by adults aged 75 years and over (36.7%).[23]
The Health Survey measures the proportion of children who use active transport (such as walking, cycling or another physical activity) to travel to and from school. In 2023/24, 38.8% of children used active transport to travel to and from school, down from 44.4% in 2013/14.
[23] We note that benchmarking of sufficient physical activity reflects the normative standards of those who do not experience disability.
Nutrition
The Ministry of Health publishes guidelines on the recommended number of servings of fruit and vegetables per day (two or more servings per day of fruit and five to six servings per day of vegetables, depending on age and gender) (Health New Zealand 2024i; 2025e).
In this regard, the 2023/24 Health Survey found as follows.
- Adults and children were more likely to meet fruit intake recommendations: rates were 47.1% and 70.5% respectively. However, only 9.1% of adults and 8.2% of children ate the recommended amount of vegetables each day.
- 5.8% of adults ate the recommended number of servings of both fruit and vegetables per day, similarly to the previous year (6.7%).
- Adults living in the most socioeconomically deprived neighbourhoods were less likely to eat the recommended number of servings of both fruit and vegetables per day (3.7%) compared with adults in the least deprived neighbourhoods (9.1%).
- By ethnic group, 5.2% of Māori, 5.9% of Pacific people, 2.2% of Asian people and 6.6% of European/Other people ate the recommended servings of fruit and vegetables.
- Among children (aged 2–14 years), 7.8% ate the recommended number of servings of both fruit and vegetables per day, similarly to the previous year (8.1%).
Rates of breastfeeding have increased over the last decade
The Ministry of Health recommends exclusive breastfeeding until babies are ready for solids at around six months of age. The 2023/24 Health Survey found that 55.7% of babies were exclusively breastfed until at least four months of age. There has been a steady increase in the rate of exclusive breastfeeding. A decade ago, 46.1% of babies were exclusively breastfed to at least four months of age. The 2023/04 Health Survey found as follows.
- Babies living in households in the most socioeconomically deprived neighbourhoods were less likely to be exclusively breastfed until at least four months of age (49.1%) than babies in the least socioeconomically deprived neighbourhoods (60.3%).
- The percentage of babies exclusively breastfed until at least four months of age varied by ethnic group: 51.5% of Māori babies, 53.3% of Pacific babies, 62.7% of Asian babies and 56.2% of European/Other babies.
Smoking and vaping
Rates of daily smoking continue to decline in New Zealand. The 2023/24 Health Survey found that 6.9% of adults (aged 15 years and over) smoked daily. This compares with 15.9% a decade ago.
Rates of daily smoking differ by population group. The 2023/24 Health Survey found as follows.
- The daily smoking rate was higher for men (8.1%) than women (5.8%).
- The daily smoking rate was higher for people living in the most socioeconomically deprived neighbourhoods (13.9%) than for people in the least deprived neighbourhoods (2.5%).
- By ethnic group, rates of daily smoking were 14.7% for Māori, 12.3% for Pacific peoples, 3.8% for Asian peoples and 6.1% for European/Other.
- The daily smoking rate was higher for disabled people (10.2%) than for non-disabled (6.6%).
World Bank data shows that the age-standardised percentage of New Zealand adults (aged 15 years and over) who use tobacco products[24] reduced significantly between 2000 and 2022, from 30.4% to 12.2% (World Bank 2025). The 2022 New Zealand rate is slightly lower than those in the Australia and the United Kingdom, but is around half the average of high-income countries, the average of OECD countries and the world average.
The Ministry of Health recognises that vaping products, especially those that contain nicotine, may help some people stop smoking or cut down, as they can address both the nicotine dependence aspect and the behavioural aspect of smoking (Ministry of Health 2021). However, the Ministry does not recommend vaping for non-smokers, as it can cause negative health outcomes (Health New Zealand 2025q).
The Health Survey first measured daily vaping in 2015/16. Vaping rates have increased over time. The 2023/24 Health Survey found as follows.
- 11.1% of adults (aged 15 years and over) reported daily vaping, up from 2.6% of adults in 2017/18.
- 26.5% of young people (aged 18–24) reported daily vaping. This age group has the highest prevalence of daily vaping and the largest increase in the vaping rate over time.
- 12.5% of disabled people reported daily vaping, compared with 11.0% of non-disabled people.
The Ministry of Health (Ministry of Health 2024j) reports as follows.
- The estimated number of daily smokers decreased from 573,000 to 300,000 between 2011/12 and 2023/24.
- The estimated number of daily vapers increased from 33,000 to 480,000 between 2015/16 and 2023/24.
- One in six adults (16.8%) smoked and/or vaped daily in 2023/24. This rate was up from 15.1% in 2018/19.
- Daily smoking decreased in all age groups from 2011/12 to 2023/24, although in the two oldest age groups (65–74 and 75+ years) the decreases were relatively small.
- Between 2015/16 and 2023/24, daily vaping increased in all age groups except those aged 75+ years. Daily vaping increased more quickly in younger age groups, especially those aged 15–24 years. Increases in daily vaping in this age group exceeded decreases in daily smoking.
Figure 25: Prevalence of daily smoking and daily vaping, by age group, 2011/12–2023/24
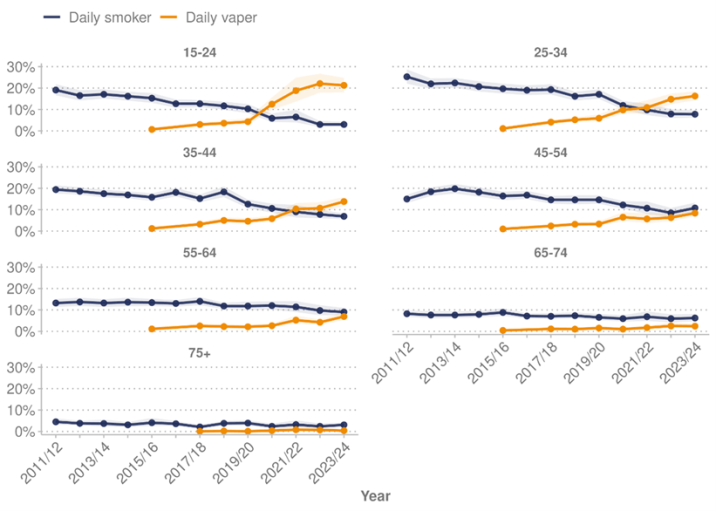
Note: Shaded areas indicate 95% confidence intervals.
Source: Health Survey (Ministry of Health 2024b)
[24] Tobacco products include smoked and/or smokeless (oral and nasal) tobacco but exclude e-cigarettes or similar products that do not contain tobacco.
Alcohol
The 2023/24 Health Survey found that, across the total population, 16.6% of adults (15 years and over) had a hazardous drinking pattern[25] (around 718,000 adults). This rate is similar to that of the previous year (16.0%), but down from 20.4% in 2018/19. The largest decrease in hazardous drinking over the last five years was among young people aged 18–24 years (from 35.8% to 22.6%).
Rates of hazardous drinking differ by population group. The 2023/24 Health Survey found as follows.
- Rates of hazardous drinking were higher for men (22.2%) than women (11.2%).
- Rates of hazardous dinking were higher for adults living in the most deprived neighbourhoods (19.1%) compared to those living in the least deprived neighbourhoods (13.8%).
- By ethnic group, rates of hazardous drinking were 29.6% for Māori, 16.2% for Pacific peoples, 5.7% for Asian peoples and 17.9% for European/Other.
- The hazardous drinking rate was higher for disabled adults (17.9%) than non-disabled adults (16.5%).
New Zealand has a medium level of alcohol consumption compared to other high-income countries: adults 15 years old and over consumed around 8.7 litres of alcohol per person per year in 2022. This has remained reasonably stable over the last two decades, and is broadly in line with Canada (8.1 litres in 2022), the United States (9.5 litres in 2021), the United Kingdom (9.9 litres in 2022) and Australia (10.1 litres per person in 2019) (OECD 2025a).[26]
[25] Hazardous drinking is defined as a score of eight or more on the Alcohol Use Disorders Identification Test, suggesting hazardous or harmful alcohol consumption.
[26] This indicator is based on annual sales of pure alcohol and is not usually adjusted for tourist consumption and unrecorded alcohol consumption, such as domestic or illegal production.
Drivers of differences in health outcomes
The ‘Determinants of health and wellbeing’ section highlights disparities that certain groups face in key drivers of health outcomes; in particular, Māori, Pacific peoples, and disabled people. While the determinants of health explain some of the differences in outcomes, they do not do so completely. For example, even after accounting for age, sex, and deprivation, Māori and Pacific adults experience higher rates of hospitalisations for leading chronic conditions compared with European/Other adults (Health New Zealand 2024k).
Health New Zealand’s Life Expectancy in Aotearoa report shows that these disparities extend to life expectancy. Lives of Māori living in areas of high deprivation are on average 7.4 years shorter than non-Māori, non-Pacific peoples living in the same areas. For Pacific peoples, this gap is 4.6 years. Māori living in the least deprived neighbourhoods have a smaller, yet still substantial 2.2-year life expectancy gap, compared with non-Māori, non-Pacific peoples living in those areas (Health New Zealand 2024l).
The Health New Zealand report provides context on the contributors to disparities experienced by Māori and Pacific peoples. Around 60% and 50% of the life expectancy gap for Māori and Pacific peoples respectively are attributable to amenable or preventable conditions: conditions that could potentially be avoided through public health initiatives or timely and effective health care services. This highlights the importance of health care systems and public health policies that are accessible and effective for the communities they serve.
Table 3 provides examples of unmet need for health services and presents the proportion of adults experiencing these barriers. The adjusted rate ratio is also shown for each population group, comparing results against a comparator group. An adjusted rate ratio above 1 shows the indicator is more likely in the group of interest than in the comparison group, after adjusting for demographic variables that could influence the comparison. For example, after accounting for age and gender, disabled adults were 1.38 times as likely as non-disabled adults (ie, 38% more likely) to experience unmet need due to wait times.
Indicator | Māori | Pacific peoples | Disabled people | |||
|---|---|---|---|---|---|---|
Proportion | Ratio* | Proportion | Ratio* | Proportion | Ratio* | |
| Adult unmet need for GP due to wait time | 25.2% | - | 38.1% | 1.59 | 32.1% | 1.38 |
| Adult unmet need for GP due to cost | 19.6% | 1.22 | 22.3% | 1.40 | 22.3% | 1.89 |
| Adult unfilled prescription due to cost | 7.6% | 1.88 | 9.1% | 2.18 | 11.2% | 3.57 |
| Adult unmet need for professional help for mental health | 14.7% | 1.31 | 12.7% | - | 22.2% | 3.00 |
| Adult unmet need for dental care due to cost | 54.1% | 1.22 | 57.2% | 1.31 | 53.1% | 1.33 |
Notes:
*Ratios are adjusted for age and gender. Māori adults are compared to non-Māori adults, Pacific adults are compared to non-Pacific adults, and disabled adults are compared to non-disabled adults. Ratios that are not significant are not shown (-).
Total response ethnicity has been used – see HISO 1001:2017: ethnicity data protocols (Health New Zealand 2017) for more information.
Source: Health Survey (Ministry of Health 2024b)
Health system Te pūnaha hauora
New Zealand’s health system is founded on collaboration, partnership and shared leadership. It has a simple but ambitious goal: to achieve pae ora (healthy futures) for all New Zealanders.
The focus of the health reforms in 2022 was to achieve equity in health outcomes, simplify the health system, improve consistency of care, shift the focus to increased preventative care, improve the use of data and digital tools and build a unified workforce (Health New Zealand 2024c).
This section covers health strategy, health funding and changes to funding over time. It discusses the health workforce of doctors and nurses and their ratio to population numbers. People’s experience with health services lies at the heart of the health system; the ‘Experience of care’ section provides information across primary and hospital secondary services.
Health strategy
The health system exists to protect, promote and improve the health and wellbeing of New Zealanders.
The Government Policy Statement on Health 2024–2027 was published in July 2024 (Ministry of Health 2024c). It sets government expectations for health system delivery for the three-year period, with a focus on achieving timely access to quality health care. It also sets out five priority areas for the health system:
- access – ensuring all New Zealanders have equitable access to the health care services they need, no matter where they live
- timeliness – ensuring all New Zealanders can access services in a prompt and efficient way
- quality – ensuring New Zealand’s health care services are safe, easy to navigate, understandable and welcoming to users, and are continuously improving
- workforce – ensuring we have a skilled and culturally capable workforce who are accessible, responsive and supported to deliver safe and effective health care
- infrastructure – ensuring the health system is resilient and has the digital and physical infrastructure it needs to meet people’s needs now and in the future.
These priority areas are supported by five health targets: faster access to cancer treatment, improved childhood immunisation rates, shorter stays in emergency departments, shorter wait times for first specialist assessments and shorter wait times for elective treatment (Ministry of Health 2024e). The Government Policy Statement (GPS) also outlines priorities for mental health, addiction and suicide prevention, which align strongly with overall health system priorities (Ministry of Health 2024g).
The GPS also focuses on accelerating action to address five non-communicable diseases: cancer, cardiovascular disease, respiratory disease, diabetes and poor mental health. Together, these conditions account for around 80% of deaths and considerable health loss in New Zealand. The GPS outlines how the health system will achieve improved prevention of these non-communicable diseases through addressing five modifiable risk factors: alcohol, tobacco, poor nutrition, physical inactivity and adverse social and environmental factors (Ministry of Health 2024c).
Health funding
Over the past 20 years, Vote Health (the main source of government funding and expenditure for New Zealand’s health system) has increased (see Figure 26) as follows.
- Total nominal Vote Health expenditure (not adjusted for inflation) rose from $9.8 billion in 2005/06 to $30.6 billion in 2024/25.
- Total nominal Vote Health expenditure, excluding capital, COVID-19-related expenditure and Disability Support Services (which was shifted to a new ministry, Whaikaha, the Ministry of Disabled People, in 2022) funding, rose from $8.5 billion in 2005/06 to $26.8 billion in 2024/25, an average increase of 6.3% per year.[27]
Figure 26: Vote Health expenditure, nominal ($billions), 2005/06–2024/25
Use arrow keys to navigate the key indicator items.
- Download
- Download dataset
- Source
Ministry of Health unpublished data (2025)
Figure 27 compares Vote Health expenditure (excluding capital, COVID-19 and DSS) after adjusting for inflation (real), showing an increase in real terms from $8.5 billion in 2005/06 to $14.6 billion in 2024/05: an average annual increase of 2.9% per year.
Figure 27: Vote Health expenditure, real and nominal ($billions), 2005/06–2024/25
Use arrow keys to navigate the key indicator items.
- Download
- Download dataset
- Source
The Treasury (2025), Ministry of Health unpublished data (2025)
Health expenditure as a percentage of gross domestic product (GDP) indicates Vote Health spending relative to the size of the overall New Zealand economy[28]. In 2024/25, Vote Health accounted for 7.0% of GDP. When capital expenditure for health is excluded, this figure was 6.2%. Vote Health as a percentage of GDP has increased over time. In 2005/06, Vote Health accounted for 5.5% of GDP (when capital expenditure is excluded, this figure was 5.2%).
The population of New Zealand has increased over time; therefore, it is useful to consider Vote Health expenditure per capita (per person). Figure 28 shows that both nominal (unadjusted) and real (inflation-adjusted) health expenditure per person increased between 2005/06 and 2024/25. Real per capita spending increased from $2,038 per person to $2,714 per person, an average annual increase of 1.5%.
Figure 28: Vote Health expenditure, real and nominal, per capita, 2005/06–2024/25
Use arrow keys to navigate the key indicator items.
- Download
- Download dataset
- Source
The Treasury (2025), Ministry of Health unpublished data (2025)
[27] Capital, COVID-19 and Disability Support Services funding is excluded to show a consistent long-run series, which removes ‘lumpy’ expenditure (capital), short-term expenditure (COVID-19) and changes to inclusions in Vote Health (Disability Support Services).
[28] Vote Health does not capture privately funded health spending.
Pharmaceutical funding
Within the government’s total health funding (Vote Health), the Pharmaceutical Management Agency (Pharmac) manages a fixed budget (the medicines budget) to fund medicines, vaccines, related products and some medical devices used in the community.
Pharmac uses a prioritisation process to determine how the budget will be spent, comparing costs and benefits, to get the best health outcomes. This process draws on clinical and economic evidence, advice from clinicians and other experts and the lived experience of people with various health conditions (Pharmac 2024).
The medicines budget has increased over time to invest in new medicines, expand access and ensure continuous funding of existing treatments. The increase is also in response to other cost pressures, including price increases, population growth and demographic changes, changes in clinical practice, the flow-on consequences of older medicines being discontinued and the market shifting to more expensive treatments.
The changes to the medicines budget also account for Pharmac’s expanded responsibilities. For example, in July 2012, the responsibility and the budget for vaccine prioritisation and procurement was transferred to Pharmac from the Ministry of Health.
When a policy initiative significantly affects Pharmac’s medicines budget, it may receive time-limited funding to accommodate the increase in costs. In subsequent budgets, the government usually maintains these out-of-cycle uplifts to ensure that Pharmac is not required to restrict access or de-list funded medicines and can continue to enable access for patients.
Figure 29 shows how expenditure of the medicines budget managed by Pharmac changed between 2013/14 and 2023/24, rising from $795 million to $1,521 million during this period.
Figure 29: Combined pharmaceutical budget 2013/14–2023/24
Use arrow keys to navigate the key indicator items.
- Download
- Download dataset
- Source
Pharmac (2025)
Health workforce
The New Zealand health workforce encompasses both regulated and non-regulated professionals working across primary, secondary, pharmacy, community and aged care. Workforce data, particularly for the non-regulated workforce, is limited, but Health New Zealand compiles headcount numbers from data provided by the authorities that regulate doctors, nurses, midwives and allied health practitioners.
This information is provided in Table 4. It shows the number and percentage change in these workforces between 2023 and 2024 and the number and percentage change over the period 2020 to 2024.[29] For context, the total New Zealand population increased by 4.9% between 2020 and 2024 (Health New Zealand 2025s). It is important to note that there is variation in medical workforce coverage across the country, and variation by specialty and subspecialty, not captured in the table below.
| Group | Total 2024 | Increase from 2023 (%) | Increase between 2020 and 2024 (%) |
|---|---|---|---|
| Doctors | 20,021 | 670 (3.5) | 2,356 (13.3) |
| Nurses | 69,153 | 5,508 (8.7) | 11,570 (20.1) |
| Allied health | 35,637 | 2,203 (6.6) | 4,576 (14.7) |
| Midwives | 3,215 | 122 (3.9) | -33 (-1.0)[30] |
Source: Health New Zealand unpublished data (2025)
[29] All the New Zealand workforce data has been compiled by Workforce Analytics and Forecasting, National People Operations within Health New Zealand, from unpublished datasets provided by the regulatory authority for each profession. Numbers for nurses and midwives exclude those with a New Zealand registration located overseas.
[30]The midwifery workforce in New Zealand has been recovering from a low following the COVID-19 pandemic and has not yet returned to March 2020 numbers.
The number of registered doctors per 1,000 people has increased
In 2024, there were 3.7 doctors per 1,000 people in New Zealand, up from 3.5 in 2020. Key demographics of the doctor population are as follows:
- Ethnic group: The proportion of Māori and Pacific doctors has increased; however, Māori and Pacific peoples remain underrepresented compared to population proportions.[31] In 2024, Māori (17.1% of the New Zealand population) made up 5.2% of the doctor workforce, up from 4.3% in 2020. Pacific people (7.1% of the population) made up 2.6% of the doctor workforce, up from 2.1% in 2020. In contrast, Asian people (19.6% of the population) made up 21.9% of the doctor workforce, up from 20.0% in 2020, and European/Other (56.2% of the population) made up 70.4% of the doctor workforce, down from 73.6% in 2020.
- Gender: The proportion of women in the doctor workforce increased to 49.1% in 2024, up from 48.5% in 2023.
- Age: In 2024, the average age of the doctor workforce was 44.8 years. The largest group of doctors were those aged 30–34 years (14.4%), followed by those aged 35–39 years (13.5%).
[31] The ethnic group figures in this section use prioritised ethnicity for population and workforce percentages, where each person is counted once in a single ethnic group, unlike total response ethnicity, where individuals are counted in every group they identify with.
The number of New Zealand-based nurses per 1,000 people has increased
In 2024, there were 12.9 nurses per 1,000 people in New Zealand, up from 11.3 in 2020.
At 31 March 2024, there were 69,153 nurses with current New Zealand annual practising certificates who were working in New Zealand, an increase of 5,508 (8.7%) compared to the same time in 2023. The proportion of the New Zealand-based nursing workforce who first trained overseas has grown substantially over recent years, from 28.4% in 2020 to 37.2% in 2024.
Key demographics of the nurse population in 2023 were as follows.
- Ethnic group: New Zealand European made up the largest proportion of nurses (49%), followed by Filipino (12%), Indian (11%), other European (10%), Māori (7%) and Pacific peoples (4%) (Nursing Council of New Zealand 2024).
- Gender: Most of the nursing workforce is female (90%).
- Age: In 2024, the average age of the nurse workforce was 44.2 years. The largest group of nurses were those aged 35–39 years (20.0%), followed by those aged 30–34 years (15.1%).
Experience of care
People’s experience of care reflects their access to appropriate, timely and equitable health care; the trust and satisfaction they have in the services provided; and the quality and safety of the clinical care they receive. It is shaped not only by the outcomes of care but also by people’s experience of their treatment throughout their health care journey.
The section includes results from the recent Health New Zealand clinical quality and safety review, which examined 10 years of data (2014–2024), assessing trends over this time (Health New Zealand 2025d). It also looked at people’s experience of care, covering access, timeliness and satisfaction of services in primary care and hospital and secondary service settings.
The backdrop to the review is a period of declining trust in the health system. Data from the 2023 General Social Survey found that, for the year ending April 2024, trust New Zealand adults (aged 15 years and over) had in the health system was 6.1 out of 10 in 2023, down from 6.9 in 2018 and 7.0 in 2014 and 2016 (Stats NZ 2024i). By ethnic group, trust in the health system in 2023 was 5.7 out of 10 for Māori adults, 6.5 for Pacific adults, 6.8 for Asian adults and 6.0 for European/Other adults. Disabled adults had lower trust in the health system (5.5 out of 10) than non-disabled adults (6.2) (Stats NZ 2024j).
Clinical quality and safety
The main findings of Health New Zealand’s clinical quality and safety review were as follows.
Outcomes of health care show a mixed picture.
- Some indicators showed sustained improvement: perioperative mortality, falls, surgical site infections, in-hospital cardiac arrests, mental health inpatient services (seclusion) and inpatient experience (once services are accessed).
- Other indicators have seen improvement for a time but then regressed: for example, postoperative deep vein thrombosis/pulmonary embolus.
- Some indicators have stayed the same or deteriorated: pressure injuries, health care-associated Staphylococcus aureus bacteraemia, perinatal and maternal mortality, and patient experience of access to services.
Access to health care (primary care and secondary services) is getting worse.
- The proportion of adults who reported not accessing care from a GP due to long wait times has almost doubled in recent years.
- The number of people waiting more than four months to see a specialist tripled between 2020 and 2023.
In terms of quality and safety alerts, the review found as follows.
- Self-discharged ED patient mortality: In 2024, there was an 80% increase in Triage 2 and 3[32] patients who self-discharged from ED even though they were in imminently or potentially life-threatening condition. This likely contributed to the doubling of 30-day mortality per 100 self-discharges in 2022–2023 from the baseline period 2016–2019.
The review made international comparisons, and found as follows.
- New Zealand ranked 14th out 39 OECD countries for mortality from preventable causes and 20th for mortality from amenable (treatable) causes.
- In broad terms, New Zealand performs reasonably well internationally in terms of health care quality and safety.
[32] Triage level 2 is imminently life-threatening, or important time-critical; triage level 3 is potentially life-threatening, potential adverse outcomes from delay > 30 minutes, or severe discomfort or distress.
Primary and community health care
Primary and community health care plays a key role in preventing illness, treating disease early, reducing the impact of long-term conditions and helping people manage their health. This section covers enrolment data in primary and community health care services. It reports on common barriers to accessing primary care and provides results from primary care patient experience surveys. The section also includes information on immunisation and oral health.
Most New Zealanders access the health system through a primary health care provider, such as a general practice or a community health service.
The majority of New Zealanders are enrolled with a general practice
Enrolment with a general practice that is affiliated with a primary health organisation is voluntary. However, most New Zealanders are enrolled through their general practice. Belonging to a primary health organisation can offer benefits such as reduced costs of doctors’ visits and prescription medicines (Health New Zealand 2025g). However, enrolment does not always mean a person is able to access timely or appropriate care when needed.
As of December 2024 (counted on 1 January 2025), it was estimated that 95% of the New Zealand population was enrolled with a general practice that is affiliated with a primary health organisation (Health New Zealand 2025g). More specific figures are as follows.
- By deprivation: around 88% of people living in the areas of highest socioeconomic deprivation (quintile 5) were enrolled with a general practice (an estimated 140,000 people in this group were not enrolled). This compares to around 100% enrolment for those living in the least deprived neighbourhoods (quintile 1).
- By ethnic group (prioritised ethnicity): enrolment rates were estimated to be 85% for Māori, 99% for Pacific peoples, 89% for Asian peoples and 99% for European/Other.
Despite high enrolment, many face challenges to accessing primary care
People in New Zealand who are not enrolled with a general practice may have difficulty accessing primary care. They may struggle to access regular GP services, may face higher costs and may miss out on receiving test results, or being recalled for preventative care, such as screening and vaccinations.
Even when people are enrolled, barriers to access can impact their ability to see their GP. The Health Survey found that the most reported reason for both adults and children not visiting a GP when they had a medical problem in the past 12 months was the wait time to get an appointment. Specifically, the 2023/24 Health Survey found as follows.
- One in four adults (25.7%) and one in five children (18.5%) reported that the time taken to get an appointment was too long. These figures are higher than they were the previous year (21.2% for adults and 14.8% for children).
- Women had higher rates of unmet need due to wait time (30.0%) than men (20.9%).
- 30.2% of adults living in the most socioeconomically deprived neighbourhoods reported unmet need due to wait times, compared with 25.0% in the least deprived neighbourhoods.
- By ethnic group, the highest rates of unmet need for a GP due to wait time were for Pacific adults (38.1%) and disabled adults (32.1%) (see Table 3 in the ‘Health drivers’ section).
In New Zealand, GP visits are free for children under 14 years old in most circumstances (fees may be charged for long consultations, medical procedures and some extra services), provided a child is enrolled with a participating general practice and meets eligibility criteria for publicly funded health services (Health New Zealand 2024r).
For adults, the second most reported barrier to seeing a GP in the past 12 months was cost. In the year 2023/24, 15.5% of adults reported not seeing a GP because of the cost. This was up from 12.9% the year prior, and up from 13.6% in 2011/12.
In terms of cost, the 2023/24 Health Survey found the following:
- 25.4% of adults aged 25–34 years reported cost as a barrier: the highest proportion of any age group.
- Disabled adults were more likely to report cost as a barrier (22.3%) than non-disabled adults (14.9%).
- By ethnic group: a higher proportion of Māori adults (19.6%) and Pacific adults (22.3%) reported cost as a barrier, compared with Asian adults (15.6%) and European/Other adults (14.7%).
Other barriers to adults accessing primary care in the past 12 months, according to the Health Survey, included:
- unfilled prescription due to cost (4.4%)
- owed money to the clinic (1.8%)
- dislike or fear of the GP (2.7%)
- difficulty to take time off work (8.8%)
- no transport (3.4%)
- could not arrange childcare or care for a dependent adult (1.3%)
- didn’t have a carer, support person or interpreter (0.6%).
Patient experience survey results
The first priority of the New Zealand Health Strategy is to ensure the voice of the people shapes health services, policies and decision-making. This acknowledges that the health system exists to serve the people of New Zealand.
Patient-reported measures provide insights directly from people about their health care experience. The HQSC undertakes a series of patient experience surveys for primary care and hospital services. Its primary care survey results (HQSC 2024b) are reported below; its Inpatient care survey results are in the ‘Hospital and specialist services’ section.
Most adults report positive experiences with primary health care
The adult primary care experience survey covers aspects of primary care patient experience, including partnership, physical and emotional needs, cultural safety and access to care (HQSC 2024b). This report presents the following key findings as they reflect priorities outlined in the Government Policy Statement on Health 2024–2027 (Ministry of Health 2024c) and cover access, timeliness and quality. For the period ending November 2024, among adults aged 15 years and over, results[33] show the following.
- 95.7% reported being treated with respect and kindness by their health care professional in their most recent visit. This has been consistent for at least five years.
- 91.9% reported they were not treated unfairly at their last appointment. By ethnic group, this proportion was 88.9% among Māori, 85.4% among Pacific peoples, 86.4% among Asian peoples and 93.8% among European/Other.
- 19.5% stated that long wait times had prevented them from getting care from a GP or nurse when they wanted it.
- 30.0% of people had had to wait over a week to get an appointment; 41.2% were able to get an appointment within a week of making a booking; and 28.8% managed to get an appointment the same day or the next working day. Of these, 71.9% said they did not mind the wait, 19.0% said the wait was a bit too long and 9.1% said the wait was far too long.
- 72.5% were able to get a response to an important query the same day.
- 60.3% had heard of and used a general practice online service or patient portal.
[33] The results are weighted. Weighting adjusts for under- or over-representation in responses by age, gender and ethnic group and means the results account for differences in response rates within a local population.
Immunisation
Immunisation is a key public health strategy in New Zealand, aimed at protecting individuals and communities from vaccine-preventable diseases. The National Immunisation Schedule (Health New Zealand 2025o) lists the vaccinations offered free to babies, children, adolescents and adults. Each vaccination on the schedule is timed for the best immune response and protection; therefore, immunisation at the specified time on the schedule is recommended.
Globally, data from the WHO shows that childhood immunisations rates plateaued in the decade prior to COVID-19. The pandemic and associated disruptions further strained health systems, resulting in dramatic setbacks in immunisation coverage, compounded by rising misinformation and vaccine hesitancy (WHO 2024c).
Childhood immunisation has been decreasing over time, and the socioeconomic gap is widening
In New Zealand, the immunisation health target is that, by 2030, 95% of children are fully immunised at 24 months of age (Ministry of Health 2024e). The rate against this target for the year ended December 2024 was 76.4% (Health New Zealand 2025j).
The following graphs show that, in 2015, childhood immunisation rates in New Zealand were high (92.8%) and similar across levels of deprivation (Figure 30) and ethnic groups (Figure 31). Immunisation rates gradually declined before COVID-19, but fell more sharply during the pandemic, and gaps widened – particularly for children living in the most socioeconomically deprived neighbourhoods and for Māori children.
In terms of socioeconomic deprivation, in 2015, the fully immunised rates for children at 24 months of age were consistent across all levels of socioeconomic deprivation. At the end of December 2024, rates by deprivation quintile were as follows: 84.2% for quintile 1 (the least socioeconomically deprived), 81.4% for quintile 2, 78.8% for quintile 3, 75.5% for quintile 4 and 67.8% for quintile 5.
By ethnic group, in 2015, the fully immunised rates for children at 24 months of age were 92.3% for Māori children, 96.1% for Pacific children, 95.8% for Asian children and 91.5% for European/Other children. At the end of December 2024, these rates were 63.6% for Māori children, 70.4% for Pacific children, 83.4% for Asian children and 82.1% for European/Other children.
Figure 30: Childhood immunisation coverage at 24 months of age, by deprivation quintile, 2015–2024
Use arrow keys to navigate the key indicator items.
- Download
- Download dataset
- Source
Health New Zealand (2025j)
Figure 31: Childhood immunisation coverage at 24 months of age, by ethnic group (prioritised ethnicity), 2015–2024
Use arrow keys to navigate the key indicator items.
- Download
- Download dataset
- Source
Health New Zealand (2025j)
Human papillomavirus
Human papillomavirus (HPV) immunisation began in New Zealand in 2008 and was initially offered only to females (Health New Zealand 2025a). In 2017, it was expanded to include males. It is now offered free for everyone aged 9–26, including non-residents under the age of 18. The HPV vaccine protects against HPV, which can lead to a range of cancers later in life, including cervical cancer, head and neck cancer and cancer in other parts of the body. The vaccine is offered at most schools as part of the school-based immunisation programme. It is also available at a range of pharmacies, medical centres, hauora Māori providers and Pacific health providers (Health New Zealand 2025i).
In the year ended 30 June 2024, the coverage (final dose) of HPV immunisations had dropped from the year before (43.8% in 2024, down from 56.7% in June 2023). For those born in the 2011 cohort, the percentage immunised for HPV (final dose) by prioritised ethnic group was:
- Māori: 37.2% immunised, down from 46.9% in June 2023
- Pacific peoples: 39.7% immunised, down from 50.6% in 2023
- Asian peoples: 47.1% immunised, down from 65.6% in 2023
- European/Other: 46.6% immunised, down from 60.1% in 2023.
Older age groups have higher COVID-19 immunisation levels
In New Zealand, COVID-19 vaccination is available and free for eligible people aged five years and over and for higher-risk children from six months of age. Data to the end of December 2024 shows the percentage of people that are fully vaccinated for COVID-19 and have received at least one booster dose of a COVID-19 vaccine (Health New Zealand unpublished data):
- 87.2% of people 65 years and over
- 78.2% of people aged 50–64 years
- 60.9% of those 35–49 years
- 39.9% of people 18–34 years
- fewer than 1% of people aged under 18 years (note that most people aged under 18 years are not eligible for booster doses; only those at high risk of severe illness).
Almost half of those aged 65 and over were not immunised for influenza
The influenza (flu) virus changes often, which means the vaccine must be updated each year to best match strains known to be circulating globally. A yearly immunisation is recommended and free for those aged 65 years and over, people who are pregnant and those with eligible conditions (Health New Zealand 2024j). In 2024, influenza vaccination rates among people aged 65 years and over by ethnic group were 54.1% for Māori and Pacific peoples, 51.4% for Asian peoples and 63.4% for European/Other. These rates were similar to those in 2023.
Figure 32: Influenza vaccination rates, people aged over 65 years, by ethnic group (prioritised ethnicity), 2020–2024
Use arrow keys to navigate the key indicator items.
- Download
- Download dataset
- Source
Health New Zealand unpublished data (2025)
Oral health
Many New Zealand adults do not use dental care due to cost
In the 2023/24 Health Survey, just over three-quarters of adults (77.6%) reported their oral health was good, very good or excellent. This was down from 79.4% for the year 2017/18. Self-rated oral health differed by population group, as follows.
- People living in the most socioeconomically deprived neighbourhoods were less likely to report good, very good or excellent oral health (69.0%) than those in the least socioeconomically deprived neighbourhoods (82.6%).
- By ethnic group, 63.7% of Māori, 73.3% of Pacific peoples, 82.6% of Asian peoples and 77.2% European/Other reported good, very good or excellent oral health.
- Disabled people were less likely to report good, very good or excellent oral health (65.1%) than non-disabled people (77.6%) (Ministry of Health 2024i).
The 2023/24 Health Survey found that 44.9% of adults (aged 15+ years) had avoided going to a dental health care worker in the past 12 months due to cost, up from 40.6% in 2013/14.
Unmet need for dental care due to cost in 2023/24 differed for population groups, as follows.
- People living in the most deprived neighbourhoods had higher rates of unmet need for dental care due to cost (51.7%) than those living in the least deprived neighbourhoods (36.7%).
- More than half of all Māori (54.1%) and Pacific peoples (57.2%) reported unmet need for dental care due to cost. This compares with 46.6% of Asian peoples and 42.3% for European/Other.
- Disabled people had higher rates of unmet need for dental care due to cost (53.1%) than non-disabled people (44.1%).
Oral health care is free for children, but access and outcomes vary
In New Zealand, standard dental care is free for children and young people (until aged 18 years) (Health New Zealand nd). There are two main measures for children’s oral health:
- percentage of children who are caries-free (no dental decay)
- lifetime experience of dental decay, measured as the number of decayed, missing and filled teeth in primary teeth (called ‘dmft’) or permanent teeth (‘DMFT’).
Figure 33 shows the percentage of children who were caries-free at age five, from 2010 to 2023 (Health New Zealand 2025p). The percentage of children caries-free at age five has been largely unchanged during this time; there is sizable and persistent inequity between ethnic groups. In 2023, rates of children caries-free at age five were 40.4% for Māori children, 33.4% for Pacific children, 68.7% for non-Māori, non-Pacific children and 58.3% in total.
Figure 33: Percentage of children caries-free at age 5 years, by ethnic group (prioritised ethnicity), 2010–2023
Use arrow keys to navigate the key indicator items.
- Download
- Download dataset
- Source
Health New Zealand (2025p)
In 2024, dental conditions were the third most common reason for Māori children under five years of age to require an ambulatory sensitive hospitalisation (defined as a hospital admission for a condition that could have been treated or managed in primary or community care, preventing the hospitalisation) and the fourth most common reason for Pacific and European/Other children (Ministry of Health 2024a).
Dental health visits for children fell sharply during the COVID-19 pandemic
The total number of five-year-old children seen by oral health services declined by 25% (around 11,250 children) between 2000 and 2022. The number of children in school year eight seen declined by 9% (around 5,000 children) (EHINZ 2024).
The 2023/24 Health Survey found that fewer than half (48.7%) of children under the age of five years had seen a dental health worker in the past year. This was down from a high of 65.8% in the year 2017/18. The COVID-19 pandemic led to a significant decline in dental health care visits. Rates have recovered somewhat since, but not to pre-pandemic levels.
In the year 2023/24, of all children aged 1 to 14 years, 73.1% saw a dental health worker in the past year (Figure 34). This was down from a high of 84.3% in the year 2014/15. By ethnic group, 70.7% of Māori children, 66.4% of Pacific children, 67.9% of Asian children and 75.7% of European/Other children saw a dental worker in the past year.[34]
Figure 34: Percentage of children (aged 1–14 years) seen by a dental health worker in past 12 months, by ethnic group (total response), 2011/12–2023/24
Use arrow keys to navigate the key indicator items.
- Download
- Download dataset
- Source
Ministry of Health (2024b)
[34] Recall settings may affect this indicator: children at a low risk of decay may be recalled for dental appointments at 18-month intervals, rather than annually.
The health of permanent teeth has been improving, but the gap for Māori children is getting worse
For the measure of DMFT at year eight, Figure 35 shows that, after a period of improvement between 2010 and 2016, DMFT numbers levelled off or worsened, especially for Māori children, and that there was persistent inequity between ethnic groups (Health New Zealand 2025p).
In 2023, the mean number of DMFT at year eight was 0.74 across all children. By ethnic group, the mean DMFT was 1.14 for Māori children, compared to 0.82 for Pacific children and 0.58 for non-Māori, non-Pacific children.
Figure 35: Mean number of decayed, missing and filled teeth in permanent teeth per child at year eight, by ethnic group (prioritised ethnicity), 2010–2023
Use arrow keys to navigate the key indicator items.
- Download
- Download dataset
- Source
Health New Zealand (2025p)
Only slightly more than half of adolescents used free dental care
Oral health care is free for adolescents until they turn 18 years of age. In 2023, 66.5% of eligible adolescents used publicly funded dental services. By ethnic group, 48.7% of Māori adolescents used publicly funded dental care, compared with 66.0% of Pacific adolescents and 74.1% of European/Other adolescents. These percentages were similar in the year prior.
Hospital and specialist services
Hospital and specialist services provide essential support for individuals requiring more advanced or urgent treatment than is available in a primary care setting. This section covers planned care, emergency care and acute care, as well as specialist assessments and treatments. It also provides information on inpatient care, patient experience data from inpatient survey results and rates of ambulatory sensitive hospitalisations.
Planned care
Planned care encompasses medical and surgical care, traditionally known as elective or arranged services, delivered in hospitals or primary and community settings, for people who do not need immediate treatment (Health New Zealand 2024n). According to Health New Zealand, demand for planned care services is increasing for several reasons, including the increasing size of the ageing population and new technologies that make more types of treatments available (Health New Zealand 2024d).
The basic steps in the planned care process are:
- referral from a GP or other primary care practitioner
- a first specialist assessment
- diagnostic tests and scans
- treatment
- specialist follow up and/or return to the care of GP or other primary care practitioner.
The following health targets are in place for planned care services (by 2030).
- 95% of patients wait less than four months for a first specialist assessment.
- 95% of people given a commitment to elective treatment are treated within four months.
At the end of December 2024 (quarter two results), patients had experienced longer-than-intended waits for first specialist assessment and subsequent treatment to the following extent.
- 60.6% of patients waited less than four months for a first specialist assessment. The remaining 39.4% of patients comprised a total of 77,740 people (Health New Zealand 2025f).
- 59.2% of patients waited less than four months for elective treatment. The remaining 40.8% comprised a total of 34,615 people (Health New Zealand 2025f).
Longer waits for specialist assessment and treatment can worsen a patient’s condition, leading to avoidable suffering, reduced independence and a lower quality of life.
Figure 36 shows the proportion of patients who waited longer than four months for specialist assessment or treatments between January 2020 and December 2024. From March 2020, the COVID-19 pandemic caused disruption to many health services. Public health measures such as lockdowns and the need to reduce in-person contact led to sharp declines in non-urgent health services, including assessments and treatments. As a result, service volumes were markedly lower than they had been in previous years, leading to a rise in wait times.
Wait times for first specialist assessment generally increased through to December 2023, before stabilising. Wait times for elective treatment showed a pattern of increase to December 2022 before stabilising, with seasonal peaks and troughs through 2023 and 2024.
Figure 36: Percentage of people who waited longer than four months for specialist assessment or elective treatment, by month, 2020–2024
Use arrow keys to navigate the key indicator items.
- Download
- Download dataset
- Source
Health New Zealand (2025f)
Emergency or unplanned care
New Zealand’s emergency departments (ED) treat people who have a serious illness or injury that requires urgent attention (Health New Zealand 2024a). Emergency departments use a structured triage system to assess patients based on the urgency of their condition, ensuring that those with life-threatening illnesses or injuries receive immediate care, while others are treated in order of clinical priority.
The following health target is in place for ED services (by 2030): that 95% of patients are admitted, discharged or transferred from an ED within six hours.
At the end of December 2024 (quarter two results), ED services had met the six-hour target for 72.1% of patients. This was similar to the quarter ended December 2023 (69.7%), but down from the quarter ended December 2015 (92.4%) (Ministry of Health 2024e).
Mental health and addiction targets, including the related ‘Shorter mental health and addiction-related stays in emergency departments’ are addressed in the ‘Mental health’ section.
Emergency department visits have increased slightly ahead of population growth
The rate of ED visits (including ‘attended’ events (people who received care) and ‘did not wait’ events (people who left without receiving care)) per 1,000 people has increased a little ahead of population growth, moving from 249.6 in 2019 to 259.6 in 2024. The underlying growth will reflect population age changes and may be a marker of pressure on primary care and urgent care capacity (Health New Zealand internal report 2024).
New Zealand’s rate of ED visits is relatively low compared to that of other high-income nations. For example, the rate of ED visits in Canada is approximately 440 per 1,000 people (Duffy et al 2023). It is approximately 400 for the United States (Duffy et al 2023), approximately 370 for the United Kingdom (Hull et al 2018) and approximately 330 for Australia (Australian Institute of Health and Welfare 2025).
Figure 37 shows the rate of ED visits (including ‘attended’ and ‘did not wait’ events) per 1,000 people from 2015 to 2024. The graph shows a dip in ED visit numbers during the COVID-19 pandemic, and then a steady increase from 2021 to 2024.
Figure 37: Rate of emergency department visits per 1,000 people, 2015–2024
Use arrow keys to navigate the key indicator items.
- Download
- Download dataset
- Source
Ministry of Health unpublished data (2025)
Table 5 presents total, ‘attended’ and ‘did not wait’ ED events for the years ended December 2023 and December 2024 respectively. Numbers of ED visits in 2024 were 4.4% higher than the previous year.
| Indicator | Year ended December 2024 | Year ended December 2023 | Change (%) |
|---|---|---|---|
| Total ED events | 1,382,660 | 1,324,917 | 4.4% |
| Number of individuals | 861,078 (an average of 1.61 visits per person) | 834,170 (an average of 1.59 visits per person) | 3.2% |
| ‘Attended’ visits (people who received care) | 1,313,985 (95.0%) | 1,253,621 (94.6%) | 4.8% |
| ‘Did not wait’ events (people who left without receiving care) | 68,675 (5.0%) | 71,296 (5.4%) | -3.7% |
Source: Ministry of Health unpublished data (2025)
In 2024, the percentage of people who visited an ED and did not wait to receive care (5.0%) was slightly lower than 2023 (5.4%); this percentage has increased since 2015, when 2.1% of ED visits (23,490 people) did not wait to receive care.
Numbers of ED visits in 2024 varied by ethnic group; Māori made up 22.2% of ED visits, Pacific peoples 8.5%, Asian peoples 10.8% and European/Other (58.5%). These proportions are similar to those of the previous year (Ministry of Health unpublished data 2025).
The Health Survey provides additional insights on ED visits by finding rates for adults and children and rates by disability status, as follows.
- One in five (21.3%) children (aged 0–14 years) visited an ED at least once in in 2023/24, up from 13.6% in 2013/14.
- Rates of ED visits were highest among children aged 0–4 years (30.6% of children in this age group visited the ED at least once in 2023/24), compared with age groups 5–9 years (17.4%) and 10–14 years (17.0%).
- In 2023/24, 28.6% of disabled children visited an ED at least once, compared to 15.2% of non-disabled children.
- The Health Survey regional data release shows that, for the three-year rolling average over 2021/22–2023/24, a greater proportion of people who lived in rural areas visited an ED (19.3%), compared with those living in major urban areas (16.0%). Rates have increased for both groups since 2011/12–2013/14, when the rates were 14.2% in rural areas and 12.5% in major urban areas. Regional cities had the highest overall proportions: in regional cities, 21.1% of people visited an ED, compared with 17.7% over 2011/12–2013/14 (Ministry of Health 2025c). Evidence from administrative data supports this, indicating those living in the most remote rural communities have lower rates of ED use (University of Otago 2024).
- For adults, in the year 2023/24, ED visits in the past 12 months were highest among disabled adults (37.6%). The rate for non-disabled adults was 16.0%.
Rates of mental health and addiction-related ED visits, however, have risen more sharply
Numbers of mental health and addiction-related ED visits have also increased over time. In 2015, there were 5.0 mental health and addiction-related ED events per 1,000 people. This rate increased to 8.1 in 2021, before reducing to 7.2 in 2023 (Ministry of Health unpublished data 2025).
The number of people visiting ED for mental health and addiction-related care increased from 21,930 in 2014/15 to 38,489 in 2023/24: a 75.5% increase.
Figure 38: Rate of mental health and addiction-related ED attendances per 1,000 people, 2015–2023
Use arrow keys to navigate the key indicator items.
- Download
- Download dataset
- Source
Ministry of Health unpublished data (2025)
Inpatient care
Acute care demand is driving longer hospital stays
The term ‘bed days’ refers to the number of days a patient spends in hospital from admission to discharge. It is an important measure of efficiency, complexity in terms of patient care needs and the effectiveness of treatment and discharge planning. Hospital bed days are limited by the total number of beds available; higher numbers of acute care (unplanned and emergency) admissions reduce the availability of beds and hospital staff for planned care admissions.
Figure 39 shows average length of hospital stay by type of admission, for acute (emergency or unplanned) care, arranged care and elective services between 2015 and 2023. Over this time, bed days have slowly increased for acute admissions, bed days for arranged care have been stable and bed days for elective services have slowly decreased.
Between 2015 and 2023, trends in hospital inpatient bed day use varied across acute, arranged and elective care, as follows.
- Acute (unplanned or emergency) care: The number of total discharges for acute care increased by 22.7%, total bed days for acute care rose by 28.0% and average length of stay rose from 2.6 bed days in 2015 to 2.7 in 2023.
- Arranged care (planned hospital stays for time-bound procedures): The proportion of bed days used for arranged care decreased from 18.4% to 16.3%. The average length of stay for arranged care reduced from 2.4 bed days in 2015 to 2.1 bed days in 2023.
- Elective services (planned hospital stays for elective procedures): The proportion of bed days used for elective services decreased from 10.8% to 7.2% (Ministry of Health unpublished data 2025). The average length of stay dropped from 1.3 bed days in 2015 to 1.0 bed days in 2023.
Figure 39: Average length of stay (bed days) for acute, arranged and elective care, 2015–2023
Use arrow keys to navigate the key indicator items.
- Download
- Download dataset
- Source
Ministry of Health unpublished data (2025)
Acute (unplanned) hospital bed day use rises sharply with age (Figure 40), in terms of both admission rates and length of stay.
In 2023, 1,932,060 hospital bed days were used for acute care. People aged 80 years and over used 489,453 of the total acute bed days (25.3%). Bed day usage was lower in younger age groups, reaching its lowest in the 10–19-year age group, at just 3.2% (61,403 acute bed days). Usage increased again among children aged 0–9, who accounted for 8.1% (155,728 acute bed days).
Figure 40: Hospital bed days for acute, arranged and elective care, by age group, 2023
Use arrow keys to navigate the key indicator items.
- Download
- Download dataset
- Source
Ministry of Health unpublished data (2025)
These proportions were similar in the year before; however, the number of discharges for acute care rose by 5.4% between 2022 and 2023, from 672,475 discharges in the year ended December 2022 to 708,938 discharges in the year ended December 2023.
Most hospital inpatients report positive experiences, including cultural and personal needs being met
The HQSC undertakes a series of patient experience surveys for primary care and inpatient hospital care services. Key findings from the primary care survey appear in the ‘Primary and community health care’ section above. The hospital inpatient experience survey (HQSC 2024a) found the following, for the three-month period ending November 2024, among adults aged 15 years and over.
- 83.1% of patients reported they were as involved as much as they wanted to be in making decisions about their treatment and care.
- 88.3% reported that their cultural needs were met.
- 80.0% reported that hospital staff included their whānau or close family members in discussions about the care they received during their visit. This proportion was higher for Pacific (89.4%) and Asian patients (91.4%) than for Māori (78.3%) and European/Other patients (78.1%).
- While 91.6% knew what to expect before an operation, a lower proportion (83.2%) reported understanding how their operation had gone.
- On discharge, 75.0% of patients said they had enough information to manage their condition or recovery after discharge. This was a small increase compared to the same period last year. This proportion was higher for Pacific (90.7%) and Asian patients (88.1%) than it was for Māori (72.9%) and European/Other (72.7%).
Ambulatory sensitive hospitalisations
The measure ‘ambulatory sensitive hospitalisations’ (ASH) refers to hospital admissions that could potentially be avoided though timely and effective primary or community-based care.
The ASH measure includes two age groups: 0–4 years and 45–64 years. Figure 41 shows the rate of ASH admissions by age group and ethnic group for the period 2020–2024. For all age groups measured, rates of ASH admissions were highest for Pacific peoples, then Māori.
Figure 41: Rate of ambulatory sensitive hospitalisations per 100,000 people, by age group and ethnic group (prioritised ethnicity), 2020–2024
0 to 4 years
Use arrow keys to navigate the key indicator items.
- Download
- Download dataset
- Source
Health New Zealand unpublished data (2025)
45 to 64 years
Use arrow keys to navigate the key indicator items.
- Download
- Download dataset
- Source
Health New Zealand unpublished data (2025)
The top five conditions contributing to ASH admissions for the year ended June 2024 (Ministry of Health 2024a) for children aged zero to four years were:
- asthma (5,593 admissions)
- upper and ear, nose and throat respiratory infections (4,872 admissions)
- gastroenteritis/dehydration (3,679 admissions)
- dental conditions (2,375 admissions)
- lower respiratory infections (1,497 admissions).
For adults aged 45–64 years, the top five conditions were:
- angina and chest pain (13,004 admissions)
- cellulitis (4,735 admissions)
- myocardial infarction (heart attack) (3,696 admissions)
- gastroenteritis/dehydration (3,665 admissions)
- pneumonia (3,246 admissions).
Looking ahead Te tiro whakamua
The Health and Independence Report 2024 paints a picture of a health system in which services are in demand but not always timely or accessible. It also highlights notable progress in some areas, such as rates of smoking and hazardous drinking, and provides invaluable insight as to where the greatest opportunities lie and where we can target our efforts, to have the greatest positive impact on the health of New Zealanders.
Maintaining a focus on the Government’s health targets and effectively delivering the basics of a well-functioning health system will support positive progress over the next 12 months. This focus – combined with robust monitoring of activities and health outcomes, support for innovation and the adoption of new technologies – will help us ensure the health system is well positioned to meet complex, long-term challenges.
Through targeted spend of the notable investment made in the health system, we will implement initiatives that respond to need, continue our work to establish innovative and enduring infrastructure, continue to grow the health workforce and improve overall productivity. This will make a real difference to how New Zealanders interact with and experience the health system. It will also position the system to respond to changing demographic trends, corresponding shifts in needs and increasing costs.
The Ministry is currently working to enhance primary care pathways for New Zealanders. Our aim is for people to be able to see their GPs more easily and receive more timely primary care services. Additionally, we remain committed to improving wait times for specialist and elective care, lifting immunisation rates and reducing pressures for emergency and acute care services.
The Ministry will continue to engage with the wider sector and with communities to understand needs, and will use data, analysis and clinical expertise to develop policies and interventions that effectively respond to them. We will actively participate in efforts to implement dynamic and deliberate cross-sector approaches to address the impact socioeconomic and environmental factors have on population health outcomes.
New Zealand’s health system, like others around the world, is complex, and it faces significant challenges. However, behind every statistic presented in this report are real people – individuals whose lives, wellbeing and futures depend on the accessibility and effectiveness of the service the system delivers. Through bold, focused action – extending across service delivery, infrastructure and broader influences on health outcomes – we have the potential to build a more productive, accessible and sustainable health system: one that not only meets today’s demands but proactively responds to shifting needs, to improve outcomes for future New Zealanders.
Technical notes Ngā puna raraunga
This report contains data from a range of sources; some of them outside the Ministry of Health. This data is accessible through hyperlinks to sources, where available, and for download for each chart using the online version of the report. The Health and Independence Report aims to include data only from sources with robust data collection and analytical processes. If the methodology of a source affects the interpretation of the data, we alert readers to this with a note. We encourage readers to refer to the original data source for further details.
All data presented here is the latest available at the time of developing this report, from January to May 2025. The time lag between the most recent data and the present day can be substantial.
Ethnic groups
Ethnic group comparisons are based on either prioritised ethnicity or total response ethnicity. Prioritised ethnicity means that ethnic groups are mutually exclusive: that is, a person can appear in only one ethnic group. If they identify with more than one group, the group chosen for analysis is generally prioritised in the following order: Māori, Pacific peoples, Asian, European/Other (which includes MELAA). Total response ethnicity means that a person is classified in all of the ethnic groups they identify with. This means that a person can appear in more than one ethnic group. For more information see the Ethnicity Data Protocols HISO 10001:2017 (Health New Zealand 2017). Prioritised ethnicity is often used for analyses based on administrative data (data collected for purposes other than statistics), such as mortality data. Health Survey data uses total response ethnicity.
Life expectancy
There are multiple methods for calculating life expectancy, which can lead to variations in estimates. Slight differences in population estimates, such as those derived from different census data or demographic models, can influence the results. As noted above, the way of handling ethnicity also varies: some calculations may use total response ethnicity, while others use prioritised ethnicity. These methodological differences mean that the life expectancy estimates in this report may differ from those reported elsewhere.
Standardisation
Where possible, this report presents statistically significant differences between population groups and any relevant trends over time. In many comparisons, the results have been adjusted or standardised for factors that may influence (confound) the comparison, such as age and gender. This report often uses the World Health Organization (WHO) standard world population as the standard population, to account for differences in age structure between population groups and over time.
Definition of disability
Disability data used in this report comes from different sources, which use slightly different definitions.
In surveys that identify disabled people, the responses provided to a particular set of questions are used to distinguish between disabled and non-disabled people in that survey. These are referred to in the Household Disability Survey as ’screening questions’.
The Household Disability Survey usesthe Washington Group Extended Set on Functioning for adults and the Washington Group / UNICEF Child Functioning Module for children, with additional questions added by Stats NZ. This takes a functional approach that measures one aspect of the International Classification of Functioning, Disability and Health, which conceptualises a person’s level of functioning as a dynamic interaction between their health conditions, environmental factors and personal factors (Stats NZ 2025e).
The Health Survey uses the Washington Group Short Set question set to identify adults with a disability. Under this approach, disabled adults are identified as those who answer either ‘a lot of difficulty’ or ‘cannot do at all’ to questions about seeing or hearing (even with glasses or hearing aids), walking or climbing stairs, remembering or concentrating, self-caring or communicating (Ministry of Health 2024h).
The Washington Group Short Set should not be used to produce estimates of disability prevalence or to investigate levels of need for services or environmental change. To meet these and other data needs, a disability-specific survey, with a more extensive question set, is required. The population identified as disabled using the Washington Group Short Set is considerably smaller than the population identified by disability-specific surveys. One of the limitations is that the Washington Group Short Set questions do not fully capture mental health impairments.
Under the Child Functioning Module, disabled children are those who answer either that they have ‘a lot of difficulty’ or ‘cannot do at all’ to questions about seeing or hearing (even with glasses or hearing aids), walking, self-care, communicating, learning, remembering, concentrating, accepting change and controlling their own behaviour or making friends, and those who have anxiety or depression.
References Ngā tohutoro
Australian Institute of Health and Welfare. 2025. Emergency department care. URL: aihw.gov.au/hospitals/topics/emergency-departments (accessed 24 June 2025).
Duffy J, Jones P, McNaughton CD, et al. 2023. Emergency department utilization, admissions, and revisits in the United States (New York), Canada (Ontario), and New Zealand: a retrospective cross‐sectional analysis. Academic Emergency Medicine 30(9): 946–54.
EHINZ. 2024. Oral health of children. URL: ehinz.ac.nz/indicators/water/drinking-water-quality/oral-health-of-children (accessed 4 August 2025).
EHINZ. (nd)-a. About the indoor environment and health. URL: ehinz.ac.nz/indicators/indoor-environment/about-the-indoor-environment-and-health (accessed 4 August 2025).
EHINZ. (nd)-b. Household crowding. URL: ehinz.ac.nz/indicators/indoor-environment/household-crowding (accessed 11 April 2025).
ESR. 2025a. Invasive Meningococcal Disease Monthly Report December 2024. Porirua: Institute of Environmental Science and Research.
ESR. 2025b. Pertussis dashboard. URL: www.esr.cri.nz/digital-library/pertussis-dashboard (accessed 11 April 2025).
GBD. 2021. Burden of disease scenarios for 204 countries and territories, 2022–2050: a forecasting analysis for the Global Burden of Disease Study 2021. The Lancet 403(10440): 2204–56.
GBD. 2025a. Global, regional, and national prevalence of adult overweight and obesity, 1990–2021, with forecasts to 2050: a forecasting study for the Global Burden of Disease Study 2021. The Lancet 405(10481): 813–38.
GBD. 2025b. Global, regional, and national prevalence of child and adolescent overweight and obesity, 1990–2021, with forecasts to 2050: a forecasting study for the Global Burden of Disease Study 2021. The Lancet 405(10399): 785–812.
Gurney J, Stanley, J, Sarfati, D. 2020. The inequity of morbidity: Disparities in the prevalence of morbidity between ethnic groups in New Zealand. Journal of Multimorbidity and Comorbidity 10: 1-11.
Harris R, Cormack, D, Tobias, M. 2012. The pervasive effects of racism: experiences of racial discrimination in New Zealand over time and associations with multiple health domains. Social Science and Medicine 13(1): 408–15.
Health New Zealand. 2017. Ethnicity Data Protocols: HISO 10001:2017. Wellington: Ministry of Health.
Health New Zealand. 2023. Virtual Diabetes Register: Technical Guide. URL: tewhatuora.govt.nz/publications/virtual-diabetes-register-technical-guide (accessed 3 March 2025).
Health New Zealand. 2024a. About emergency departments. URL: tewhatuora.govt.nz/health-services-and-programmes/hospitals-and-specialist-services/emergency-departments/about-emergency-departments (accessed 17 June 2025).
Health New Zealand. 2024b. About rheumatic fever. URL: tewhatuora.govt.nz/for-health-professionals/clinical-guidance/diseases-and-conditions/rheumatic-fever-guidance/about (accessed 11 April 2025).
Health New Zealand. 2024c. About the health reforms. URL: tewhatuora.govt.nz/corporate-information/our-health-system/organisational-overview/about-the-health-reforms (accessed 11 April 2025).
Health New Zealand. 2024d. About the Planned Care programme. URL: tewhatuora.govt.nz/health-services-and-programmes/planned-care-services/about-the-planned-care-programme (accessed 11 April 2025).
Health New Zealand. 2024e. Aged Care Funding and Service Models Review. URL: tewhatuora.govt.nz/for-health-professionals/clinical-guidance/specific-life-stage-health-information/health-of-older-people/aged-care-funding-and-service-models-review (accessed 17 June 2025).
Health New Zealand. 2024f. Cancer web tool [Data file]. URL: tewhatuora.shinyapps.io/cancer-web-tool (accessed 3 March 2025).
Health New Zealand. 2024g. Chronic kidney disease. URL: info.health.nz/conditions-treatments/bladder-kidney-and-urinary-system/chronic-kidney-disease (accessed 6 June 2025).
Health New Zealand. 2024h. DHB spending on services for older people. URL: tewhatuora.govt.nz/for-health-professionals/data-and-statistics/older-peoples-health/dhb-spending-on-services-for-older-people (accessed 11 April 2025).
Health New Zealand. 2024i. Eating and activity guidelines. URL: tewhatuora.govt.nz/health-services-and-programmes/nutrition/eating-and-activity-guidelines (accessed 26 June 2025).
Health New Zealand. 2024j. Flu (influenza) vaccine. URL: info.health.nz/immunisations/vaccines-aotearoa/flu-vaccine (accessed 17 June 2025).
Health New Zealand. 2024k. Life Expectancy in Aotearoa New Zealand. Wellington: Health New Zealand.
Health New Zealand. 2024l. Life Expectancy in Aotearoa New Zealand: An Analysis of Socioeconomic, Geographic, Sex and Ethnic Variation from 2001 to 2022.
Health New Zealand. 2024m. Meningococcal disease. URL: info.health.nz/conditions-treatments/infectious-diseases/meningococcal-disease (accessed 11 April 2025).
Health New Zealand. 2024n. Planned Care services. URL: tewhatuora.govt.nz/health-services-and-programmes/planned-care-services (accessed 17 June 2025).
Health New Zealand. 2024o. Reducing rheumatic fever. URL: tewhatuora.govt.nz/for-health-professionals/clinical-guidance/diseases-and-conditions/rheumatic-fever-guidance/reducing-rheumatic-fever (accessed 1 June 2025).
Health New Zealand. 2024p. Suicide data web tool. URL: tewhatuora.shinyapps.io/suicide-web-tool (accessed 11 April 2025).
Health New Zealand. 2024q. Type 2 diabetes. URL: info.health.nz/conditions-treatments/diabetes/type-2-diabetes (accessed 11 April 2025).
Health New Zealand. 2024r. Zero fees for tamariki under 14. URL: info.health.nz/services-support/publicly-funded-health-and-disability-services/zero-fees-for-under-14s (accessed 1 May 2025).
Health New Zealand. 2025a. Appendix 1: The history of immunisation in New Zealand. URL: tewhatuora.govt.nz/for-health-professionals/clinical-guidance/immunisation-handbook/appendix-1-the-history-of-immunisation-in-new-zealand (accessed 1 February 2025).
Health New Zealand. 2025b. BreastScreen Aotearoa Coverage Report. URL: tewhatuora.shinyapps.io/nsu-bsa-coverage (accessed 11 April 2025).
Health New Zealand. 2025c. Cancer screening. URL: info.health.nz/keeping-healthy/cancer-screening (accessed 28 March 2025).
Health New Zealand. 2025d. Clinical quality and safety review: longitudinal data. URL: tewhatuora.govt.nz/publications/clinical-quality-and-safety-review-longitudinal-data (accessed 11 April 2025).
Health New Zealand. 2025e. Eating and activity guidelines. URL: tewhatuora.govt.nz/health-services-and-programmes/nutrition/eating-and-activity-guidelines (accessed 11 April 2025).
Health New Zealand. 2025f. Elective Services Patient Flow Indicators Web Tool. URL: tewhatuora.shinyapps.io/ESPI_app (accessed 28 February 2025).
Health New Zealand. 2025g. Enrolment with a general practice and primary health organisation. URL: tewhatuora.govt.nz/for-health-providers/primary-care-sector/primary-health-organisations/enrolment-with-a-general-practice-and-primary-health-organisation (accessed 11 April 2025).
Health New Zealand. 2025h. Health targets performance. URL: tewhatuora.govt.nz/corporate-information/planning-and-performance/health-targets/health-targets/performance (accessed 11 April 2025).
Health New Zealand. 2025i. HPV immunisation programme. URL: tewhatuora.govt.nz/health-services-and-programmes/vaccine-information/hpv-immunisation-programme (accessed 11 April 2025).
Health New Zealand. 2025j. Immunisation coverage. URL: tewhatuora.govt.nz/health-services-and-programmes/vaccine-information/immunisation-coverage (accessed 11 April 2025).
Health New Zealand. 2025k. Mental health and addiction targets. URL: tewhatuora.govt.nz/assets/Corporate-information/Planning-and-performance/Health-targets/Mental-health-and-addiction-targets/Quarter-Two-2024-25/Mental-health-target-results-factsheets.pdf (accessed 1 April 2025).
Health New Zealand. 2025l. Mortality web tool. URL: tewhatuora.shinyapps.io/mortality-web-tool (accessed 3 March 2025).
Health New Zealand. 2025m. National Bowel Screening Programme interactive participation data tool. URL: tewhatuora.shinyapps.io/nphs-nbsp (accessed 11 April 2025).
Health New Zealand. 2025n. National Cervical Screening Programme Coverage Report. URL: tewhatuora.shinyapps.io/nsu-ncsp-coverage (accessed 10 March 2025).
Health New Zealand. 2025o. National Immunisation Schedule - Wātaka Tuku Awhikiri ā-Motu. URL: info.health.nz/immunisations/national-immunisation-schedule (accessed 12 March 2025).
Health New Zealand. 2025p. Oral health data and statistics Age 5 and Year 8 data. URL: tewhatuora.govt.nz/for-health-professionals/data-and-statistics/oral-health/age-5-and-year-8-data (accessed 19 March 2025).
Health New Zealand. 2025q. Our position on vaping. URL: https://vapingfacts.health.nz/our-position-on-vaping.html (accessed 11 April 2025).
Health New Zealand. 2025r. Pertussis (whooping cough). URL: tewhatuora.govt.nz/for-health-professionals/clinical-guidance/immunisation-handbook/16-pertussis-whooping-cough#key-information (accessed 28 February 2025).
Health New Zealand. 2025s. Populations web tool, based on customised population projections provided by Stats NZ. URL: tewhatuora.shinyapps.io/populations-web-tool (accessed 30 April 2025).
Health New Zealand. 2025t. Virtual diabetes web tool. URL: tewhatuora.shinyapps.io/virtual-diabetes-register-web-tool (accessed 3 June 2025).
Health New Zealand. (nd). Dental care. URL: info.health.nz/services-support/dental-care (accessed 17/06/2025).
Health New Zealand internal report. 2024. A brief review of emergency department presentations in Aotearoa New Zealand (2008/09–2023/24).
Health Research Council. (nd). Saving lives through healthier housing. URL: hrc.govt.nz/making-a-difference/impact-stories/saving-lives-through-healthier-housing (accessed 11 April 2025).
HQSC. 2024a. Aotearoa New Zealand patient experience survey: Adult hospital inpatient experience explorer. URL: reports.hqsc.govt.nz/AHI-explorer (accessed 1 June 2025).
HQSC. 2024b. Aotearoa New Zealand patient experience survey: Adult primary care patient experience explorer. URL: reports.hqsc.govt.nz/APC-explorer (accessed 1 June 2025).
HQSC. 2024c. Chronic Obstructive Pulmonary Disease in people aged 45 and over. URL: hqsc.govt.nz/our-data/atlas-of-healthcare-variation/chronic-obstructive-pulmonary-disease (accessed 1 April 2025).
HQSC. 2024d. Sixteenth Annual Report of the Perinatal and Maternal Mortality Review Committee – Te Pūrongo ā-Tau Tekau mā Ono o te Komiti Arotake Mate Pēpi, Mate Whaea Hoki. URL: hqsc.govt.nz/resources/resource-library/sixteenth-annual-report-of-the-perinatal-and-maternal-mortality-review-committee-te-purongo-a-tau-tekau-ma-ono-o-te-komiti-arotake-mate-pepi-mate-whaea-hoki (accessed 11 April 2025).
Hull SA, Homer K, Boomla K, et al. 2018. Population and patient factors affecting emergency department attendance in London: retrospective cohort analysis of linked primary and secondary care records. British Journal of General Practice 68(668): e157-e67.
IHC. 2023. From Data to Dignity: Health and Wellbeing Indicators for New Zealanders with Intellectual Disability. Wellington: IHC.
IHC. 2025. What is an intellectual disability? URL: ihc.org.nz/about-intellectual-disability/intellectual-disability (accessed 11 April 2025).
Institute for Health Metrics and Evaluation. 2021. GHDx (healthdata.org): GBD results tool. URL: ghdx.healthdata.org/gbd-results-tool (accessed 10 April 2025).
Institute for Health Metrics and Evaluation. 2024. GBD Results. URL: vizhub.healthdata.org/gbd-results (accessed 11 April 2025).
Institute of Environmental Science and Research. 2025. STI quarterly dashboard. URL: www.esr.cri.nz/digital-library/sti-quarterly-dashboard (accessed 11 April 2025).
Ministry of Health. 2019. Household Food Insecurity among Children: New Zealand Health Survey - Summary of Findings. Wellington: Ministry of Health.
Ministry of Health. 2020. New Zealand Cancer Action Plan 2019-2029. Wellington: Ministry of Health.
Ministry of Health. 2021. The New Zealand Guidelines for Helping People to Stop Smoking: 2021 Update. Wellington: Ministry of Health.
Ministry of Health. 2023a. Ngā Pokenga Paipai Me Ngā Pokenga Huaketo Mā Te Toto: Te Rautaki o Aotearoa 2023–2030 | Aotearoa New Zealand Sexually Transmitted and Blood Borne Infection Strategy 2023–2030. Wellington: Ministry of Health.
Ministry of Health. 2023b. Racial Discrimination 2011/12, 2016/17 and 2020/21: New Zealand Health Survey. Wellington: Ministry of Health.
Ministry of Health. 2023c. Rural Health Strategy 2023. Wellington: Ministry of Health.
Ministry of Health. 2024a. Ambulatory sensitive hospital admissions (ASH). URL: health.govt.nz/statistics-research/system-monitoring/planning-and-performance-data/ambulatory-sensitive-hospital-admissions-ash (accessed 11 April 2025).
Ministry of Health. 2024b. Annual Data Explorer 2023/24: New Zealand Health Survey [Data File]. URL: minhealthnz.shinyapps.io/nz-health-survey-2023-24-annual-data-explorer (accessed 21 May 2025).
Ministry of Health. 2024c. Government Policy Statement on Health 2024 – 2027. Wellington: Ministry of Health.
Ministry of Health. 2024d. Growing risk of antimicrobial resistance infection in New Zealand. URL: health.govt.nz/news/growing-risk-of-antimicrobial-resistance-infection-in-new-zealand (accessed 13 March 2025).
Ministry of Health. 2024e. Health targets. URL: health.govt.nz/statistics-research/system-monitoring/health-targets (accessed 11 April 2025).
Ministry of Health. 2024f. Long COVID Programme. URL: health.govt.nz/our-work/diseases-and-conditions/covid-19-novel-coronavirus/covid-19-response-planning/long-covid-programme (accessed 11 April 2025).
Ministry of Health. 2024g. Mental health and addiction targets. URL: health.govt.nz/statistics-research/system-monitoring/health-targets (accessed 11 April 2025).
Ministry of Health. 2024h. Methodology Report 2023/24: New Zealand Health Survey. URL: health.govt.nz/publications/methodology-report-202324-new-zealand-health-survey (accessed 11 March 2025).
Ministry of Health. 2024i. New Zealand Health Survey. URL: health.govt.nz/statistics-research/surveys (accessed 28 May 2025).
Ministry of Health. 2024j. Trends in smoking and vaping: New Zealand Health Survey. URL: health.govt.nz/statistics-research/surveys/new-zealand-health-survey/publications/202324-survey-publications/trends-in-smoking-and-vaping (accessed 11 April 2025).
Ministry of Health. 2025a. New Zealand COVID data. URL: github.com/minhealthnz/nz-covid-data/blob/main/cases/weekly-hospitalisations-for-covid.csv (accessed 11 April 2025).
Ministry of Health. 2025b. Obesity in New Zealand. URL: health.govt.nz/strategies-initiatives/programmes-and-initiatives/obesity (accessed 11 April 2025).
Ministry of Health. 2025c. Regional Data Release 2011/12–2023/24: New Zealand Health Survey. URL: health.govt.nz/publications/regional-data-release-201112-202324-new-zealand-health-survey (accessed 27 May 2025).
Ministry of Social Development. 2024. The Child and Youth Strategy 2024-2027. Wellington: Ministry of Social Development.
Nargund G. 2009. Declining birth rate in Developed Countries: A radical policy re-think is required. Facts, Views and Vision in ObGyn 1(3): 191–3.
Neumann D, Yao E, Fenaughty J, et al. 2023. Now we are 12: Ethnic and Gender identity. Auckland: Growing up in New Zealand.
Nursing Council of New Zealand. 2024. Te Ohu Mahi Tapuhi o Aotearoa - The New Zealand Nursing Workforce. Wellington: Nursing Council of New Zealand.
OECD. 2024. Indicators: Infant mortality rates. URL: oecd.org/en/data/indicators/infant-mortality-rates.html (accessed 11 April 2025).
OECD. 2025a. Indicators: Alcohol consumption. URL: oecd.org/en/data/indicators/alcohol-consumption.html (accessed 11 April 2025).
OECD. 2025b. Old-age dependency ratio. URL: oecd.org/en/data/indicators/old-age-dependency-ratio.html (accessed 11 April 2025).
Pharmac. 2024. Prioritisation: How we decide which medicines need funding first. URL: www.pharmac.govt.nz/medicine-funding-and-supply/the-funding-process/prioritisation (accessed 11 April 2025).
Pharmac. 2025. Year in Review 2024. Wellington: Pharmac.
Stanley J, Semper K, Millar E, et al. 2018. Epidemiology of multimorbidity in New Zealand: a cross-sectional study using national-level hospital and pharmaceutical data. BMJ Open 8(5).
Stats NZ. 2020. Unemployed people less satisfied with life. URL: stats.govt.nz/news/unemployed-people-less-satisfied-with-life (accessed 4 August 2025).
Stats NZ. 2021. National and subnational period life tables: 2017–2019. URL: stats.govt.nz/information-releases/national-and-subnational-period-life-tables-2017-2019 (accessed 11 April 2025).
Stats NZ. 2024a. 2023 Census population counts (by ethnic group, age, and Māori descent) and dwelling counts. URL: stats.govt.nz/information-releases/2023-census-population-counts-by-ethnic-group-age-and-maori-descent-and-dwelling-counts (accessed 11 April 2025).
Stats NZ. 2024b. 2023 Census severe housing deprivation (homelessness) estimates. URL: stats.govt.nz/information-releases/2023-census-severe-housing-deprivation-homelessness-estimates (accessed 11 April 2025).
Stats NZ. 2024c. Census results reflect Aotearoa New Zealand’s diversity. URL: stats.govt.nz/news/census-results-reflect-aotearoa-new-zealands-diversity (accessed 11 March 2025).
Stats NZ. 2024d. Indicators Aotearoa New Zealand. URL: statisticsnz.shinyapps.io/wellbeingindicators (accessed 11 April 2025).
Stats NZ. 2024e. More than 100,000 crowded households in New Zealand. URL: stats.govt.nz/news/more-than-100000-crowded-households-in-new-zealand (accessed 13 June 2025).
Stats NZ. 2024f. National ethnic population projections, by age and sex, 2018(base)–2043. URL: nzdotstat.stats.govt.nz/wbos/Index.aspx (accessed 11 April 2025).
Stats NZ. 2024g. National population estimates: At 31 December 2024. URL: stats.govt.nz/information-releases/national-population-estimates-at-31-december-2024-2018-base (accessed 11 April 2025).
Stats NZ. 2024h. New Zealand index of socioeconomic deprivation, birthplace, ethnicity, age, and gender for the census usually resident population count, (RC, TALB, Health), 2023 Census. URL: stats.govt.nz/information-releases/new-zealand-index-of-socioeconomic-deprivation-2023-census (accessed 14 June 2025).
Stats NZ. 2024i. New Zealanders’ trust in key institutions declines. URL: stats.govt.nz/news/new-zealanders-trust-in-key-institutions-declines (accessed 11 April 2025).
Stats NZ. 2024j. Wellbeing statistics: 2023 (updated). URL: stats.govt.nz/information-releases/wellbeing-statistics-2023 (accessed 11 April 2025).
Stats NZ. 2025a. Aotearoa Data Explorer. URL: stats.govt.nz/tools/aotearoa-data-explorer (accessed 25 June 2025).
Stats NZ. 2025b. Births and deaths: Year ended December 2024 (including abridged period life table). URL: stats.govt.nz/information-releases/births-and-deaths-year-ended-december-2024-including-abridged-period-life-table (accessed 11 March 2025).
Stats NZ. 2025c. Child poverty statistics: Year ended June 2024. URL: stats.govt.nz/information-releases/child-poverty-statistics-year-ended-june-2024 (accessed 13 June 2025).
Stats NZ. 2025d. Disability statistics: 2023. URL: stats.govt.nz/information-releases/disability-statistics-2023 (accessed 3 March 2025).
Stats NZ. 2025e. Household Disability Survey 2023 – findings, definitions, and design summary. Wellington: Stats NZ.
Stats NZ. 2025f. Household income and housing-cost statistics: Year ended June 2024. URL: stats.govt.nz/information-releases/household-income-and-housing-cost-statistics-year-ended-june-2024 (accessed 11 April 2025).
Stats NZ. 2025g. Housing costs continue to put pressure on households in year to June 2024. URL: stats.govt.nz/news/housing-costs-continue-to-put-pressure-on-households-in-year-to-june-2024 (accessed 11 April 2025).
Stats NZ. 2025h. Infoshare: Labour Force Status by Sex by Total Response Ethnic Group (Annual-Dec). URL: infoshare.stats.govt.nz (accessed 22 May 2025).
Stats NZ. 2025i. International migration: December 2024. URL: stats.govt.nz/information-releases/international-migration-december-2024 (accessed 11 April 2025).
Stats NZ. 2025j. Labour market statistics: December 2024 quarter. URL: stats.govt.nz/information-releases/labour-market-statistics-december-2024-quarter (accessed 13 June 2025).
Stats NZ. 2025k. Life expectancy. URL: stats.govt.nz/topics/life-expectancy (accessed 26 June 2025).
Stats NZ. 2025l. Net migration falls in 2024. URL: stats.govt.nz/news/net-migration-falls-in-2024 (accessed 28 February 2025).
Stats NZ. 2025m. Wellbeing data for New Zealanders - Experience of discrimination. URL: statisticsnz.shinyapps.io/wellbeingindicators (accessed 11 April 2025).
Stroke Aotearoa New Zealand. 2025. Statistics & data. URL: stroke.org.nz/understanding-stroke/statistics-data (accessed 11 April 2025).
Te Aho o Te Kahu – Cancer Control Agency. 2022. Pūrongo Ārai Mate Pukupuku: Cancer Prevention Report Wellington: Te Aho o Te Kahu – Cancer Control Agency.
Te Aho o Te Kahu – Cancer Control Agency. 2024. Quality Improvement Monitoring Report – Route to diagnosis: People diagnosed with cancer within 30 days of an emergency or acute (unplanned) hospital admission. Wellington: Te Aho o Te Kahu – Cancer Control Agency.
Teng A, Stanley J, Jackson C, et al. 2024. The growing cancer burden: Age-period-cohort projections in Aotearoa New Zealand 2020-2044. Cancer Epidemiology 89(102535).
The Treasury. 2025. Budget Economic and Fiscal Update 2025. URL: treasury.govt.nz/publications/efu/budget-economic-and-fiscal-update-2025 (accessed 20 April 2025).
University of Auckland. 2024a. Growing up in New Zealand - Housing and homelessness. URL: growingup.co.nz/growing-up-report/housing-and-homelessness (accessed 11 April 2025).
University of Auckland. 2024b. Growing up in New Zealand - Key findings. URL: growingup.co.nz/key-findings-0 (accessed 11 April 2025).
University of Otago. 2024. Rural–urban variation in the utilisation of publicly funded healthcare services: an age-stratified population-level observational study. New Zealand Medical Journal 137(1590).
University of Otago. 2025. AIDS – New Zealand newsletters. URL: otago.ac.nz/hiv-epidemiology/newsletters (accessed 11 April 2025).
University of Otago. (nd). About the Geographical Classification for Health. URL: rhrn.nz/gch/about-gch (accessed 25 June 2025).
Victoria University of Wellington – Te Herenga Waka. 2025. Long COVID Collective. URL: wgtn.ac.nz/health/centres/health-services-research-centre/recent-projects/long-covid-collective (accessed 11 April 2025).
Whaikaha. 2023. Labour market statistics (disability) as at the June 2022 quarter. URL: whaikaha.govt.nz/news/news/labour-market-statistics-disability-as-at-the-june-2022-quarter (accessed 13 June 2025).
Whaikaha. 2024. Labour market statistics for disabled people - June 2024 quarter. URL: whaikaha.govt.nz/news/news/labour-market-statistics-for-disabled-people-june-2024-quarter (accessed 11 April 2025).
WHO. 2013. Framework for verifying elimination of measles and rubella. URL: who.int/publications/i/item/framework-for-verifying-elimination-of-measles-and-rubella (accessed 11 April 2025).
WHO. 2018. Housing impacts health: new WHO guidelines on housing and health. URL: who.int/news/item/26-11-2018-housing-impacts-health-new-who-guidelines-on-housing-and-health (accessed 11 April 2025).
WHO. 2022a. Global status report on physical activity 2022. Geneva: World Health Organization.
WHO. 2022b. Mental health. URL: who.int/news-room/fact-sheets/detail/mental-health-strengthening-our-response (accessed 11 April 2025).
WHO. 2024a. Cervical cancer. URL: who.int/news-room/fact-sheets/detail/cervical-cancer (accessed 11 April 2025).
WHO. 2024b. GHE: Life expectancy and healthy life expectancy. URL: who.int/data/gho/data/themes/mortality-and-global-health-estimates/ghe-life-expectancy-and-healthy-life-expectancy (accessed 11 April 2025).
WHO. 2024c. Immunization coverage. URL: who.int/news-room/fact-sheets/detail/immunization-coverage (accessed 11 March 2025).
WHO. 2025. Social determinants of health. URL: who.int/health-topics/social-determinants-of-health (accessed 22 April 2025).
WHO. (nd). Chronic respiratory diseases. URL: who.int/health-topics/chronic-respiratory-diseases (accessed 4 August 2025).
World Bank. 2025. World Development Indicators. URL: databank.worldbank.org/reports.aspx?dsid=2&series=SH.PRV.SMOK (accessed 11 April 2025).
World Bank. 2024. Life expectancy at birth. URL: data.worldbank.org/indicator/SP.DYN.LE00.IN (accessed 22 April 2025).
Publishing information
- Copyright status
-
Owned by the Ministry of Health and licensed for reuse under a Creative Commons Attribution 4.0 International Licence.