

Foreword
Tēnā koutou
It is now 27 years since the National Health Committee (NHC) published its landmark report on 'The Social, Cultural and Economic Determinants of Health in New Zealand'. That report set out how most of health status is the result of factors outside health care. The 'building blocks' or determinants of good health sit across many of the silos we have established for Government policy and action. Nearly all are unevenly distributed, but the pattern of uneven distribution is consistent across them all, resulting in some population groups being consistently advantaged and others consistently disadvantaged, with resulting profound inequalities of health status.
I joined the NHC, and its sub-committee the Public Health Advisory Committee, shortly after the report was published. It was clear that the report had struck a chord. It was widely read and referenced, and our two committees were able to continue our investigation into the upstream factors driving patterns of health and illness.
Both of those committees are now long gone, but the Pae Ora Act 2022 created a new Public Health Advisory Committee, which I have had the honour and pleasure of chairing. It seemed timely to revisit these building blocks: are the factors identified by the NHC still driving health status? Are there new factors for us to take into account? How good a job have we collectively done of using the knowledge and tools developed a quarter of a century ago to improve health outcomes - and equity of outcomes? Above all: how can we do better?
This report should be a sobering one. It paints a mixed picture: there have been some improvements and glimpses of what is possible, though these have mostly been isolated and not translated into systemic improvement. The building blocks identified in 1998 remain the same, though some new factors are emerging that will likely have profound impacts on health status in the future. Despite what we know about what drives health status (and wellbeing outcomes in other sectors too), our responses have been too weak and fragmented to overcome institutional inertia and enable an effective response.
Yet against this gloomy picture positive options still exist. We can build on areas that have been making progress, and we can learn from those that have failed to make a difference. For me three critical lessons emerge. First, we need to understand that while our concern has been the building blocks of health status, these are the same factors that are the upstream drivers of every other aspect of wellbeing; addressing them will achieve positive outcomes across the whole range.
Secondly, creating effective government actions that are not hostage to sectoral silos will require clear and enduring commitment and direction from Ministers and chief executives, or else 'business as usual' will reassert itself. Thirdly, while it is the Government's job to create the environment for success through good policy settings and funding, successful programmes of action will be designed and implemented by iwi and hapū and by communities themselves. We need to trust and resource that process.
Ngā mihi
Kevin Hague
Chair
Public Health Advisory Committee Members
- Kevin Hague (Chair)
- Beverly Te Huia
- Professor Jason Gurney
- Associate Professor Ruth Cunningham
- Professor Peter Crampton
- Dr Caroline McElnay
- Faumuina Professor Fa’afetai Sopoaga
He mihi
Tēnā anō rā tātou katoa.
Tēnā anō hoki tātou i a rātou kua ngaro nei i te tirohanga kanohi, rātou i para i te ara e takahia nei e ngā uri whakaheke o te wā nei.
E mihi ana rā ki tā rātou i waiho mai ai, tā rātou tautoko mai i te kaupapa me te mana, te pūahoaho, te tauwhiro me te tohutohu me aha āhea. Nā ō rātou reo i āwhina te mahi raranga i te mahi kia kotahi.
Ko te pūrongo nei he whakaatatanga i te mahi tahi a rau ringa, a rau ngākau, a rau hinengaro kia tutuki ai te kaupapa. E mihi atu ana ki ngā kaipupuri i te mātauranga, ki ngā kaiarataki, ki ngā kairangahau, ki ngā kaitātari, ki ngā whānau i homai whakaaro kia taea ai te whakatutuki tā te pūrongo e kī nei.
Tēnā kia whakaingoatia ake i konei te hunga nei, ko Ian Lambie, ko Anna Stevenson, ko Huhana Hickey, ko Elana Curtis, ko Tristram Ingham, me Jacinta Fa’alili Fidow.
Nā ō koutou whakaaro, tō koutou tūpato, tō koutou whakapau wā, i hōhonu ake ai, i kitea ai te ahunga o te mahi nei. E mihi ana ki tō koutou āta whakaaro me tō koutou ū ki te whakaaro kia kaha ake, kia tōkeke ake te wā kei mua i te aroaro.
Ehara te pūrongo nei i te takotoranga kōrero mō ngā mahi i tutuki engari he kokenga whakamua. E tono ana kia haere tonu ngā kōrero, kia pai ake ngā whakatau, kia mahi tahi.
Tēnā rā koutou i takahi nei i te ara o te panoni i ō mātou taha.
Acknowledgements
We begin by acknowledging the unseen forces that guide and steady us – those who have come before and whose legacy continues to shape our journey.
We recognise those who have contributed to this kaupapa with insight, integrity, and care. Whether through leadership, research, lived experience, or advocacy – your voices have helped weave this work together.
This report stands as a reflection of many hands, hearts, and minds working together with purpose. We acknowledge the knowledge holders, leaders, researchers, analysts, and whānau who contributed their insight and experience to shape what lies within these pages.
We especially thank our external reviewers: Ian Lambie, Anna Stevenson, Huhana Hickey, Elana Curtis, Tristram Ingham, and Jacinta Fa’alili Fidow. Your whakaaro, your care, and your time have added depth and direction to this work. We are grateful for your openness, your clarity, and your commitment to building a stronger, more equitable future.
This report is not just a record – it is a stepping stone. It invites further conversation, better decisions, and collective action. We thank you for walking with us in this journey toward change.
Executive summary
Determining our future health and wellbeing
Being healthy and well is much more than the absence of illness. Good health allows us to fulfil our potential and ‘live awesome lives’.1 This report by the Public Health Advisory Committee (PHAC) looks forward to 2040 and examines how we can best improve health and wellbeing outcomes for everyone in Aotearoa New Zealand.
We are facing significant new challenges to our wellbeing, at a time when our health system is already over-stretched. Our population is more diverse, growing and ageing. The global political situation is changing and uncertain. There are increasing impacts of the climate crisis and environmental degradation, and potentially major effects on employment and society with increasing use of artificial intelligence (AI) and other digital technologies.
Twenty-five years on from the last major report on social, cultural, and economic determinants of health in Aotearoa New Zealand, this report brings together evidence on the health and wellbeing of our country, and what influences it. We use a wide range of sources, including findings from international and local research, evaluations of implementation experience, population data, and case studies. We draw on the experience and perspectives of community, iwi and public service leaders, and of young people, in understanding what is working and in proposing new approaches. These views have greatly enriched this report and the recommendations for action that PHAC offers.
What are the main influences on our health?
Many people think that individual behaviours and access to health care have the greatest effects on health, but this is not the case. Rather, health starts in our homes, schools and communities. Strong connections with our whānau and community, and where we live, work, learn and connect with the environment all have a greater influence on our health and wellbeing than health care. These influences are called the determinants of health.
The health system is also considered a determinant of health – and importantly, can reduce the impacts of poverty and other harmful exposures, and address the disabling consequences of health conditions. However, this report focuses primarily on factors outside health care, as these contribute significantly more than health care to our health and wellbeing.
Our health and wellbeing – tōtara in the forest of Tane
We use the image of tōtara trees in the forest as a metaphor to explore the influences that shape our health and wellbeing (Figure 1). The tōtara represents a person and their whānau. The tree’s health and growth depend on having fertile soil, stable bedrock and a healthy environment. The tree’s leaves and fruit are signs of growth which illustrate our health and wellbeing outcomes. These are the outward signs of what is happening under the soil and inside the tree.
The soil represents resources, such as having a secure home, access to healthy food and a stable income. These resources (or determinants) nourish us, so we can flourish and thrive. Trees get stability from their roots, which are part of a root network they share with other trees. People do best when they have strong relationships and connections, through whakapapa, shared interests or being part of a community. In this way the root networks illustrate our whānau and community connections.
Figure 1: Tōtara in the forest of Tane
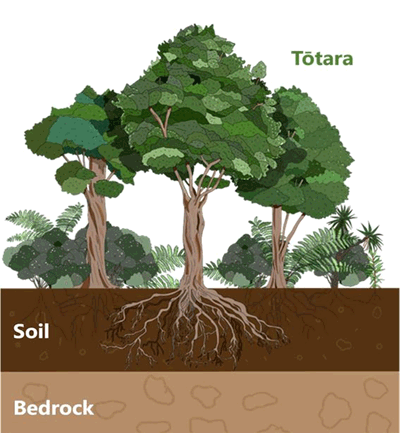
The bedrock below the forest and soil is its foundation. In the same way, human rights, the right to health and Te Tiriti o Waitangi are fundamental to our society and wellbeing in Aotearoa New Zealand. They guarantee our freedoms, rights and obligations to each other. However, there are other elements in the bedrock and soil today which negatively influence the health and wellbeing of the forest. Discrimination, racism, the ongoing impacts of colonisation, and our current type of economic system are some of the structural issues in the bedrock of our society which create unequal access to the soil, the resources for health and wellbeing.
This means that the determinants of health are not evenly spread across our society. For example, people living in less well-off communities are often exposed to multiple health damaging factors such as poorer working conditions, low incomes, greater traffic and air pollution, and lower quality housing, than people in more advantaged communities. Disabled people face discrimination in employment, earn lower incomes, and have poorer access to suitable housing. The determinants do not operate independently but act together, often with compounding effects.
How is Aotearoa New Zealand tracking?
Trends in determinants since 2000
Despite some progress overall, our review shows that since 2000, significant differences by socioeconomic status, ethnic group, disability and age have persisted across important determinants of health, including income, employment, and education. Indicators have gone backwards for all of us since 2000 in some critical areas, such as housing affordability, household crowding, food security, the quality of our natural environment, and levels of trust in government and within communities. (Section 3).
Young people told us that the cost of living and financial stressors are their greatest immediate concerns, limiting the opportunities they can take up and affecting their mental health. Many young people also feel overwhelmed, anxious, or angry about the climate crisis, pollution, the global situation, and inaction from decision-makers.
Trends in health outcomes since 2000
The report assesses progress in the health of our communities over the last 25 years, and what we have learned. Although overall we live longer lives, and important gains have been made over the last 25 years, these benefits have not been equally shared. This is reflected in persistent, but preventable, differences in health outcomes and life expectancy between communities in our country. These inequities largely parallel the trends we see in health determinants.
Health inequities today remain striking, as illustrated by how long we can expect to live. Children growing up in our most urban areas today can expect to live four years longer than those in the most rural areas. A Pākehā (European New Zealander) baby boy born in Waikato today can expect to live eight years longer than his Māori neighbour. Pākehā children can expect to live to 84 years in the northern region, seven years longer than Pacific peoples’ children – a gap that has increased since 2000.
In addition, complex long-term conditions such as diabetes are more prevalent, and our mental health is poorer, especially for children and young people. We are less physically active and more of us have unhealthy excess weight, contributing to diabetes, cancers, and disability. Our health system is under huge pressure – and we have a growing and ageing population which will increase these pressures.
Why is it important to reduce inequities in health?
A healthy cohesive society and a resilient prosperous economy are key goals for government and are deeply intertwined. Inaction on health inequities has significant costs – predominantly for whānau and communities – but also for our health system and economy. Improving health and wellbeing through addressing the determinants that shape our health can reduce health system pressures. Improving health and reducing inequities in important health outcomes such as communicable diseases, youth mental health, and alcohol harm has collective benefits for all of us.
Te Tiriti o Waitangi reaffirms tino rangatiratanga for Māori and a place for non-Māori to live in Aotearoa New Zealand. In Te Tiriti, the Crown (our government) has committed to protect Māori health and deliver the best health outcomes for everyone. By 2040 it will be 200 years since our ancestors and tūpuna signed Te Tiriti o Waitangi, and we must achieve real and sustained progress in this partnership and in health outcomes for Māori.
Faced with unequal economic and social circumstances in Aotearoa New Zealand, and persistent disparities in health and wellbeing, many New Zealanders are worried about this lack of fairness. There are concerns especially for our children and young people, and the negative impacts that these inequities have on cohesion and sense of togetherness in our communities.
The good news is that these influences on our health are not fixed or inevitable. We can modify them through the social and economic policies and programmes we choose to implement. In this report we assess some of the areas of progress since 2000, such as the reduction in child poverty, and how positive change can be created. We also summarise evidence about policies and programmes that show effectiveness in improving wellbeing and reducing health inequities.
New challenges are shaping our wellbeing
We discuss some important current and emerging challenges to our health and wellbeing. Commercial entities such as the food, alcohol and tobacco and fossil fuel industries and their practices influence our health, directly and indirectly. We consider the potential impacts of the ‘megatrends’ – the climate crisis, and AI and digital technology, which will affect all aspects of our society in the coming decades.
So, what do we need to do?
In the face of the challenges shaping our future, PHAC’s recommendations to the Minister of Health and government for improving health equity and wellbeing are grouped around three main themes. Developing agreed multi-partisan, longer term wellbeing goals is a critical step for government to achieving health equity and wellbeing. The actions we propose reflect our assessment of the evidence and what we have heard from community, iwi and public service leaders, and young people. These actions are presented in more detail in the final section of the report.
PHAC recommends that government:
- Invest in and empower communities, the root network of our forest. Wellbeing, social cohesion, economic prosperity, and health start within whānau and communities. Their mana, aspirations for self-determination, capacity and strengths are fundamentals to build on. Early support for children and their families is vital to improving health equity and wellbeing across the life course.
- The whole public service needs to work collectively across government to achieve agreed wellbeing goals with communities. This requires making changes in the way public services work together, to enable and empower communities.
- Strengthen our bedrock, the fundamental structures of our society so that all New Zealanders have access to the resources they need to thrive.
- We propose initiating a discussion on Te Tiriti o Waitangi as we move towards 2040, about how we want to govern our country.
- Human rights need to be embedded further into our laws, public policies, and practice.
- The government needs to articulate an explicit approach to economic growth, societal wellbeing and equity. We need an economic system that is more equitable and redistributive by design. Further use of income and wealth tax levers is needed to reduce income and wealth inequities, and to support adequate investment in social and health services.
- Invest in ‘win-win’ solutions that nourish the soil and which have compounding benefits for health and other social outcomes.
Solutions for existential challenges like the climate crisis sit outside the health system, but can be ‘win-win’, with benefits for health equity, and for other positive social, economic, and environmental outcomes.
While the focus of this report is on the determinants of health outside the health system, we recognise the important contribution health care makes to our health and wellbeing. We propose recommendations for the health system that align with the three themes above. The health system must retain health equity as a key goal. An equitable, accessible and non-discriminatory health system is core to realising a healthy future for us all.
Introduction
Good health allows us to fulfil our potential and ‘live awesome lives’.1 This report by the Public Health Advisory Committee (PHAC) looks forward to 2040 and examines how we can best improve health and wellbeing outcomes in Aotearoa New Zealand for everyone.
Today, our health care system is facing huge pressures. Every day the headlines tell us there is a health ‘crisis’: ‘epidemics’ of diabetes and youth mental health, long waiting lists for hospital care, problems accessing primary care, inadequate staffing and unaffordable treatments.2-4 We are also facing significant new demographic, environmental, and societal challenges which will strongly influence our future health and wellbeing.
Health starts in our homes, schools and communities. Strong connections with our whānau and community, and where we live, work, learn and connect with the environment all have a greater influence on our health and wellbeing than health care or individual behaviours. These influences are called the ‘determinants of health’.5-7 Twenty-five years on from the last major report on determinants of health in Aotearoa New Zealand,8 the PHAC assesses progress in the health of our nation, what we have learned, and examines new and emerging challenges.
Evaluating the effects of big societal and policy changes on health and wellbeing is not like assessing the result of a single intervention in a randomised controlled study. Our society is complex and there can be unexpected or unintended effects. So, we bring together evidence from a wide range of sources on the health and wellbeing of our country, and what influences it. This includes research findings, evaluations of policy and programme implementation experience here and internationally, trends in population data since 2000, and case studies.
We also draw on the experience and perspectives of community, iwi and public service leaders, and of young people, to understand what is working and to propose new approaches. These views have greatly enriched this report and the actions we propose. Throughout the report we have included the voices of people we spoke with. Our methods are detailed further in Appendix 1.
In the final section we recommend actions to the Minister of Health, whole of government and the health sector. Many of these actions are ‘win-win’– they address the big challenges like the climate crisis, and at the same time they can significantly improve health equity and wellbeing outcomes in all our communities.
Challenges to our health and wellbeing
A changing society
By 2040 the population of Aotearoa New Zealand is predicted to reach 6 million.9 More of us will live in urban areas, with Auckland growing faster than other cities. Our society will be very diverse and have large populations of young Māori (>1 million), young Pacific peoples (>650,000) and young Asian peoples (>1 million).9 One-third of children will identify as Māori, and one in five as Pacific peoples. At the same time, in each ethnic group, the number and proportion of people over 65 years will increase.9
The demand on our health system is expected to significantly increase as our population grows and ages, and more people experience chronic conditions such as diabetes, cancer, and mental health conditions.2,10 Given current trajectories, many more of us will experience impairments (disabilities) associated with these conditions and with ageing. Demand will also increase as we continue developing new, and often expensive, treatments.11,12
Entrenched and unfair differences in health
Aotearoa New Zealand has entrenched but preventable differences in the health of different populations, with poorer outcomes disproportionately experienced by Māori and Pacific peoples. i, 13,14 Children growing up in our most urban areas can expect to live four years longer than those in the most rural areas.
Girls growing up in the most socio-economically advantaged areas of our country will live five years longer than girls in the least advantaged areas. Despite some reduction in the life expectancy gap between Māori and Pākehā (European New Zealanders) since 2000, a Pākehā baby boy born in Hamilton today can expect to live eight and a half years longer than his Māori neighbour.
Pākehā children can expect to live to 84 years in the northern region, seven years longer than Pacific peoples’ children – a gap that has increased since 2000.15 The loss of potential wellbeing and experience of poor health impacts most on those directly affected and their families, but these losses diminish the overall wellbeing of us all.
[i] In Aotearoa New Zealand, ‘Pacific peoples’ is a collective term for diverse ethnic groups that trace their origins to indigenous peoples of the island nations of the Pacific, such as Tonga, Samoa, Niue, and the Cook Islands.
New challenges shaping our future wellbeing
In the coming decades there are important global and local influences – trade, economic and geopolitical changes, digital technologies, the climate crisis and environmental degradation – that will have increasing impacts on our health and wellbeing.16,17 By 2040 our environment will face extensive effects of climate change and biodiversity loss.17 Our society is likely to be dramatically changed through artificial intelligence (AI) and other technologies.18,19 Global geopolitics may be more confronting, and global and regional migration patterns may change.16 While the impact of these challenges is still uncertain, they have the potential to threaten our wellbeing and social cohesion, and destabilise our society and governance.
Why do we need to act?
In addition to responding to these demographic, environmental and social challenges, there are further fundamental reasons for action to achieve a healthy society. A healthy, cohesive society and resilient, prosperous economy are key goals for government.20,21 A productive resilient economy needs healthy people, and greater disparities in health are associated with poorer economic performance of countries.22 Inaction on health inequities has significant costs – predominantly for whānau and for our society, but also for our health system and economy.23 Improving health and wellbeing through addressing the determinants of health can reduce health system pressures.
Social and economic prosperity are linked and depend on each other. Ensuring this concept is at the heart of our decision-making is important for achieving sustainable wellbeing, equity and greater self-reliance.21
In Te Tiriti o Waitangi, the Crown (our government) has committed to protecting Māori health and delivering the best health outcomes for everyone. Te Tiriti o Waitangi reaffirms tino rangatiratanga (sovereignty) for Māori and a place for non-Māori to live in Aotearoa.24 By 2040 it will be 200 years since our ancestors and tūpuna signed Te Tiriti o Waitangi, and we must achieve real and sustained progress in honouring this relationship, putting Crown commitments into practice, and upholding the Crown’s obligations in relation to hauora Māori.
Improving health and reducing inequities in health outcomes such as communicable diseases, youth mental health and alcohol harm has benefits for all of us – as these have collective impacts, not just at an individual level.
Finally, these influences on our health are not fixed or inevitable. We can modify them through the social and economic policies and programmes we choose to implement.
We acknowledge health care is also an important determinant of health, which can reduce the impacts of poverty, toxic exposures and disability. However, this report focuses primarily on factors outside of health care, that contribute significantly more to our health and wellbeing.
An alternative approach is needed
If we keep on with ‘business as usual’, our health system will become increasingly costly and over-burdened, and collectively we will have less optimal health outcomes. But as noted above, international and local research shows that health care does not make the biggest contribution to our wellbeing and health outcomes, or how these outcomes are distributed.7,25 Where we live, our job, income, wealth and resources, our knowledge, skills, and sense of community and connectedness contribute significantly more. This is the rationale for our approach in focusing on and addressing these determinants of health.6,7
In addition, many of the factors associated with poor health in Aotearoa New Zealand are strongly patterned by socioeconomic status and ethnicity. Toxic environmental exposures such as poverty, poor housing, water and air pollution, and food insecurity are unevenly distributed in our society. These factors are often interrelated and have complex and cumulative effects throughout our life, from birth to death, and across generations.26 Modifying these determinants can more effectively influence our overall health and wellbeing than provision of health care.
Outline of this report
Section 1 introduces PHAC’s vision of health and wellbeing, how determinants affect us as individuals and whānau, and the metaphor of tōtara and trees in a forest that illustrates this. It provides the background to the development of this report.
Section 2 synthesises evidence for relationships between the main determinants of health and their interconnections, and examines what drives these relationships. In this section, we also examine the biological mechanisms that explain how some determinants affect our mental and physical health. We consider why it is important that our society addresses entrenched and unfair health differences, particularly in the face of uncertainty and rapid societal changes.
Section 3 looks back to trends in key determinants of health equity and health outcomes over the last 25 years, while Section 4 looks to the future, identifying new or recently recognised influences on our health that will become increasingly important. These include AI and the digital environment, commercial interests and the climate crisis.
Section 5 reviews progress and outcomes since 2000 in some key policy areas that influence wellbeing, through the perspectives of community, iwi and public services leaders. We identify evidence for successful policies that can improve health equity.
Section 6 proposes actions for government. These were developed through review of implementation experience and research evidence in Aotearoa New Zealand and internationally; the learnings of community, iwi and public services leaders; and the perspectives of young people. We illustrate potential actions with two case studies (Appendix 2).
Good solutions can compound wellbeing benefits, including economic benefits. We propose ways to address today’s health inequities and improve everyone’s health, while addressing the significant challenges confronting our society.
1. Our vision – a healthy tōtara
Health and wellbeing are important to us all. Health encompasses our physical, mental, social, cultural and spiritual wellbeing. We experience good health and wellbeing in a personal and a collective sense. Our wellbeing is affected by our connections to our whānau, community and place, through whakapapa and whenua; our beliefs and sense of agency; our life experiences, and our genetic makeup.7,27-29
From decades of research, we know that these personal and collective factors, combined with other key factors in our lives (where we live, our job, wealth, earnings, resources, knowledge and skills), contribute much more to our wellbeing and health than health care alone.7,30,31 At an individual and collective level, these factors together produce combined, cumulative effects across our lives. Good health itself acts as a resource for future wellbeing, like a self-reinforcing spiral. For example, children whose health needs are met are more likely to fulfil their educational potential. This has a positive impact on our society and economy, and the health and wellbeing of the next generation.
Tōtara in the forest of Tane
We use the image of tōtara trees in the forest as a metaphor to explore the influences that shape our health (Figure 2). Trees in a forest appear simple, but they are part of complex and interrelated structures, systems and processes, like those of our whānau, communities and society. The diversity in our society reflects the biodiversity we see in a healthy forest.
The tōtara represents a person and their whānau. The tree’s health and growth depend on having strong root networks, fertile soil, a stable bedrock and healthy environment. The tree’s leaves and fruit are signs of growth, illustrating our health and wellbeing outcomes. These are the outward signs of what is happening under the soil and inside the tree.
The soil represents resources (determinants) like having a secure home, access to healthy food and a stable income. These conditions nourish us, so we can flourish and thrive. Trees get stability from their roots, which are part of a root network they share with other trees. This network helps the tōtara weather storms or other adverse events. People do best when they have strong relationships and connections, through whakapapa, shared interests or being part of a community. The root networks illustrate these whānau and community connections.
The bedrock below the forest is its foundation. Investing in the conditions that will nurture society as a whole enriches the bedrock and soil. In this way, human rights, our rights to health, and Te Tiriti o Waitangi, are fundamental to our society, relationships and wellbeing in Aotearoa New Zealand. They guarantee our freedoms and obligations to each other. Our economic and justice systems are other important elements in the bedrock.
Figure 2. Tōtara in the forest of Tane
There are elements in the bedrock and soil today which negatively influence the health and wellbeing of the forest. Discrimination, racism and colonisation, and our current economic model are some of the structural issues in the bedrock of our society which continue to create unequal access to resources. In addition, the climate crisis, and the transformation of work and society that we expect AI to bring, are further critical challenges for the bedrock of our society. These ‘megatrends‘ are predicted to strongly influence our future health and wellbeing.16,32
Our vision of health and wellbeing
In many consultations, hui and talanoa led by the health system in recent years, communities across Aotearoa New Zealand have expressed what good health and wellbeing mean to them, and the importance of the relationships and resources that contribute to that (Appendix 1). Communities want whānau to prosper and ‘live awesome lives’,1 achieving their potential in positive engagement with their community and their environment. The thriving tōtara in the forest illustrates this idea.
[Being healthy means] living a full life surrounded by whānau doing things that matter.33
PHAC’s vision of health is of intergenerational wellbeing (pae ora), where everyone’s potential is realised, and where we live collectively with a sense of belonging in a healthy, sustainable environment (te taiao). This vision of health and wellbeing is guided by two ‘touchstones’ or positive elements of our bedrock: the right to healthii and Te Tiriti o Waitangi. Te Tiriti o Waitangi affirms the right to health and underpins our vision for wellbeing in Aotearoa. It is a foundational commitment that shapes our relationships, how our society is organised and the rights and obligations we all hold.
[ii] The right to health is referred to in international treaties, including the International Covenant on Economic, Social and Cultural Rights and the United Nations Declaration on the Rights of Indigenous Peoples. It encompasses the determinants of health.
The right to health
Health is a fundamental human right.34,35 Everyone has the right to enjoy the best physical, mental and spiritual health possible, and to access high quality health care that they need. Every family, regardless of who they are, where they live or how much they earn, should have the resources they need to ensure their children grow up healthy and have the opportunities to live their best lives.
‘Health equity’ is achieved when everyone can reach their full health and wellbeing potential.32 It implies that resources are distributed and processes are designed in ways most likely to equalise the health outcomes of disadvantaged social groups with the outcomes of their more advantaged counterparts.36 Health equity is a right to ‘substantive equality’, which means people having equal opportunities and outcomes across multiple dimensions. In contrast, ‘formal equality’ means treating everyone equally, based on the norms of society’s dominant group.37
Te Tiriti o Waitangi
In Te Tiriti o Waitangi, the Crown–Māori relationship acknowledges the responsibility of the Crown (our government) to govern (kawanatanga, Article 1); reaffirms the sovereignty of Māori chiefs (tino rangatiratanga, Article 2); and promises equity (ōritetanga or rite tahi, Article 3). PHAC recognises the government’s obligations to uphold Te Tiriti, which reaffirms Māori rights and lays a foundation for a just and equitable society for all in Aotearoa New Zealand.
We acknowledge the five principles that guide the health system, articulated by the Waitangi Tribunal in 2019.
- Tino rangatiratanga
- Equity
- Active protection
- Options
- Partnership.
The Pae Ora Act (2022) embedded the Crown’s intention to give effect to Te Tiriti o Waitangi in the health system in legislation.39-42 PHAC supports reparative and restorative justice processes, recognising and acting on past and current injustices.
In the tōtara tree metaphor, the soil above the bedrock that nurtures the tree’s roots represents the expression of our rights and the more immediate influences this has on whānau wellbeing (such as adequate incomes, sustainable employment, equity in education, strong cultural identity, and safe and secure housing). When people’s rights are not observed or respected, access to resources for wellbeing, or the determinants of health, is more unequal. This results in inequities in the health and wellbeing of whānau and communities.
Whakapapa of this report
Knowledge of the importance of the relationships between good health and wellbeing and the determinants is not new. Understanding this history provides important context for where we are now. Oranga (the Māori world view of wellbeing) acknowledges that wellbeing is interconnected with whakapapa and identity, our environment, and whānau or family group.28
One could not be well if one’s whakapapa was disrupted, as it was from one’s whakapapa that knowledge about te ao Māori and self and group identity was sourced. One could not be well if one’s connection to the whenua was lost, as it was from the whenua that one’s self- and group identity, belonging, and nourishment was activated and practiced. One could not be well without whānau, the most intimate social unit within which one learned about and practiced the reciprocity of caregiving, nurturing, and the giving of security.28
Contemporary public health practice and determinants of health
Contemporary public health practice developed in the 19th century in parallel with the Industrial Revolution in Europe and the USA, and as a key tool of the European colonial project.43,44 The Industrial Revolution was accompanied by extreme poverty and atrocious working conditions, which had highly detrimental social and health impacts. Workplace injuries and death were common, and severely polluted water and air caused illness, epidemics and death. This situation led to the first Public Health Act in England in 1848. The Act triggered major policy changes to improve living and working conditions. This resulted in improved life expectancy for everyone, well before modern medical treatment was available.45
In Aotearoa New Zealand, the history of public health is intimately linked with important determinants of health: colonisation, urban planning and the control of infectious diseases (through improved housing, safe water, access to health care, etc.).46,47 Following the Great Depression of the 1930s, major reforms of many key determinants occurred, including employment and income support, the introduction of superannuation and public health care, and strategies to advance economic development, wellbeing and health outcomes.48,49
Over the last three decades, public health researchers and practitioners in Aotearoa New Zealand have focused on understanding how determinants such as housing, urban transport, environmental factors, and racism and discrimination influence our wellbeing. The timeline in Appendix 3 shows some key public health research and reports that have been influential here and internationally in developing our knowledge, experience, and actions on determinants of health.
Previous Advisory Committee reports
In 1998, the National Health Committee (NHC)iii published The Social, Cultural and Economic Determinants of Health in New Zealand: Action to Improve Health.8 This report summarised evidence on determinants of health in Aotearoa New Zealand. It recommended strategies that the health sector could implement to reduce socioeconomic inequalities in health and noted the importance of policies and interventions outside the health sector.
The Public Health Advisory Committee of the time then published The Effect of Environmental Factors on the Health of New Zealanders in 2002,50 and A Way Forward: Public Policy and the Economic Determinants of Health in 2004.51
The first publication examined environmental issues linked to ill health and health inequalities (such as air and water quality) and issues emerging at that time (such as climate change and health in urban environments). The second publication explored the relationship between socioeconomic status and health.
These reports had considerable influence on public health, health system thinking, and actions on determinants of health and health equity in Aotearoa New Zealand.52 They inform how we approached this report in 2025, while contemporary evidence and perspectives have enlarged our understanding and provided new insights on present and future challenges.
[iii] The National Health Committee (NHC) existed in various forms from 1993-2016. The Public Health Advisory Committee was established as a sub-committee of the NHC in 2001 and formally dis-established in 2016, along with the NHC. The current PHAC was established under the Pae Ora Act in 2022 [Skegg, D. The Health of the People (2019). BWB Books].
Social and environmental changes since 1998
Our society and health system have changed significantly since the 1998 NHC report. We summarise key changes here, with further data and analysis provided in Section 3 and Appendix 4.
Changes to our population
Since the 1990s, our population has grown to over 5 million. Migration patterns have also changed – we are now a more diverse society, particularly in urban centres. Nearly two-thirds of Pacific peoples in Aotearoa New Zealand live in Auckland, which is now the world’s biggest urban centre for Pacific peoples. Two-thirds of Aotearoa New Zealand’s Asian peoples also live in Auckland.53,54
Changes to how we see ourselves
Māori understandings about identity and belonging increasingly influence the collective national identity.55,56 Māori media has had a major impact on the public’s understanding of issues that are important to Māori and Aotearoa New Zealand. More of us speak te reo Māori, and most of us believe Te Tiriti o Waitangi is an important partnership that must be honoured.57 There has been settlement of some significant Treaty of Waitangi claims and government investment in line with Treaty commitments.58
The Māori economy, including iwi-led enterprises, has grown significantly, and now outperforms Aotearoa New Zealand’s overall economic indicators.59 The Māori tourism industry alone is worth more than $1.2 billion annually. On average, Māori tourism businesses generate more employment opportunities and pay higher salaries than non-Māori tourism businesses.60
Changes to technology and education
Relying on technology is part of my everyday life. [Rangatahi, The HIVE]
Our society and systems are now driven by digital technologies that have revolutionised the way we live, work, learn, and play. The rate at which these technologies advance sometimes outpaces our ability to adequately mitigate risks and harms. Since 2000, there has been widespread – if still uneven – uptake of internet, digital technologies and social media. This has both major benefits and some negative social impacts, particularly for younger people.
[Social media] feeds misogyny amongst young men and Instagram encourages it… Dating apps suck for body image and the gender difference, meaning you get so used to rejection and makes meeting people feel less important. [Rangatahi, The HIVE]
Our education system has also changed significantly. New Zealanders, especially women, are more likely to study at tertiary level, to study at older ages, and are more qualified.61 The kōhanga reo movement, kura kaupapa Māori and whare wānanga have visibly contributed to Māori whānau development, educational achievement, leadership and wider success.
Changes to our wealth
Since 2000 there have been small reductions in income inequality as a result of progressive tax and welfare transfers, but we still have large differences in wealth.62 Increasing globalisation and neoliberal economic policies have been associated with more casual and precarious employment, declines in home ownership and affordability, and increased rental stress.63,64 Improvements up to 2022 in child poverty rates and household food security measure have stalled or reversed since 2023.
Figure 3. The persistent relationships between ethnicity and socioeconomic deprivation (NZDep) in Aotearoa New Zealand, 1991-2023
non-Māori non-Pacific non-Asian
Use arrow keys to navigate the key indicator items.
- Download
- Download dataset
Asian
Use arrow keys to navigate the key indicator items.
- Download
- Download dataset
Māori
Use arrow keys to navigate the key indicator items.
- Download
- Download dataset
Pacific
Use arrow keys to navigate the key indicator items.
- Download
- Download dataset
Source: Crampton P. The persistent relationships between ethnicity and socioeconomic deprivation in Aotearoa (NZDep) 1991 and 2023. Personal communication; 202565
Figure 3 shows the proportion of each ethnic grouping by NZDep, in 1991 and in 2023. NZDep measures the level of socio-economic deprivation for people in small areas, based on nine Census variables. NZDep is displayed as deciles (10%), with each decile containing about 10% of small areas in New Zealand. Decile 1 represents areas with the least deprived scores and Decile 10 represents areas with the most deprived scores.67
If socioeconomic deprivation were independent of ethnicity, each ethnic group would be equally distributed across the deprivation deciles (all the bars would be equal in height). However, the distribution is highly unequal: more than half the Māori population lives in the most deprived neighbourhoods (deciles 8–10). The Pacific population is even more skewed towards the most deprived deciles.
This negative relationship shown in Figure 3 between ethnicity and material deprivation in Aotearoa New Zealand, known as the ‘distribution gap’,66 remains largely unchanged since 1991.65 It reveals that the social and economic structures of opportunity and privilege in our country are profoundly patterned by colonisation and racism, and there remain significant obstacles to systemic and societal change.
Changes to our natural environment
Our natural environment is under stress. We are experiencing more frequent severe weather events, and our environment (especially our rivers and lakes) is degrading. Over half of our rivers have moderate or severe organic pollution or nutrient enrichment, which often makes them unfit for swimming or drinking.17
Most of our indigenous marine and freshwater bird species are threatened with extinction, or are at risk of becoming threatened.17 Microplastics (pieces of plastic that are less than 5mm long which are formed when larger plastics break down) are now widespread throughout our marine environment and in freshwater organisms.17 Groundwater nitrates already exceed human health-based limits in parts of Canterbury, Waikato and Southland, mainly due to farm fertiliser run off.68 Without any intervention, nitrate levels are projected to increase further.69
Improvements to our health and wellbeing
Despite the ongoing challenges to achieving health equity, interventions in Aotearoa New Zealand’s health sector since 2000 have led to population health gains. Since 2000, the life expectancy gap between Māori and other ethnicities has been narrowing. It was 8.3 years in 2001-2003 and had reduced to 6.6 years by 2020-2022, a 20% decrease. Inequities in some other health outcomes have also decreased modestly, such as infant mortality.15
Public health programmes and interventions
Public health programmes and cross-sectoral interventions have contributed to improved health outcomes and life expectancy for all population groups. Programmes and policies such as immunisation, cancer screening, Smokefree Aotearoa 2025 and Healthy Homes standards have led to significant reductions in vaccine preventable diseases, cervical cancer, and health-damaging factors, such as smoking. 15,70
Although we are now living longer, more of us live with chronic conditions and their consequences, and some risks for ill health have worsened. We are less physically active now, and one in three adults has unhealthy levels of excess body weight (nearly double the proportion in 1998).76 Other measures indicate our mental wellbeing has declined, especially for young people.76 We have the highest rate of suicide in young people and children in the OECD.77 An overall reduction in total population mortality has not necessarily reduced differences between the mortality rates of population groups.15 Even as the causes of illness and death change, these inequalities persist, showing that unequal social determinants have an ongoing impact on health outcomes.78
In Section 3 and Appendix 4 we explore trends in determinants of health, health status and health inequities between 2000 and 2024 in further detail.
The COVID-19 pandemic
Notably, since 2020 we have lived through a global pandemic – which continues to have effects, particularly for people with chronic illness or disability. From 2020-2022, Aotearoa New Zealand’s evidence-based public health strategies, alongside income, business and social protection measures, contributed to lower morbidity and mortality, and less negative economic impact than that experienced in most other high-income countries.79-81While global life expectancy declined by 1.6 years between 2019 and 2021 due to the pandemic, New Zealand was among the few countries that saw an increase.15
Diverse models of community and primary care
As a result of pro-equity policies, throughout the health system we now see more diverse models of community and primary care, and many more resilient, experienced Māori and Pacific health providers, Whānau Ora collectivesiv and Asian, disability and LGTBQIA+ services.v
Multiple evaluations of these programmes demonstrate the strength of diversity in practice and the effectiveness of equitable approaches.82-84 Understandings of cultural safety in the health system have developed over time.85 Initial steps have been made to support the health system to better understand, react, and respond to racism in health.86
[iv] Whānau Ora is a Māori-led and whānau-centred approach to whānau support that was developed jointly by Te Puni Kōkiri, the Ministry of Health and Ministry of Social Development from 2010.
[v] LGBTQIA+ is a term that includes people who identify as lesbian, gay, bisexual, transgender, queer, intersex or asexual, or who have more diverse sexualities, genders and sex characteristics.
Recognising the needs and aspirations of disabled people
‘Enabling Good Lives’87 is a framework co-designed by the disabled community with government since 2011. It aims to give disabled people and their families decision-making power and autonomy, support inclusion and improve wellbeing outcomes. It is backed up by the Pae Ora (Healthy Futures) Act 2022, which committed the health system to achieving equity for disabled people. This approach and associated principles have been broadly accepted by the health and disability system, although not yet fully implemented. Achieving equity requires sustainable resourcing and a nationally consistent approach that is community-led, culturally responsive, and grounded in the principles of Te Tiriti o Waitangi.
Knowledge, evidence and analytical tools
We now have more evidence and experience from implementing policies and interventions, and better analytical tools, to understand and measure which policies and interventions in and outside the health system are effective at improving health outcomes and health equity. The most effective of these include redistributive tax policies and income support, high quality social housing, early childhood intervention and access to quality health and social services.6,78,88-99
We also better understand the factors that support people to be resilient and enjoy good health and wellbeing. These factors – especially for children and young people – include whānau connection and trust, identity and community, and access to culture and language.29,100,101
No matter how old you are, feeling loved by your family is centrally important.102
There’s a massive difference between walking into a room and being tolerated […] versus being celebrated. Community for me means people who know what it’s like [to be me]. Especially for people at the intersection of different identities. [Rangatahi, The HIVE]
The inter-relationship between the health of families, communities and our natural and built environment is now well recognised.
We understand more about how determinants of health (such as discrimination, racism, poor-quality housing, air pollution and social isolation) affect our health, through structural, social, behavioural, physiological, and epigenetic mechanisms.103-106
We have gained important knowledge about how life course and intergenerational factors influence health and wellbeing, through longitudinal studies (including local studies such as the Dunedin Multidisciplinary Health and Development Study and Growing Up in New Zealand).107,108 These studies follow health and other outcomes of children from before birth to adulthood and older age. They have demonstrated the importance of interconnections between many determinants of health, which result in greater privilege or intersecting disadvantage.
In Section 2 we explore in more depth how determinants of health are distributed, and our understanding of the mechanisms by which they affect our physical and mental health.
2. Nourishing the tōtara in the forest
A large volume of research has been carried out worldwide over the last three decades on the relationships between the determinants of health, health outcomes and health inequities. At the same time, there has been substantial policy development, and implementation and evaluation of strategies and programmes aimed at addressing the causes and impacts of health inequities. This has significantly increased our understanding of why and how health outcomes of different social groups are not equally distributed, and how this can be addressed. 7,78,90,109
In other words, we now know a lot more about how resources, ‘the soil’ in our metaphor, (such as secure housing, education outcomes, social cohesion and freedom from discrimination) nourish the tōtara, while an absence of resources starves the tree. We also understand better how the ‘bedrock’ beneath the soil, representing fundamental rights and societal power, positively or negatively influences the distribution of those resources.104,110
In addition, through epigenetic, human developmental and biological research, we understand much more now about how the determinants can directly affect our bodies through biological mechanisms that lead to physical and mental health outcomes.66,111
Why are determinants unevenly distributed?
Compared with 25 years ago, our society is more prosperous, we live longer, and many of our health outcomes have improved. These changes reflect improvements in critical determinants of health including education, income, and employment. However, these benefits have not been evenly distributed.15,70 While our society has many strengths, we also recognise it has been heavily shaped by colonisation, racism, discrimination, Pākehā privilege and our free market economic system.28,43,112-118 These influences act in opposition to the positive rights and obligations in the bedrock that would nourish a healthy forest - they systematically limit who can access the best and most fertile soil.
Williams’ model, adapted by Te Kupenga Hauora Māori researchers at the University of Auckland,43 depicts colonisation as the common underlying process behind these ‘basic causes’ of health inequity. It illustrates how resources and social status are distributed in Aotearoa New Zealand. This means our education, economic, justice and political systems work better for some groups than for others.66,111 Consequently, some of us experience the relative prosperity of warm housing, rewarding jobs, and the ability to access health care services, if and when we need them. Others of us are much more exposed to drivers of ill health, such as material deprivation, unemployment, household crowding, and barriers to health care.70,119,120
We explore some of the ‘bedrock’ influences below, including colonisation, racism and discrimination, and our type of economic system (neoliberalism); how they operate and influence our health and wellbeing.
Colonisation and colonialism
Colonisation (and its practices, colonialism) is based on ideologies of European superiority and empire-building.115-117 Globally, colonisation has exploited Indigenous peoples and marginalised groups, enabling colonial settlers to accumulate economic benefits and wealth.27,29,43,118,121
Effects of colonisation on Aotearoa New Zealand
Colonisation has profoundly shaped, and continues to shape, the social and economic conditions that underpin health and wellbeing outcomes in Aotearoa New Zealand.115,118,122 To understand how colonisation drives ill health, we need to recognise the historical and systemic inequities that are still active today. As a negative influence, colonisation starves, rather than feeds, the soil and root structure of tōtara in the forest.
The centrality of racism to colonialism in Aotearoa New Zealand is reflected in racially structured access to social, political and economic resources that manifests as privileged social outcomes for New Zealand European/Pākehā, and in stark racialised inequities in health status between New Zealand European/Pākehā and Māori.123
From the 14th to 19th centuries, Māori developed rich cultural practices and norms, structurally underpinned by whānau, hapū and kāinga. Land was shared within and between hapū, and kai and other materials were produced communally.28 Māori also shared power, and hapū made decisions collectively. These societal settings meant that access to land, rivers and oceans was considered a collective resource. Likewise, beyond inter-hapū or inter-iwi conflict, few outside influences could influence decisions about the day-to-day lives of Māori.28
Within decades of arriving in Aotearoa New Zealand, British settlers had, through colonial practices, usurped the tikanga (societal laws and norms) that Māori had established over more than 500 years. Māori lost access to land through illegal sales, confiscation, and alienation, with associated loss of access to food production and other resources.
Decisions about day-to-day living were now made by a colonial government with no Māori representation or control.28 The sharp and rapid losses inflicted on Māori by colonisation reverberate today. Colonisation is not a distant historical event; it is a lived reality that continues to influence daily life and privilege Pākehā.43,115 However, Māori have not been passive recipients of this process. They have survived – and often thrived – resisting colonial structures and systems, sometimes at great personal and collective cost.27,115
Aotearoa New Zealand’s colonisation of Pacific nations
Pacific peoples’ experience in Aotearoa New Zealand is entwined with New Zealand colonial history in the Pacific, racial capitalism, Pacific migration following World War II and marginalisation.124,125
Large-scale migrations of Pacific peoples to Aotearoa New Zealand began in the 1950s and continued throughout the rest of the 20th century.126 Migration was often motivated by aspirations for a better education and prosperity, which would also support families and villages at home. Most Pacific migrants come from Cook Islands, Fiji, Niue, Samoa, Tokelau or Tonga, but some come from other Pacific nations.124
In 1945 the population of Pacific peoples in Aotearoa New Zealand was just over 2,000; now it is nearly 443,000.127 The population is diverse, young (half the population is under 25 years), growing and mostly urban (62% live in Auckland). Nearly half of Pacific peoples identify as Samoan, and nearly a third of those under 15 years also identify as Māori. Two-thirds of the population were born here.127 Of those born overseas, more than 60% have lived in Aotearoa New Zealand for more than 10 years. One-third of Pacific households include extended families, and many span three or more generations.127
Pacific peoples’ experience in Aotearoa New Zealand
Government and industries in Aotearoa New Zealand saw Pacific peoples as cheap labour for a growing economy, reflecting our colonial relationship with the Pacific.
But by the early 1970s, Aotearoa New Zealand’s economy was in decline, and political and public attitudes turned against Pacific migration. This led to increased hostility and overt racism towards Pacific peoples. Police and immigration authorities targeted Pacific peoples for immigration checks, despite 40% of ‘overstayers’ being British and American. This culminated in the infamous Dawn Raids, in which Pacific peoples’ homes were invaded as police looked for overstayers to deport.124
New Zealand is a nation that exists on Pacific islands but does not, and perhaps cannot, see itself as a Pacific Island nation or its people as Pacific Islanders…Pākehā New Zealanders live on Pacific islands but many – perhaps most – still describe themselves as ‘Europeans’…
In these kinds of understandings and claims there can be no acknowledgement of Pacific place and Pacific histories, no claiming of a Pacific connection, let alone a Pacific-based identity….124
Pacific peoples have made significant contributions to Aotearoa New Zealand, culturally and economically. A 2018 study for the Treasury estimated Pacific peoples contributed $3.1 billion to production GDP and $8 billion in income GDP to the economy.128
Despite many having New Zealand citizenship, Pacific peoples migrating here faced and continue to face cultural and language barriers, personal and institutional racism, and difficulty accessing education, employment and higher incomes. This has led to material deprivation and inequities in health outcomes.70,124
Many Pacific families are struggling with the high costs of rent and poor quality of housing.129
The life expectancy of Pacific peoples living in Aotearoa New Zealand is nearly six years lower than that of European New Zealanders.129 This, and other health inequities, are directly associated with discrimination and differential access to education, income, housing and employment. These differences limit Pacific peoples’ opportunities to achieve the best health possible for their whānau, and to access timely, high-quality health care.129
Pacific peoples in Aotearoa New Zealand are more likely to experience material deprivation than other New Zealanders. However, Pacific peoples have maintained stronger community connections, bonds of trust and religious identity than New Zealanders as a whole. They also rate their health and life satisfaction highly, although these measures have declined recently.76 The strength, resilience and innovation of Pacific communities and Pacific health workers were evident during their highly effective response to the COVID-19 pandemic.14
Discrimination
Human, social, and economic rights, and freedom from discrimination, poverty and inequity, are fundamental to health and wellbeing. They form the bedrock of our tōtara forest.
These rights are enshrined in New Zealand legislation, including the Human Rights Act 1993 (HRA) and Bill of Rights Act 1990,130 although full realisation of these rights is incomplete. The HRA makes it unlawful to discriminate on the grounds of sex (including pregnancy and childbirth), marital status, religious belief, ethical belief, colour, race, ethnic or national origin (nationality and citizenship), disability, age, political opinion, employment status, family status or sexual orientation. As with international human rights legislation, the HRA allows special measures that will advance disadvantaged groups and address historical disadvantage to achieve equality.130
Many people understand discrimination as something that happens at a personal level, between individuals, but there are collective effects. The 2021 Whakatika report, based on a survey of Māori experiences of racism, notes that ‘Legal definitions of racism and discrimination, which look only at an individual without looking at the impact on whānau, hapū, iwi and Māori communities, fall short of capturing the true costs of racism as an attack on rangatiratanga.’131
Discrimination operates at structural and institutional levels. These types of discrimination shape what happens when we look for work or housing or seek health care.132 Māori and Pacific peoples’ experience of discrimination is reflected in their employment, housing, and health outcomes. Other groups, including disabled people and LGBTQIA+ people, also experience these types of discrimination, which are maintained and reinforced through social norms, public policy, economic systems, and organisational practices.
In this section of the report, we present evidence of how different forms of discrimination affect the health and wellbeing of individuals, whānau, and populations.
Racism
Without racism Aotearoa would be better. [Mokopuna, aged 11-13, Rural Waikato]133
Racism can be understood as an organised and complex system, underpinned by false beliefs that people’s race or ethnicity makes them inherently superior or inferior. Racism operates to give a dominant racial or ethnic group privileges, while simultaneously disadvantaging others.134 Racism underlies the ideology of colonialism but is broader than that.113,123,135,136 In Aotearoa New Zealand, racism underlies justifications for the dispossession of land and rights from Māori, and undermining of Māori knowledge (mātauranga Māori), spirituality and practices.28
For Māori and Pacific peoples, racism, and other forms of discrimination, are a pathway to significant health inequities.137-139 Māori, Pacific peoples and Asian peoples report a much higher prevalence of racial discrimination, and experience more forms of discrimination, than Pākehā, including when they access key determinants of health such as housing, employment and education. Young Māori, Pacific peoples and Asian peoples are two to five times more likely than young Pākehā to be exposed to racism. This exposure is strongly associated with poorer mental and physical wellbeing and scoring lower on having a sense of identity and of belonging.138
Getting treated different and people think its ok cause they already decided you don’t deserve anything else. [Mokopuna Māori aged 14-16]133 (p.16)
Bet you that the people in the Beehive don’t know what it means to be poor and to deal with racism. [Mokopuna Māori aged 14-16]133(p.22)
In the health system, institutional and interpersonal racism have also been extensively documented. This takes the form of Māori and Pacific peoples experiencing differential access to health care, receiving different quality of care and poorer health outcomes.
There needs to be an acknowledgement of the explicit and implicit biases and racism experienced in the system, which contribute to mistrust in the system.140(p.28)
The Whakatika report found 93% of Māori surveyed felt racism affects them every day. Respondents reported experiencing racism in daily life – such as when shopping, when te reo is mispronounced and when Māori are negatively portrayed in media images.131
International evidence shows repeated exposure to racism leads to accumulating disadvantage and poorer health outcomes over the life course.141 Experiences of racism and other forms of discrimination affect an individual’s health directly through stress-induced biological alterations and epigenetic changes. As the number of forms of discrimination a person experiences increases, the negative impact on their health increases.123
Ableism and disablism
In 2023, the Household Disability Survey estimated that 17% of people in Aotearoa New Zealand, or around 851,000 of us, are disabled.142 Women, older people, Māori and LGBTQIA+ people are more likely to experience disability than other groups.142,143
Despite on average being younger than the total population, Māori and LGBTQIA+ people have higher rates of disability than other groups. Pacific peoples are also more likely to experience disability than Pākehā, after adjusting for age differences between those populations.144
We [disabled people] are children, young people and adults, we are parents and grandparents. We are also friends, family and whānau. What we want is no different to anyone else in New Zealand; we want to belong, contribute to our families and whānau and participate in our communities.145(p.12)
Ableism and disablism refer to types of disability discrimination. Ableism favours people who are not disabled and discriminates against those with disabilities (whether those disabilities are visible or not).146 For example, ableism includes designing a building without a ramp or lift for people who need them, or having inflexible working options or workplace accommodation.
Ableism was present in our historical approaches to disability such as the segregation of disabled people into institutions, and the ‘medical model’ approach to disability.147 Ableism reduces disabled people’s opportunities and access to resources (such as housing and income), which affects their physical and mental health.
Disablism is an inherent belief that disabled people are inferior to people who are not disabled.148 Disabled people can experience disablism in the form of direct, conscious discriminatory or abusive acts, such as a disability slur, being ignored or being spoken to in a patronising way. In health care, discriminatory assumptions about disabled people can lead to ‘diagnostic overshadowing’. This means that new symptoms are attributed to a known disability instead of being investigated. It can also lead to ‘therapeutic pessimism’, where a disabled person is not offered a treatment because of their underlying disability.149
I want the [health system and mental health] system to start seeing my disability as my superpower, not my barrier.150
Aotearoa New Zealand has adopted the United Nations Convention on the Rights of Persons with Disabilities (UNCRPD) social model of disability.151 The social model encompasses a whole-of-life, strengths-based approach, looking at a disabled person’s strengths across their lifetime. While it recognises that individuals have impairments,vi it sees the disabling elements as being ableist systems, attitudes, and structures, rather than the impairment itself.145 These ableist systems drive inequities in access to determinants of health for disabled people and also create health system barriers.
Racism, colonisation and ableism are interconnected in New Zealand.147 Researchers and disability advocates have critiqued the often deficit, Western view of disability. This has failed to consider the ‘…disabling impacts of being disconnected from whakapapa, te reo Māori, tikanga and mātauranga Māori, and inability to access traditional lands, waters or marae.’152
[vi] An impairment means a functional limitation that prevents a person carrying out certain tasks and functions in their daily life without support. Common impairments include deafness, blindness or an inability to walk. Disablement occurs when a person with an impairment is not supported to take part on an equal basis with others. The social model places responsibility for this exclusion on systems, attitudes and environments, and not on the person with the impairment.
Discrimination based on sex, gender or sexual orientation
Despite being the first country to give women the vote in 1893, and decades after the ‘second wave’ of feminism in the 1970s,153 women in Aotearoa New Zealand continue to face disadvantage in some employment sectors. Women face an ongoing gender pay gap, which is even greater for Māori, Pacific and disabled women.154
In Aotearoa New Zealand, attitudes towards roles at home and in parenting are generally pro-gender equality. However, in reality women still carry out the majority of household tasks.155,156 The value of women’s unpaid work and caring is still largely ignored and economically undervalued (as is their paid work).
Single women, disabled women and women who are solo parents experience a higher level of material deprivation and poorer mental health than other women.157 Women also have much lower retirement savings than men.158 Many single parent households (most are led by women) report they experience stigma and discrimination.159
Women are more likely than men to suffer abuse from a partner (this includes repeat victimisation) and sexual violence.160,161 Women and girls experience disproportionate online harm, sexual harassment and economic harm. Economic harm can involve not having control over financial resources, having access to money withheld or being forbidden to attend school or work.160 These discriminatory experiences can manifest in poor mental and physical health outcomes.
Experiences of discrimination, harassment and violence based on sexual orientation are also well documented.123,162 Data from the 2023 Census shows that 1 in 20 adults (4.9%) identify as LGBTQIA+.143,163 The abbreviation MVPFAFF+ is also used in Aotearoa New Zealand.143 It encompasses diverse gender and sexuality expressions and roles across Pacific cultures:
- mahu (Tahiti and Hawaii)
- vakasalewa (Fiji)
- palopa (Papua New Guinea)
- fa‘afafine (Samoa)
- akava‘ine (Cook Islands)
- fakaleiti (leiti) (Tonga)
- fakafifine (Niue).
Experiences of discrimination in employment, housing, higher rates of violence from others and feeling less safe are associated with greater substance use and poorer mental health, especially for trans and non-binary people.164
Intersecting discriminations
The interaction of different forms of discrimination has increasingly been recognised as having cumulative negative impacts on wellbeing. For example, disabled, Māori or ethnic minorities who are LGBTQIA+ experience the compounding effects of intersecting discriminations.165 Recent research suggests that trans and non-binary disabled people, are more likely to experience discrimination, be verbally harassed, feel unsafe at school, be treated unfairly by government agencies and have poorer mental health outcomes.162,166
Our economic system
Our economic system is part of the bedrock – an important influence on multiple determinants of health and how they are distributed in our society.
Land ownership
Access to land is a key resource and source of wealth in Aotearoa New Zealand. In the 19th century, land owned by Māori substantially reduced, much through illegitimate sales, confiscation and alienation (Figure 4).28 By the 20th century, most firms and farms were owned by Pākehā families. New Zealand has since developed a market economy, made up of larger corporations and small commercial entities.167
Figure 4. Māori land loss between 1860 and 1939
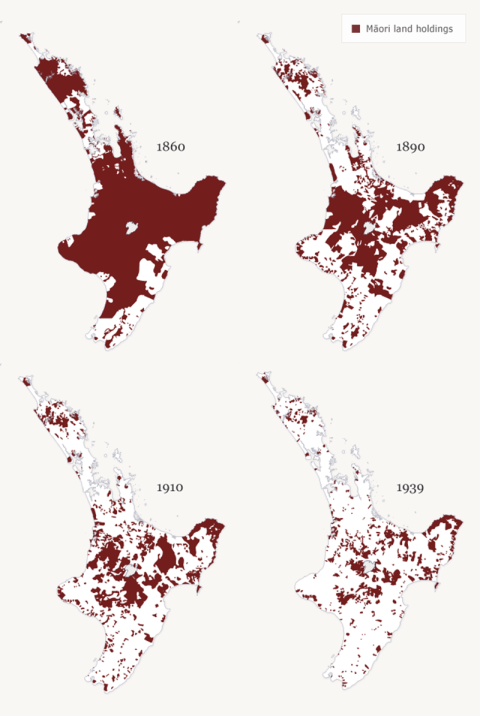
Source: Orange C. Te Tiriti o Waitangi | The Treaty of Waitangi. An Illustrated History. Wellington: Bridget William Books 2021.168
Changing economic models and the impact of neoliberalism
In response to economic depression and poverty in the 1930s, the government introduced greater regulation and state ownership of key utilities (such as electricity, telecommunications and public transport), alongside a developing welfare state (state funded health care, education and social benefits). This resulted in a mixed economic model. In the 1970s and 1980s, economic neoliberalism emerged globally. Neoliberalism is characterised by prioritisation of the ‘free’ (unregulated) market, an emphasis on economic competition, individual ‘freedom’ (market choice), and reduced social service provision by the state.169,170
As a result, rapid structural economic change took place in Aotearoa New Zealand from 1984 into the 1990s. This significantly reduced social housing and social benefits, led to high unemployment for Māori and young people, increased the number of people in casual employment, reduced real incomes for Māori and Pacific households and widened income inequality.169 These structural changes disproportionately impacted Māori and Pacific peoples and were associated with widening health inequities and plateauing of Māori and Pacific peoples’ life expectancy during the 1990s.171
Liberalising the economy has had ongoing effects that benefit some groups but substantially disadvantage many others. For example, one feature of neoliberalism is deregulation of the labour market, which reduces job security and work safety.
Unemployment is used as a tool to lower inflation, and this also has disproportionate impacts on young people, Māori and Pacific peoples.172,173 Unemployment is associated with having a lower income, housing insecurity, and poorer health and mental health outcomes.167,172 Some regions in Aotearoa New Zealand have experienced, and continue to experience, high rates of intergenerational unemployment, with different regions experiencing very different labour market cycles. For example, during labour market contractions, Northland’s unemployment rate typically increases by twice as much as Wellington’s.174
Income inequality and wealth
During the 1990s, income inequality rose sharply. Although this inequality was partly moderated by progressive taxation policies, the distribution of wealth remains highly skewed.62 While our taxation and transfer (social benefits) systems appear progressive and pro-equity when they are measured against taxable income, the Household Economic Surveys from 2015 to 2021 show that the wealthiest 10% of households hold around 50% of the country’s household financial assets. The poorest 20% of households hold only one percent of the country’s household net wealth.
The cost of living is a constant worry for me and my family.129
Research by the Treasury and Inland Revenue (IR) shows that our current taxation system results in the wealthiest three hundred families in New Zealand paying an effective tax rate that is less than half the rate that middle-income New Zealanders (such as people who work as plumbers or nurses) pay. IR found that wealthy New Zealanders usually get their income from return on investments; around 80 percent of their economic income is capital gains (which is untaxed in Aotearoa New Zealand).62,175
The purported benefits of free-market competition (such as lower costs to consumers) have often not materialised. For example, New Zealanders continue to spend a high proportion of their income on housing and food, reflecting our housing market’s failure to provide affordable homes, and the current supermarket duopoly.176,177 Almost two in five people in Aotearoa New Zealand today find it hard to meet every day costs;178 two-thirds of New Zealanders do not feel ‘well off’, and one in four sometimes do not have enough to eat.179
Neoliberalism and healthism
Collective values underlie the rationale for social safety nets and the ‘social contract’ that Aotearoa New Zealand has aspired to. However, neoliberalism values individual agency and personal choice over collective action. It puts less emphasis on reciprocity and collective social obligations.169,180
Neoliberal views of health (known as ‘healthism’) advocate that individuals have the power and responsibility to manage their own health. Although this is partially true, healthism fails to recognise how structural factors discriminate against some groups, and affect individuals’ behaviour and choices (see below How determinants affect us).181,182
For example, agricultural and food industries shape our environment and economy in ways that encourage us to consume more affordable but less healthy foods. By focusing on individualism, healthism also ignores evidence that social cohesion has a positive impact on population health and other social wellbeing outcomes (such as, better personal safety and less crime).183,184
Summary
The bedrock elements which drive the maldistribution of resources in our society today are not random nor fixed. For example, discrimination and colonisation can be addressed through legislation and the social policies the government chooses to implement; our economic system can be modified. To improve our collective health and eliminate health and wellbeing inequities, positive elements in our bedrock need to be enhanced, and the negative influences addressed.
How determinants affect us – individual and collective mechanisms
Social and environmental exposures influence health in many ways. This may be directly – for example, a higher risk of infectious diseases for children living in crowded housing – or indirectly, for example living in an area with a high density of alcohol and fast-food outlets, which influences peoples’ drinking and eating patterns. In this section we summarise what we currently know about the ways in which determinants of health may affect our individual and collective health through biological and physiological mechanisms. We examine some of the mechanisms by which social and environmental exposures ‘get under the skin’.
Epigenetics
Epigenetics refers to how our environment can cause changes that affect the way our genes work. We inherit more than just DNA from our parents. Genes in the DNA sequence have epigenetic markers that switch our genes ‘on’ or ‘off’.185 We now know that gene sequences do not translate directly into our physical characteristics (phenotypes), and that changes to genes can occur because of changes in our environment such as stress, air pollution or what we eat. These environmental factors generate changes in genes that can then be transmitted across generations.
‘Bodies express our ecology…’186
These epigenetic changes affect cellular functions, physiology and how our bodies work. Epigenetic changes are reversible – they do not cause genes to mutate (to change the DNA sequence), but they can change how the body ‘reads’ the DNA sequence.185
Epigenetics change as we develop and age, because we have differential exposure to environmental factors over the course of our lives.26 Pregnancy and early childhood are particularly important periods, because the brain develops rapidly at those times (this is known as ‘neuroplasticity’).110 Our epigenetics continue to change over the course of our lives in response to our changing environmental exposures.26
Today, we recognise that the human genome cannot be seen in isolation from the environmental determinants of health and the genomic implications of non-human life that surrounds and is part of “us”.187
Environmental factors can cause changes in parents’ epigenetic markers that can be passed on to their children. They can also alter gene expression in a foetus after fertilisation and during the infant’s development in utero. Environmental exposures before and during pregnancy are particularly important for the child’s health and subsequent risk of chronic diseases (such as obesity, type 2 diabetes and cardiovascular disease) in later adulthood.110,188
For example, if a pregnant woman has limited access to healthy food during pregnancy, her unborn child may also experience suboptimal nutrition and consequently have poorer metabolic health as a child.188 Parental exposure to alcohol, tobacco, or other drugs at the time of conception or during pre-birth development increases the child’s risk of behavioural, physical and mental health issues that may be lifelong. Conversely, ensuring good nutrition and protection from unhealthy exposures during pregnancy has lifelong benefits for children’s health.110
Toxic stressors
Developmental research and longitudinal studies, including studies in Aotearoa New Zealand,107,108 have demonstrated the effects of ‘toxic stress’ on health. Toxic stress describes what happens when our physiological stress-response system is activated excessively or for a prolonged period. Toxic stress is a response to an experience of severe stress, such as witnessing or experiencing neglect or violence (often called an adverse childhood experience (ACE)). This stress reaction can affect many aspects of physiology, including brain development, and the immune, nervous and endocrine (hormone) systems. It is also associated with an increased risk of many chronic diseases in later life.189,190
We know also that parent or caregiver attachment and bonding, play and interactive reading are important for children to develop ‘executive functions’ – including the ability to learn, exert self-control and show empathy.191 These functions influence children’s subsequent educational achievement, interpersonal relationships, and mental health.
Research has also examined the impact that stressors such as discrimination and racism have on health. While structural discrimination can affect access to health determinants like employment (see Discrimination), an individual’s experience of discrimination is itself a potent biological stressor.43,66 The links between self-reported racial discrimination and mental and physical health outcomes have been well documented. Research indicates that reported exposure to discrimination is associated with poor mental health, adverse cardiovascular outcomes, excess body weight and high blood pressure.
The evidence about how epigenetics and stressors contribute to health and wellbeing shows that even health issues that we tend to think are due to our DNA or family traits are influenced by wider determinants of health. But toxic stressors can be prevented or removed. And just as epigenetics are changed by negative environmental factors (such as experiencing racism, poverty, pollution or poor diet), they can also respond to positive changes in the environment. Human and animal studies show that epigenetic changes can persist across multiple generations.103 Therefore, distributing these positive factors more fairly across society gives us the potential to interrupt multigenerational cycles of ill health.
Socioeconomic patterning
Another way that determinants of health affect the health of communities is through socioeconomic ‘patterning’ of health-damaging factors. For example, in Aotearoa New Zealand, material poverty, ethnic segregation, poor-quality housing and homelessness are often concentrated in the same spaces.124,192 Communities that experience material deprivation also encounter layers of other health-damaging factors. Compared to wealthier areas, communities experiencing material deprivation have above average numbers of fast-food outlets, alcohol off-licences, and gambling and vaping outlets.193-197 They also tend to have higher rates of air pollution, poorer public transport and lower access to green space.194,198,199 This illustrates the cumulative, complex relationships between our environment and our health.200 [See the ‘Healthy Location Index Story Map’ in section 3].
The collective experience
The effect of a negative economic environment on population health outcomes and health equity (the ‘collective’ experience) is also well documented. For example, the collapse of the USSR had an adverse effect on total population mortality and health inequalities in Russia and some East European countries in the 1990s.201,202 More recently, life expectancy for the least privileged 20% of men in the UK has significantly declined since 2011,96 while life expectancy in most European countries has also flattened. These trends are associated with economic austerity, unemployment, rising obesity rates and the COVID-19 pandemic.96,203 These negative factors have disproportionately affected people who live in Europe’s most socioeconomically deprived communities.204
The continued improvements in life expectancy in five countries [Norway, Iceland, Belgium, Denmark, and Sweden] during 2019–21 indicate that these countries were better prepared to withstand the COVID-19 pandemic. By contrast, countries with the greatest slowdown in life expectancy improvements after 2011 went on to have some of the largest decreases in life expectancy in 2019–21. These findings suggest that government policies that improve population health also build resilience to future shocks. Such policies include reducing population exposure to major upstream risks for cardiovascular diseases and neoplasms, such as harmful diets and low physical activity, tackling the commercial determinants of poor health, and ensuring access to affordable health services.204
Aotearoa New Zealand’s collective experience has also been researched. As noted above, the 1980-1990s was a period of rapid structural economic change, when social housing declined, unemployment amongst Māori and young people increased, casual employment increased, the real income of Māori households fell, and income inequality rose.205 Despite life expectancy of the total population increasing between 1980 and 1999, inequities in mortality increased. The gap between Māori and Pacific peoples, and non-Māori, non-Pacific peoples progressively widened.171,205 For example, the gap between life expectancy at birth for Māori men and that of non-Māori, non-Pacific men increased from 6.3 years in 1980 to 9.9 years by 1999.
During the following decade (2000–2010) incomes and employment improved, and the life expectancy gap reduced. However, large absolute and relative disparities between the health and mortality of Māori and Pacific peoples, and that of non-Māori, non-Pacific peoples, have persisted, particularly related to some cancers and diabetes.206
3. How is Aotearoa New Zealand tracking?
Trends in determinants of health and in health outcomes
In this section we look in more depth at trends in some critical determinants of health and in health status, where possible looking back to the year 2000. The aim of our analysis is to assess progress in these areas, and as importantly, to understand any changes in the absolute or relative differences between population groups for these indicators over the period.vii
We identified relevant indicators of determinants from wellbeing and health equity monitoring frameworks developed here and internationally.207-209 We assess differential progress in a selection of these indicators (by ethnic group, age, disability, gender and/or socioeconomic deprivation, where applicable). We then describe trends in inequities in selected health and wellbeing outcomes over the same period.
We acknowledge that these data have important limitations and represent only a part of the rich and complex daily experiences of life for people in Aotearoa New Zealand. It is also important to note the limitation of univariate analysis (that is, analysis of one indicator at a time). As we increasingly understand the interconnectedness and intersectionality of determinants and health outcomes, this likely underestimates the compounding disadvantage experienced by those most affected by inequities.
Data that we have sourced on determinants of health are publicly available from many sources (Appendix 4). The main sources of data are the Census and national surveys. These data have many limitations, including the quality of ethnicity data collection. Over time there have been changes in questions that are asked and the extent of coverage. The various data collections may also define groups differently (e.g. for disability, by total or prioritised ethnicity). These limitations are further discussed in Appendix 4.
[vii] Absolute inequality reflects the magnitude of difference in an indicator between two subgroups (and retains the same unit of measure as the indicator). Relative inequality measures show the proportional differences for an indicator among subgroups.
Trends in key determinants of health 2000-2024
Income
There is a strong association between income and health status.210,211 Income provides access to resources like adequate housing and healthy food to support wellbeing.
The stress that can result from a lack of financial security for households is harmful to health. Material poverty in childhood is associated with poorer cognitive, behavioural and health outcomes, and negatively influences opportunities for education, adult income and employment, and health outcomes through the life course.212,213
In Aotearoa New Zealand, the median individual weekly income increased between 2008 and 2024 for people of all ethnic groups. There was a persistent gap between ethnic groups, with median weekly income from wages and salaries for Europeans $200 higher than for Pacific peoples and $173 higher than for Māori in 2024 (unadjusted for inflation), with no change in this absolute difference between 2008 and 2024 (Figure 5).
Women have lower median hourly earnings than men. The gender pay gap decreased from 16.2% in 1998 to 8.2% in 2024 but varies for different groups of women.214 In 2024 the gender pay gap (compared with all men) for wāhine Māori (15%), Pacific peoples (17%), and disabled women (14.2%) was significantly higher than for European women (3.6%).154,215,216
Figure 5. Individual weekly median income from wages and salary by total response ethnicity, 2008 to 2024
Use arrow keys to navigate the key indicator items.
- Download
- Download dataset
- Source
Stats NZ Aotearoa Data Explorer. Household Labour Force Survey
Household incomes also increased from 2007-2021, after accounting for inflation. Real incomes increased more in absolute terms for higher income households than low-income ones, but there was a slightly bigger relative increase for low-income households.217 This may be explained by increases in hours worked by low-income families, increases in Working for Families Tax credits and the indexation of Superannuation for older people.
For households with low income, housing costs take up a large proportion of income, so it is important to examine income after housing costs (AHC) have been considered. Low-income households with children saw smaller income increases than other low-income households after housing costs were included.217
Data on household income by ethnicity is only publicly available from 2020. This recent data available mirrors inequities in individual income data by ethnicity. The annual household incomes for Māori and Pacific peoples remained around 20% lower than for Europeans from 2020 to 2024.218 Median income after housing costs for Māori, Pacific, Asian and European households with children showed an approximately 35% real (CPI-adjusted) gain between 2007 and 2023, but with persistent inequities between ethnic groups.219
The Household Disability Survey (2023) found higher levels of income inadequacy for disabled people. Just under half (47%) of disabled people lived in households that reported enough or more than enough household income, in contrast to 67% of non-disabled people.142
Income inequality
Greater income inequality at a national level is associated with poorer health and wellbeing outcomes and larger health inequities, although the mechanisms for this are debated.119,220,221 Life expectancy, infant death rates, child maltreatment, obesity and mental health outcomes have been shown to be poorer in societies with greater income inequality.221 Conversely, reducing income inequality has potential benefits for society as a whole, as well as for those whose material circumstances are improved.222,223
Aotearoa New Zealand experienced large increases in income inequality in the late 1980s and 1990s, and this inequality has largely persisted.224,225 The Gini co-efficient is a measure of income inequality (from zero reflecting perfect equality to 1, where all the income would belong to the top income group). Income inequality peaked in 2015, with a Gini co-efficient of 0.41 (after housing costs), then decreased slightly to 0.37 in 2024. However, income inequality remains high compared with the 1980s.
Income inequality is greater when income after housing costs is considered, compared with income before housing costs (Figure 6). As noted above, this is because housing costs generally make up a greater proportion of household income for lower-income households than for higher-income households.
Figure 6. Gini coefficient before and after housing costs for Aotearoa New Zealand, 1982 to 2024
Use arrow keys to navigate the key indicator items.
- Download
- Download dataset
- Source
Table D.9 in Perry, B (2019), Household Incomes in New Zealand, Ministry of Social Development, Wellington, with updates provided for 2019-2024.
Child poverty
Child poverty in Aotearoa New Zealand is understood as ‘exclusion from the minimum acceptable way of life (standard of living) in one’s own society because of inadequate resources’.219 The Child Poverty Reduction Act (2018) established a framework for measuring and reporting child poverty, which includes a variety of measures. The Ministry of Social Development produces comprehensive reports on child poverty and Stats NZ summarises data with analysis related to the Act’s targets.219,226
Material hardship represents the proportion of children living in households who report that they cannot afford 6 or more of 17 basic essential items, such as not having adequate clothing or having to go without fresh fruit or vegetables to keep costs down. Material hardship rates were high in the years after the 2008 Global Financial Crisis, with marked inequities. 47% of Pacific peoples’ children and 36% of tamariki Māori experienced material hardship in 2010-2012, well over double the rates for Asian (16%) and European (18%) children (Figure 7).219
Following this, rates of material hardship fell quickly for European and Asian children but more slowly for other ethnic groups. Between 2013 and 2024, rates of material hardship were 2 to 3 times higher for tamariki Māori and 3 to 4 times higher for Pacific children than European children. Thus, although the proportion of children in material hardship has decreased since 2010-2012, and there have been important reductions in absolute inequities, the increase in relative inequity suggests that child poverty initiatives did not have as much impact for tamariki Māori and Pacific children as European children.
Figure 7. Material hardship rates for children by total response ethnicity, for year ended June 2007 to June 2024, in three-year groupings to 2018
Use arrow keys to navigate the key indicator items.
- Download
- Download dataset
- Source
Ministry for Social Development (MSD) - updated analysis provided by MSD for Table 3 in Perry, B. (2024).[220] Child Poverty in New Zealand. Wellington: Ministry of Social Development.
In the year ended June 2024, 156,600 children (13.4% of all children) were living in households experiencing material hardship.226 Although numerically the largest number of children experiencing material hardship are European children, Pacific peoples and Māori children are disproportionately affected. Nearly one in three Pacific children and one in four tamariki Māori experience material hardship, compared to one in ten European children.
One consequence of poverty with clear health impacts is when household food runs out. In the New Zealand Health Survey, this measure of food insecurity for children is assessed by asking households with children if they run out of basics (such as bread, potatoes, etc.) due to insufficient money. Rates of food insecurity have increased in the last two years to very high levels, with data from 2023/24 finding that it impacts over a half of Pacific children, over one third of tamariki Māori and about one in five Asian and European children.227
Work
Satisfying work provides adequate income, provides for opportunities and skills, and supports whānau and households. Work influences health in other ways, for example through social status, participation in society and workplace safety.228 Unemployment is strongly associated with poorer mental health, including low self-esteem, anxiety and depression, but also with stress-related conditions like heart disease.172,229
In the year to December 2024, 71.3% of the working age population were in the labour force. The labour force comprises both employed and unemployed people. Those not in the labour force may be involved in other activities such as studying, caring for children or other adults, household work, voluntary work, sickness/injury/disability and free-time activities.230 The definition of ‘unemployed’ by Stats NZ is quite narrow: a person does not have a paid job, has been available in the previous week to start work and has been actively seeking work in the last four weeks, or be due to start a new job in the next four weeks.231
Unemployment rate
The unemployment rate is the proportion of unemployed people (as defined above) in the labour force. In the year to December 2024, the unemployment rate was 4.7% (that is, 144,900 people).231 Stats NZ also report an underutilisation rate (11.7%, or 370,500 people in the year to December 2024), which includes people who are unemployed, those who would like to work more hours than they do and people who are potentially available to work but not actively seeking employment.232 This partly reflects the development of precarious employment in Aotearoa New Zealand over the last decades – work which is temporary, insecure and/or poorly paid.233
Peaks of unemployment occurred in the early 1990s associated with the neoliberal economic reforms, and from 2008 following the Global Financial Crisis. Unemployment rates increased slightly with the effect of the COVID-19 pandemic, then fell to their lowest point in several years in 2022, before rising sharply in 2023 – 2024.234
The unemployment rate varies by age, disability, ethnicity, gender and region. For over three decades, young people have consistently had high unemployment rates, up to six times the rate of other age groups. For people aged 15 to 24 years, the annual unemployment rate to December 2024 was 14.1% (61,700), while it was 2.8% (15,900) for people aged 45 to 54 years.231
Annual unemployment rates to December 2024 for Māori (9.2%) and Pacific peoples (9.6%) were over double those of Asian (4.5%) and European (3.8%). Particularly high rates of unemployment are seen for young Māori and Pacific peoples. Annual unemployment rates to December 2024 for Pacific peoples and Māori aged 15-24 years were 22.5% (10,100) and 19.1% (19,800) respectively.231
Between 2008 and 2024 annual unemployment rates for Māori and Pacific peoples have been approximately two to three times that of European New Zealanders, although there was a slight narrowing of absolute inequities (Figure 8).
Figure 8. Annual unemployment rate by total response ethnicity, 2008 to 2024
Use arrow keys to navigate the key indicator items.
- Download
- Download dataset
- Source
Stats NZ Household Labour Force Survey
The unemployment rate and the underutilisation rate of disabled people is more than double that of non-disabled people. In the quarter to June 2024, over one in 4 disabled people (26.3%) were either unemployed, wanted to work more hours or were potentially available to work but not actively seeking employment (i.e. the underutilisation rate) compared with 11.3% of non-disabled people.235
Not in Employment, Education or Training (NEET)
As the unemployment rate considers only those in the labour force, there is a broader measure for young people (15-24 years) who are not in employment, education or training (NEET).236 In the year to December 2024, 85,500 young people (12.8% of 15-24 year olds) were considered NEET, with Māori (19.5%) and Pacific peoples (18.9%) having higher NEET rates than Asian (10.7%) and Europeans (10.3%). There has been no improvement in the NEET rate in the last 10 years, with an increase seen in the last year (Figure 9). An analysis of NEET in Auckland in 2018 showed rates were highest for those aged 20 to 24 years and slightly higher for females than males.237
Figure 9. Young people aged 15-24 years who are not in employment, education or training (NEET) by total response ethnicity, 2008 to 2024
Use arrow keys to navigate the key indicator items.
- Download
- Download dataset
- Source
Stats NZ Infoshare.
Education
Educational attainment is a key determinant of future employment and income, and of health status.238 Trends in education outcomes since 2000 show persistent differences in educational experience for students of different socioeconomic and ethnic groups. Historically the education system has reflected our colonised society and been a tool for cultural suppression rather than meeting Māori aspirations for education.239 Attendance and qualification trends for New Zealand students are presented below. More in depth reports, such as those on engagement with school, reasons behind low attendance and experiences of racism, offer further insights into the education system.133,240,241 The data highlight concerning trends in attendance that have become apparent in the last decade, and particularly in the last four years.
Early Childhood Education (ECE) participation
Prior participation in Early Childhood Education (ECE) measures the proportion of children starting primary school who have regularly attended early learning in the previous six months. There has been significant investment in ECE since 2000. Figure 10 shows an increase in attendance from 2000 to 2019 with a narrowing of the difference between ethnic groups. However, since that time, attendance has fallen, with widening of the gap between ethnic groups.
Figure 10. Proportion of children attending Early Childhood Education for the 6 months prior to starting school by total response ethnicity, 2000 to 2024
Use arrow keys to navigate the key indicator items.
- Download
- Download dataset
- Source
Ministry of Education
Similarly, participation in ECE for younger children aged 3 and 4 years peaked in 2019 and then fell considerably in 2020-2021. It has remained at lower levels since, with 67% of all children, 56% of Māori, and 53% of Pacific peoples’ children aged 3 participating in ECE for 10 or more hours a week in 2023.242
School attendance
School attendance is linked to student attainment and wellbeing.243,244 Regular participation in primary and secondary schools (students who have attended more than 90% of the term) has declined in recent years.245 However, unlike in ECE, where the decreased participation seems to be associated with the COVID-19 pandemic, the decline in regular school attendance started in 2015, with another steeper drop in 2021-2022.245 Regular attendance improved in 2023 and 2024 but is still not at pre-pandemic levels, with 39% of Māori, 41% of Pacific peoples, 66% of Asian and 55% of European students attending school regularly in term 2 of 2024 (Figure 11a).
There are differences in school attendance between students who have few, moderate and more socioeconomic barriers to achievement, as measured by the School Equity Index (EQI).246 Only 42% students from schools with more barriers to achievement and 68% of students with fewer barriers attended school regularly in 2024. This mirrors trends in attendance seen in previous years using school decile as the variable of analysis.247
Attainment of NCEA
Attainment of Level 2 NCEA or above increased between 2009 and 2020 and then fell for all ethnicities. The latest available data from 2023 shows 58% of Māori and 70% of Pacific school leavers gained at least NCEA Level 2 qualification or equivalent (Figure 11b). For the total population of school leavers, 74% of school leavers gained at least NCEA Level 2 in 2023, which is the lowest it has been since 2013. This reduction in attainment since 2020 is likely to be related to the significant fall in attendance since the COVID-19 pandemic.248
Attainment of a secondary school qualification is associated with future labour force status and income. For example, just under 70% of those with no school qualification, 50% of those with level 1 NCEA and 33% of those with Level 2 NCEA were classified as NEET in their first year after leaving school.249
Figure 11a. Proportion of students attending school 90% or more of the time by total response ethnicity in term 2, 2011 to 2024
Use arrow keys to navigate the key indicator items.
- Download
- Download dataset
- Source
Ministry of Education
Figure 11b. School leavers with Level 2 NCEA or higher by total response ethnicity, 2009 to 2023
Use arrow keys to navigate the key indicator items.
- Download
- Download dataset
- Source
Ministry of Education
On average, school leavers who are male, who are from schools with more barriers to achievement, or who identify as Māori or Pacific peoples, are more likely to leave school without NCEA Level 2 or above. However, Māori students who attend Māori-medium education have similar levels of NCEA Level 2 attainment to non-Māori at English-medium schools and a higher proportion of these students remain at school until at least aged 17 years.250
Kaupapa Māori education
The proportion of Māori students attending Māori-medium education (defined as when the curriculum is taught in te reo for more than 50% of the time) has declined since 2004 for ECE but increased for primary and secondary schools (Figure 12).
The proportion of tamariki Māori attending Māori-medium ECE (out of all tamariki Māori that attend ECE) has been steady at around 20% for the last decade, having fallen from 33% in 2004. The proportion of tamariki Māori attending Māori-medium schools is lower than in ECE. However, it increased between 2014 and 2024 from 12% to 15% for primary and 5% to 7% for secondary schools. This corresponded to 25,895 Māori learners in Māori-medium schools in 2024.251
Figure 12. Māori attending Māori-medium education out of all Māori attending education, 2004 to 2024
Use arrow keys to navigate the key indicator items.
- Download
- Download dataset
- Source
Ministry of Education
Homes
Research in Aotearoa New Zealand shows strong evidence for the health and wellbeing benefits of housing security, a warm, dry and safe home, and the importance of appropriate design to meet the intergenerational and cultural needs of whānau.192,252-256
Insulated, well-designed housing reduces energy costs and household crowding, but also related illnesses from damp and mouldy housing, such as asthma, respiratory infections, rheumatic fever and chronic conditions.257-259 In this way, the marked inequities in housing measures below correlate strongly with inequities observed in these and other health outcomes.
Home ownership
In Aotearoa New Zealand, home ownership is associated with security of tenure, income and wealth, and affordability. Deposit affordability and mortgage serviceability indicators have decreased markedly since 2004 (by -30% and -15% respectively), with small improvements in 2024.260 Historically, home ownership in Aotearoa peaked in 1991, with 73.8% of households owning their own home, but there were large differences by ethnic group. Home ownership declined to 64.5% in 2018, the lowest level since 1951.261
There was a marginal increase in home ownership from 2018 to 2023, with 66% of households owning their own home by 2023, but this gain was not evenly distributed. Housing tenure for Pacific peoples’ households declined from 35.1% in 2018, to 34.2% in 2023. For all other ethnic groups there were small increases in housing tenure in 2023 with 72.2% of European, 60.7% of Asian and 48.6% of Māori households owning their home.262
Household crowding
Crowding can affect physical and mental health and is a risk factor for many infectious diseases.257,259 Household crowding is determined by comparing the number of bedrooms a household needs (based on the occupants’ age, gender and relationship status) and the number of available bedrooms.263 The number of people living in crowded houses in Aotearoa New Zealand increased from 389,600 (10.0%) in 2006 to 560,637 (12.1%) in 2023, with increases across all ethnic groups (Figure 13).
Since 2006, household crowding rates for Pacific peoples have reduced slightly but they continue to experience the highest rates of crowding. Thirty-eight percent of Pacific peoples lived in crowded households in 2023, over six times the rate for Europeans. Rates of crowding for Māori increased from 20% in 2013 to 23% in 2023, which was 3.7 times that of Europeans (a fall from 4.7 times the rate in 2013). Between 2013 and 2023 rates of crowding increased for Europeans from 4% to 6% and decreased for Asians from 18% to 16%. There is also significant regional variation in household crowding.264
Figure 13. Number of people living in crowded households, by total response ethnicity, 2006 to 2023
Use arrow keys to navigate the key indicator items.
- Download
- Download dataset
- Source
Census, Aotearoa Data Explorer; Stats NZ
Identity and Indigeneity
Indigeneity is increasingly conceptualised as a determinant of health, encompassing determinants of health that are specific to indigenous peoples.265 Strong cultural connections are key contributors to a sense of identity and to wellbeing. Shared collective experiences, values and strengths of Indigenous communities, including cultural connectedness, participation, traditional ceremony, and language preservation, can promote health and are protective against some of the negative outcomes of the social determinants of health. 29,265 There is a strong positive relationship between individual mental wellbeing and whānau wellbeing for Māori.266
Here we have chosen capacity to speak te reo and recognition of iwi affiliation as relevant indicators that are currently available. We recognise these inadequately represent Māori experience, and that broader and more meaningful indicators, and the quality of data collection, need further development.
Iwi affiliation
The number of Māori recorded as being affiliated to at least one iwi increased by 46% between 2013 and 2023 (Figure 14). In addition to population increases, the redesign of the iwi affiliation question in the 2023 Census enabled whānau Māori to reflect their whakapapa more accurately and appropriately.
Figure 14. Number of Māori affiliated to the ten largest Iwi, 2013 and 2023
Use arrow keys to navigate the key indicator items.
- Download
- Download dataset
- Source
Te Whata / Census 2023
Te reo Māori
Census data indicate an increase in the number of Māori speaking te reo. In 2023, 182,001 Māori said they could have a conversation about everyday things in te reo, an increase of 45% from 2013.144 This reflects the substantial increase in Māori population between 2013 and 2023, so although the number of Māori who could have a conversation in te reo increased, the proportion decreased slightly, from 21.0% to 20.5% (Figure 15).
Opportunities to learn te reo have become more widely available in Aotearoa New Zealand in recent years. For example, the number of school students in Māori-medium schools and those learning Māori language in English-medium schools increased from 2019 to 2024, while the number of students with no Māori language education decreased over the same time period.251
Figure 15. Number and proportion of Māori who speak te reo Māori, 2001 to 2023
Use arrow keys to navigate the key indicator items.
- Download
- Download dataset
- Source
Census, Aotearoa Data Explorer
Social connections and trust in institutions
There is increasing evidence that high-quality social connections are essential to mental and physical wellbeing, with poor social connection associated with increased risk of cardiovascular disease, hypertension, diabetes, infectious diseases, impaired cognitive function, depression, and anxiety.267 Surveys generally measure self-reported rates of loneliness or connectedness. Likewise, trust in public institutions is an important indicator of social cohesion.
Loneliness
Loneliness was first assessed in the New Zealand Health Survey in 2016/17 and then annually from 2020/21. Loneliness (self-reported feeling of loneliness some, most, or all of the time in the past four weeks) is higher for females than males, for disabled than non-disabled people and for young adults compared with older adults.
There are high rates of loneliness among disabled people, with the New Zealand Health Survey of 2023/24 finding that one in three disabled people experienced loneliness some, most, or all of the time in the previous four weeks.76 This was three times the rate of non-disabled people. The rate of experiencing loneliness some, most, or all of the time in the 2023/24 New Zealand Health Survey was also 1.4 times higher for Māori and for Pacific peoples than for non-Māori, after adjusting for age and gender.
Loneliness varies by age, with young people aged 15 to 24 years having the highest rates. For most age groups, there was a marked increase in loneliness from 2016/17 to 2021/22 (Figure 16). One of the contributing factors to loneliness is likely to be the COVID-19 lockdowns, the subsequent decrease in social interactions and increase in online education and remote working. Other reasons for increased loneliness could be related to changes in community and family structures, with more people living alone, and increased use of technology that may provide less meaningful social interactions.
Figure 16. Lonely some, most, or all of the time by age group, 2016/17 and 2020/21 to 2023/24

Source: New Zealand Health Survey
Trust in institutions
Levels of trust in Parliament, as measured by the General Social Survey, have been low over the last decade. They fell further between 2021 and 2023, with only 16% of Māori, 27% of Europeans and 34% of Pacific peoples saying that they had high levels of trust in Parliament (scoring 7 to 10 out of 10) in 2023 (Figure 17a).
Figure 17a. Proportion of people with high (7 to 10 out of 10) levels of trust in Parliament, by total response ethnicity, 2014 to 2023
Use arrow keys to navigate the key indicator items.
- Download
- Download dataset
- Source
General Social Survey
Figure 17b. Proportion of people with high (7 to 10 out of 10) levels of trust in health institutions, by total response ethnicity, 2014 to 2023
Use arrow keys to navigate the key indicator items.
- Download
- Download dataset
- Source
General Social Survey
Levels of trust in health institutions are high compared with trust in Parliament, but there has been a gradual decline in trust in health institutions for people of all ethnic groups from 2014 to 2023 (Figure 17b). Less than half of Māori (43%) and Europeans (49%) rated their trust in health institutions as high in 2023, falling from 57% and 68% respectively in 2014.
The Kiwis Count Survey measures trust in public services each year.268 This covers any public service provided by central government, such as health, education, transport, and social assistance. In 2025 this survey found levels of trust related to the most recent experience of contact with a public service were high (80%), but lower for young people <25 years and disabled people. Levels of trust in public services in general increased significantly for all ethnic groups between 2019 and 2020, fell quite sharply in 2021 and have plateaued at about 50% for Māori and Pacific peoples, 60% for Europeans and 70% for Asian peoples. These levels remain higher than those reported before the COVID-19 pandemic.268
Trust within communities
People need to feel a sense of belonging and worth, to participate and be accepted: these things hold communities and societies together and are critical to health and wellbeing. The General Social Survey results indicate a decline in the trust held for other people since 2014, particularly between 2021 and 2023. In 2014, 55% of Māori and Pacific peoples held high levels of trust (scoring 7 to 10 out of 10) for other people, but this dropped to 40% of Māori and 42% of Pacific peoples by 2023 (Figure 18). The declining levels of trust in recent years are consistent with the findings of a recent report that social cohesion in New Zealand in 2024 was lower than in Australia on every measure.179
Figure 18. Proportion of the population with high (7 to 10 out of 10) levels of trust for other people by total response ethnicity, 2014 to 2023
Use arrow keys to navigate the key indicator items.
- Download
- Download dataset
Environment and climate
Our health and wellbeing are intertwined with our physical environment and our sense of connection to place. As well as providing us with a place to live, the taiao shapes our cultural values, practices and sense of identity. While Aotearoa New Zealand has areas of extraordinary beauty and richness, our land, water and air quality are at risk from a range of activities, including intensive farming of dairy cattle, urban developments, high car ownership, and invasive plants and animals.17 Higher global temperatures are linked to increased frequency and intensity of extreme weather events, putting the environment under further strain. These trends highlight significant risks to the health and wellbeing of our communities.
Climate change
Human-induced changes in Earth’s ecosphere have important implications for environmental and human health. Changes in temperatures, rising sea levels and increased extreme weather events have impacts on a broad range of health determinants including physical environments, housing, food security, water security and mental health and wellbeing.269
Temperature
Temperatures in Aotearoa New Zealand are expected to increase in line with global warming, with implications for weather patterns, local ecology, agriculture and other human-environmental interactions.
Figure 19. Aotearoa New Zealand’s annual average temperature anomaly, 1909 to 2022
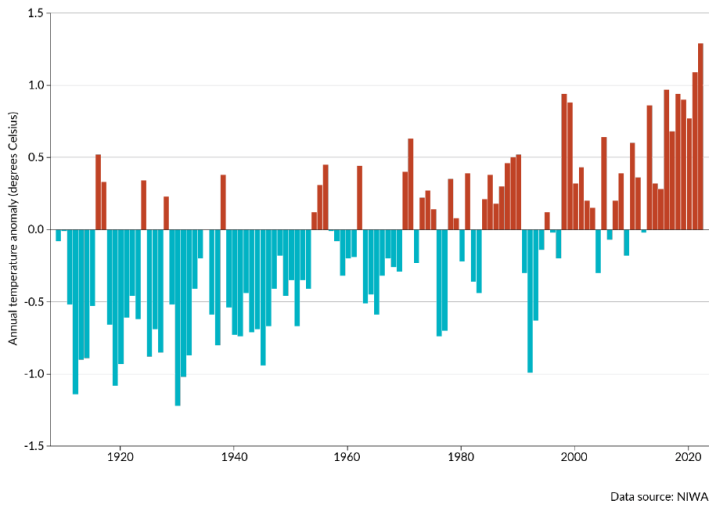
Note: The baseline for temperature anomalies is the average annual temperature for the 30 years from 1961 to 1990.
Source: Ministry for the Environment & Stats NZ 2023, page 24.270
The 2023 report from the Intergovernmental Panel on Climate Change (IPCC) confirms that greenhouse gas (GHG) emissions are causing global warming, with the global surface temperature now 1.1°C higher than it was in 1850-1900.271 Projected GHG emissions to 2030 make it very likely that warming will exceed 1.5°C at some point in the 21st century.271 Figure 19 shows the increase in annual temperatures in Aotearoa New Zealand in the last century.
Glaciers
Fluctuations in annual glacier ice volumes are sensitive indicators of climate change. Between 2005 and 2023, the decrease in total volume of glacial ice in New Zealand accelerated, with a 42% reduction (from 52.3 km³ to 30.3 km³>).272
Greenhouse Gas Emissions (GHGs)
As part of the Paris Agreement and the United Nations Framework Convention on Climate Change, the Ministry for the Environment reports on New Zealand’s greenhouse gas emissions (GHGs) annually.273 Aotearoa New Zealand’s gross GHG emissions peaked in 2006, stayed relatively stable until 2019 and declined over the subsequent four years (Figure 20). While heading in the right direction, the gross emissions in 2023 were still 13% higher than in 1990.273
Figure 20. New Zealand’s gross and net emissions from 1990 to 2023
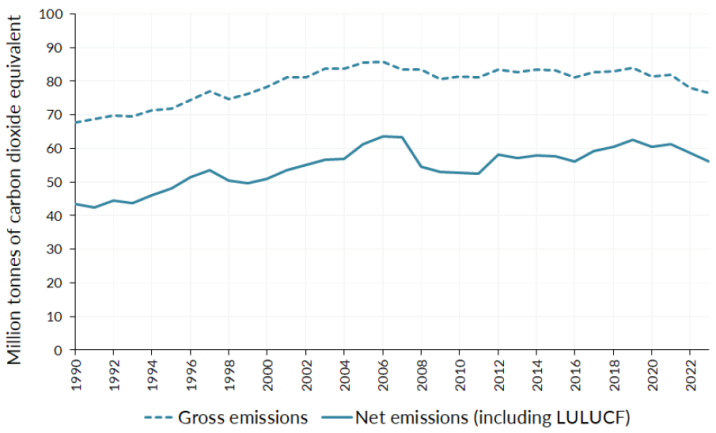
LULUCF - Land Use, Land-Use Change and Forestry
Source: Ministry for the Environment 2025 page 7.273
The key sources of Aotearoa New Zealand’s GHG emissions are our dairy industry, power generation, and road transport. In 2023 almost half (48%) of our GHG emissions were made up of methane, which comes primarily from large populations of livestock. There has been a significant increase in dairy cattle herds in the last 20 years.17 Farming is also associated with use of synthetic fertiliser which is a major source of nitrous oxide, comprising almost 10% of our GHG emissions.
Power generation and road transport are the main sources of carbon dioxide, which represents over 40% of GHG emissions. Road transport contributes the largest share of carbon dioxide emissions, which also contribute to urban air pollution, and thus directly affect health. Carbon dioxide emissions from road transport increased by 84.5% between 1990 and 2023, peaking in 2008.273 We have a relatively high rate of vehicle ownership compared with other OECD countries,274 and a relatively old vehicle fleet (the average age of light vehicles was 14.9 years in 2022)275 Electric and petrol hybrid vehicle numbers have increased since 2016 but still made up only 1.6% and 3.8% of the light vehicle fleet respectively in 2022.274
Interconnections in place
Although in this section we have presented trends in individual determinants, we know that within the same community, in the same place, there are important intersections and connections between determinants. This results in multiplying effects on health and wellbeing.
Figure 21. Socioeconomic deprivation and Healthy Location Index map, Kerikeri
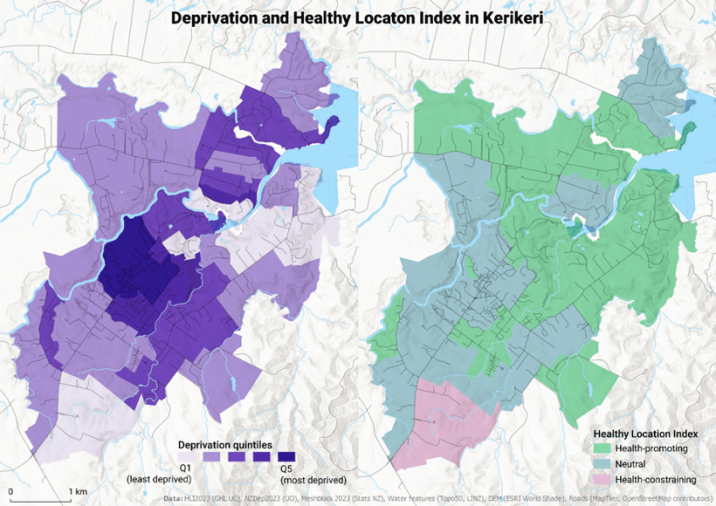
Summary
Several key themes emerge from these data and the trends seen since 2000. Despite absolute gains across many determinants such as income and education, and reductions in some absolute inequalities, there have been limited or no change in the relative differences (privilege or disadvantage) between ethnic and socioeconomic groups for many socioeconomic indicators.
Of concern, housing measures are showing increasing inequities for Pacific peoples, and housing affordability and household crowding measures are not significantly improving for any population group. Although the overall reduction in child poverty and in absolute inequalities up to 2023 is good news, there has been an increase in relative inequities for Māori and Pacific children compared with European children. In some areas, for example school attendance and attainment, social connection and trust in government, climate and environmental measures, the indicators are heading in the wrong direction for all population groups. What we also see are inter-dependencies and intersections between determinants, with some groups of people experiencing multiple disadvantage, and subsequently significantly poorer health outcomes.
Trends in health indicators 2000-2024
The health of the tōtara branches and fruit, like our health and wellbeing, depends on nourishment from the soil and bedrock. The following section illustrates trends in selected health status indicators since 2000, examining these by ethnic group, and by socio-economic status, disability and gender where available. We look at changes in relative and absolute differences in varied health outcomes between population groups, reflecting the differential access each group has to the resources that support us to flourish.
Life expectancy and life expectancy gap
Life expectancy is the average number of years a baby born today in a particular population is expected to live, assuming they experience the current age-specific death rates of that population during their life.15 Life expectancy in Aotearoa New Zealand increased for the whole population between 2001 and 2022, from 81.2 to 84 years for females and 76.7 to 80.5 years for males. Increases were seen for all population groups (defined by sex, geography, ethnicity and socioeconomic status). At the same time, disparities between these groups persisted (Figure 22).15
Between 2001-2003 and 2020-2022, life expectancy increased faster for Māori than for Pacific peoples and non-Māori/non-Pacific people, with a 20% reduction in the 8.3 years gap seen in 2001-2003 between Māori and non-Māori/non-Pacific people. However, in 2020-2022 there remained a significant absolute gap in life expectancy of 6.6 years between Māori and non-Māori/non-Pacific people.
Life expectancy for Pacific peoples increased to 77.8 years in 2018-2020 but then dropped slightly to 77.3 years in 2020-2022 (Figure 22). This meant that the life expectancy difference increased between Pacific peoples and non-Māori/non-Pacific people over the period, from the 5.8 years gap in 2001-2003 to 6.1 years in 2020-2022.
Figure 22. Longitudinal trends in life expectancy by prioritised ethnicity, 2001 to 2022, three-year aggregated estimate

Source: Health New Zealand Te Whatu Ora, 2024, Life Expectancy in Aotearoa, page 8.15
Life expectancy for people with intellectual disability is considerably lower than for people without intellectual disability. Estimates for 2017-2019 show a gap of 15 years for males and an 18-year gap for females.276 Māori with intellectual disability have the lowest life expectancy across ethnic groups, with a life expectancy of 61.9 years.276
The New Zealand Index of Deprivation (NZDep) is an area-based measure of socioeconomic deprivation.viii Life expectancy is lower for people living in the most socioeconomically deprived neighbourhoods, compared with more advantaged neighbourhoods, with a gradient effect. Over half of Māori and Pacific peoples live in the most socioeconomically deprived areas (NZDep deciles 8-10). In addition, at any given level of socioeconomic deprivation, Māori and Pacific peoples have a lower life expectancy than non-Māori/non-Pacific people (Figure 23).15
Figure 23. Life expectancy by New Zealand Index of Deprivation (NZDep) quintile, by prioritised ethnicity Māori and non-Māori/non-Pacific, 2018-2022

Source: Health New Zealand Te Whatu Ora, 2024, Life Expectancy in Aotearoa New Zealand, page 32.15
This difference increases as socioeconomic deprivation increases. In 2018-2022, Māori living in the most socioeconomically deprived areas had a life expectancy of 74.2 years, whereas non-Māori/non-Pacific people living in areas with the same level of deprivation had a life expectancy of 81.6 years, a gap of 7.4 years (Figure 23). This relationship is also seen for Pacific peoples, with a 4- to 5-year difference in life expectancy compared with non-Māori/non-Pacific people across all deprivation quintiles. The greater negative relationship of socioeconomic deprivation and life expectancy for Māori and Pacific peoples may be explained by the relationship operating between coloniality, racism and socio-economic deprivation.52,115
[viii] The New Zealand Index of Deprivation (NZDep) combines Census data across 8 variables (communication, income, employment, qualifications, home ownership, support, living space and dwelling condition) to give a measure of the socioeconomic deprivation level of an area. A socioeconomic deprivation decile or quintile is calculated for each small area; it does not apply to individuals or households. Each decile contains about 10% of small areas and each quintile contains about 20% of small areas in Aotearoa New Zealand. Decile 1 (and quintile 1) represent the 10 and 20% of areas respectively with the least deprived scores. Decile 10 (and quintile 5) represent the 10 and 20% of areas with the most deprived scores.
Infant and child mortality
Aotearoa New Zealand has relatively high rates of children who die in the first five years of life compared with other OECD countries.277 Infant mortality (defined as the death of a baby between birth and one year of age) decreased in Aotearoa New Zealand in the 1990s, followed by a slowing of that reduction from around 2000.278
There were 300 infant deaths registered in Aotearoa New Zealand in 2022, a rate of 5 deaths per 1,000 live births. These deaths were not evenly distributed. Noting that numbers are small, infant mortality rates have remained higher for Pacific and Māori infants than Asian and non-Māori/non-Pacific/non-Asian (nMnPnA) infants since 1999-2000, as shown in Figure 24.
Figure 24. Infant mortality rates by prioritised ethnicity, 1999-2022
Use arrow keys to navigate the key indicator items.
- Download
- Download dataset
- Source
Mortality Collection.
The infant mortality rate for Pacific peoples’ infants decreased from 1999-2000 but only until 2011-12, when it started to rise again. In 2021-22, Pacific peoples had the highest infant death rate at 7.8 per 1,000 births, followed by Māori (6.3 per 1,000 births), Asian (4.7 per 1,000 births) and nMnPnA (4.3 per 1,000 births).
Between 1999-2000 and 2021-2022, the inequity in infant mortality for Māori infants reduced both in absolute and relative terms. In 2021-2022 it was 1.5 times higher than rates for infants of nMnPnA ethnicity, compared with 1.9 times higher in 1999-2000.
In the period 2014-2018, infant mortality rates of infants living in the most deprived areas were over double the rate of those in the least deprived areas.278 The Perinatal and Maternal Mortality Review Committee in 2024 identified considerable preventable mortality, particularly for groups experiencing the most disadvantage. The Committee recommended that different approaches to care are required for different population groups in order to improve infant survival.279
There have also been persistent differences in mortality rates by ethnicity and socio-economic deprivation level for children aged 1 to 14 years. Since 1990-91, death rates in children aged 1 to 14 years have declined for all socio-economic groups, but have consistently been 2 to 4 times higher for those living in the most socioeconomically deprived areas, compared with the least deprived areas.278
Deaths from heart disease, stroke and the circulatory system
Mortality rates from heart disease, stroke and diseases of the circulatory system halved from 2000 to 2020. There have been important improvements in absolute inequities, especially between Māori and non-Māori/non-Pacific/non-Asian peoples (nMnPnA). However, relative inequities persist. Māori and Pacific mortality rates have remained about double those of nMnPnA ethnic groups and are similar to the nMnPnA rates of 25 years ago (Figure 25).
Figure 25. Mortality rates related to diseases of the circulatory system* by prioritised ethnicity, WHO age standardised, 2000-2020
Use arrow keys to navigate the key indicator items.
- Download
- Download dataset
- Source
Mortality Collection.
Much of the improvement in cardiovascular mortality is related to reduced smoking rates, monitoring and control of cholesterol and blood pressure, and improved interventions for diagnosis and treatment (such as angioplasty and thrombolysis).280 The reductions in cardiovascular mortality rates have occurred despite rises in the prevalence of excess body weight and diabetes.
Estimated prevalence of type 1 and type 2 diabetes
The Virtual Diabetes Register estimates the number and proportion of people with type 1 and type 2 diabetes in the Aotearoa New Zealand population at any point in time (prevalence).281 We do not currently have a measure of the number of people with type 2 diabetes, but it is a large proportion of the total (international figures suggest around 90%). Onset is usually at an older age than type 1 diabetes.282
Figure 26. Estimated prevalence of diabetes (type 1 and type 2) by prioritised ethnicity, WHO age standardised, 2013 to 2023
Use arrow keys to navigate the key indicator items.
- Download
- Download dataset
- Source
Virtual Diabetes Register, Health New Zealand
There has been an increase in age-standardised diabetes prevalence from 36.6 per 1,000 people in 2013 to 44.3 per 1,000 people in 2023. However, diabetes is much more common in some populations: 126 per 1,000 for Pacific peoples, 103 per 1,000 for Indian and 72 per 1,000 for Māori (Figure 26). Diabetes is also more common in populations living in the most deprived neighbourhoods (74 per 1,000 people in 2023) compared with the least deprived (28 per 1,000 people in 2023).281
The rising incidence (new cases) and prevalence of diabetes parallels increases in excess body weight (EBW). Aotearoa New Zealand has worrying rates of EBW, with the third highest rate of countries in the OECD.283 While we acknowledge the limitations of body mass index (BMI) measurement, it provides a pragmatic tool to assess changes in population EBW.284 In 2023/24 one in three (33.8%) adults had a BMI of 30 or over, compared with 17% in 1997.285 In 2023/24, two thirds (66.9%) of adults were considered to have EBW (BMI 25 or more), with this disproportionately affecting those living in the most deprived neighbourhoods (where 78.5% had a BMI ≥25).227
Psychological distress
Psychological distress has risen in the last 10 years, with a particularly marked increase for young adults. The New Zealand Health Survey reports that the proportion of 15- to 24-year-olds experiencing high or very high psychological distress in the previous four weeks increased more than fourfold between 2011/12 and 2023/24, from one in twenty (5.1%) to more than one in five (22.9%) young people (Figure 27).227
Rates of psychological distress are higher in women than men (Figure 28) and show an inverse relationship with age (Figure 27). Nearly one third (30%) of women aged 15 to 24 years reported experiencing high or very high psychological distress in the previous four weeks in the 2023/4 New Zealand Health Survey.227 When people experience high levels of psychological distress, it affects the whole whānau and can have intergenerational impacts.286
Figure 27. Experienced high or very high psychological distress* in the past 4 weeks by age group, 2011/12-2023/24
Use arrow keys to navigate the key indicator items.
- Download
- Download dataset
- Source
New Zealand Health Survey
Reported psychological distress has risen for all ethnic groups since 2019. Approximately 1 in 5 Māori and Pacific peoples, 1 in 11 Asian and 1 in 8 nMnPnA people experienced high or very high psychological distress in the previous four weeks in 2023/24. These data are not standardised for age, so the very high prevalence of psychological distress in Māori and Pacific peoples at least partially reflects the higher proportion of younger people in those populations. Rates of psychological distress are also higher for people living in areas of high socioeconomic deprivation (16.9%), compared with the least deprived areas (10%).
Figure 28. Adults experiencing high or very high psychological distress* in the past 4 weeks by gender 2011/12-2023/24
Use arrow keys to navigate the key indicator items.
- Download
- Download dataset
- Source
New Zealand Health Survey
Figure 29. Experienced high or very high psychological distress* in the past 4 weeks by disability, 2018/19-2023/24
Use arrow keys to navigate the key indicator items.
- Download
- Download dataset
- Source
New Zealand Health Survey
Disabled people have higher rates of psychological distress than non-disabled people, with increasing prevalence in both groups over time (Figure 29). In 2022/23 over a third of disabled people reported experiencing high or very high psychological distress in the previous four weeks. Levels were slightly lower in the most recent survey (2023/24).
Psychological distress is also higher in disabled children with one in three disabled girls (34%) and nearly one in four disabled boys (23%) consulting their GP or nurse about mental health in 2023/24, a much higher rate than non-disabled children (girls 4%, boys 5%).227
Child oral health
Oral health is important for overall health and wellbeing. Poor oral health is associated with many health conditions such as diabetes, stroke and mental health.287 In this section we focus on child oral health but note that oral disease in Aotearoa New Zealand is also common in adults. There are higher rates in people living in rural and socioeconomically deprived areas, and for Māori and Pacific peoples, with ensuing high social and economic costs.288,289 A review of potentially preventable hospital admissions for treatment of dental disease notes persistent disparities between Māori and Pacific peoples, and nMnPnA ethnic groups over time.288
In Aotearoa New Zealand, the Community Oral Health Service (COHS) provides free dental care from birth until the end of Year 8 (aged 12-13 years) but service coverage has been declining since 2000. By 2022, COHS coverage was 55% for 5-year-olds and 74% for Year 8 students and varied by geographic location and ethnicity.290 This low coverage limits our analysis of the situation. However, post COVID lockdowns, COHS focused on children at highest risk of dental caries. We do not know the oral health status of those children missing out, and those missing out may disproportionately be from least advantaged populations.
Figure 30. Children aged 5 years with dental decay (caries) at examination with the Community Oral Health Service, by prioritised ethnicity, 2002–2022
Use arrow keys to navigate the key indicator items.
- Download
- Download dataset
- Source
New Zealand Child and Youth Epidemiology Service. From Tustin et al 2024, Fig 5.6, page 232[92]
For the 5-year-old children seen by COHS between 2000 and 2022 there was a small decrease in rates of dental decay for Māori and non-Māori/non-Pacific and an increase for Pacific peoples’ children (Figure 30). However, rates of dental decay in these populations remain high, affecting nearly two thirds of Māori (61%) and Pacific peoples (66%) children and one third (34%) of non-Māori/non-Pacific children at the COHS 5-year check. For all children aged 5 to 9 years the rates of hospitalisations for dental decay more than doubled between 2000 and 2022, suggesting oral disease is being inadequately prevented and addressed in a timely way in our communities.290 Fluoridation of water supplies is an evidence-based intervention that can help reduce the persistently high and inequitable rates of tooth decay in Aotearoa New Zealand.291
Health risk factor: smoking
Smoking increases the risk of many conditions including cardiovascular disease, lung cancer and respiratory conditions. Reductions in death and illness from these conditions are linked to reduced smoking rates.280 The proportion of adults who smoke daily (and have smoked more than 100 cigarettes in their life), as estimated by the New Zealand Health Survey, decreased steadily over the last decade. Rates more than halved in all ethnic groups and there was a large 24.5 percentage point drop for Māori. However, the rate in the last two years has plateaued at 6.9% (2022-24), and there are still inequities in smoking rates (Figure 31). Daily smoking prevalence rates remain well above the 5% goal for Māori (14.7%), Pacific (12.3%), those living in the most socioeconomically deprived areas (13.9%) and for disabled people (10.2%).292
Figure 31. Daily smokers (have smoked more than 100 cigarettes in lifetime and currently smoke at least once a day) by total response ethnicity, 2006/07 and 2011/12-2023/24

Source: NZ Health Survey
New Zealand introduced world-leading legislation in 2022 to support reducing daily smoking prevalence in all population groups to under 5%. The legislation included initiatives for a generational smoking ban, reducing the nicotine levels in cigarettes and reducing the number of retail outlets. These initiatives were repealed in 2024, despite concerns that their removal would have impacts on the effectiveness and equity in smoking reduction.293,294 There is concern that Aotearoa New Zealand’s revised smoking plan lacks measures that make it easier for populations to reach the 5% goal.292,295 For example, the current plan does not include adequate regulations around retail access and product content (e.g. reduced nicotine levels).296
Health risk factor: vaping
Intended by policymakers as an aid to support smoking cessation, easy access to vaping has had some undesired effects. Although declines in smoking have been positive, there has been an even greater and more rapid increase in vaping, particularly by young people. Over a three-year period (2019/20 to 2022/23), the proportion of adults aged 15-24 years who vaped daily increased from 4.3% to 22.1%.40,297
The widespread use of vaping is a new phenomenon, and the full extent of the health risks are not yet known. However recent studies have confirmed the association between vaping and significantly increased risk of respiratory problems, with doubling of chronic obstructive pulmonary disease (COPD) and increased rates of high blood pressure in people who vape aged over 30 years.298
Figure 32 shows the proportion of adults who vape by ethnicity (note that the data are not age-standardised so the higher proportion in Māori and Pacific peoples at least partially reflects the higher proportion of younger people in those populations). There was a steep increase in vaping rates from 2019/20, and the rates increased faster for Māori and Pacific people than for Europeans. In 2023/24, the daily vaping rates for adults over 15 years were particularly high for Māori (28.8%), Pacific peoples (21.5%), disabled people (12.5%) and those living in the most socioeconomically deprived areas (19%).
The ASH Year 10 Survey in 2024 of students aged 14-15 years similarly found very low rates of daily smoking but a dramatic increase in daily vaping between 2019 and 2021, when it reached approximately 10%. Daily vaping rates in this age group dropped slightly to 8.7% in 2024.297
Figure 32. Adults who vape daily by total response ethnicity, 2017/18-2023/24
Use arrow keys to navigate the key indicator items.
- Download
- Download dataset
- Source
New Zealand Health Survey
Conclusion
Overall, many health outcomes have improved since 2000 – but more for some people than for others. We live longer, and there have been important reductions in some causes of early death and disability, such as cardiovascular disease and some cancers, along with reductions in absolute inequities. The positive impact of the large reductions in smoking rates and decrease in inequities in smoking across all ethnic groups, are to be celebrated. These reductions have contributed significantly to the reduction in cardiovascular disease, stroke, chronic lung disease, lung cancer and other conditions over the last three decades.
However, relative inequities in many other health indicators are entrenched. Infant and child mortality in Pacific peoples and in more socio-economically deprived communities is very concerning, with no reduction apparent in Pacific infant mortality in the last two decades. Rates of excess body weight have flat-lined or increased. The population prevalence of diabetes is rising, with very unequal impact. There have been increases in absolute inequity for Pacific peoples, and no real change in inequities for Māori and Indian people, compared with all other ethnic groups.
Our mental health is significantly poorer, especially for young people. While there have been some improvements in health-damaging behaviours like smoking and harmful drinking, vaping is at high levels in young people, with marked ethnic inequities.
Overall, there are significant persistent differences in health between population groups, many of which are preventable.15,70 While there has been improvement on some measures, Māori continue to disproportionately experience poorer health outcomes. And for Pacific peoples, many indicators show no change or even worsening of absolute and relative inequities. These inequities have a huge cost, not just in terms of illness and disability for children and whānau, but also for our future prosperity and wellbeing as a nation.23
For additional indicators and our overall ‘score card’, see Appendix 4 and online Appendix 7.
4. Looking forward: a threatened forest
Since the NHC published its report on determinants of health in 1998,8 the relationships between health and income, employment, education and housing have been further researched and documented, both in Aotearoa New Zealand and overseas. This work has confirmed that these factors – alongside social cohesion, cultural identity and Indigeneity – are vital to our health and wellbeing.5-7,29,93 In this section, we consider some new and emerging influences that are increasingly shaping our access to resources for health.
The significant influence of commercial actors and processes on health – the ‘commercial determinants’ – has been more widely acknowledged and studied in recent years, with a particular focus on those industries whose activities negatively affect health (for example, alcohol, tobacco products, fossil fuels and ultra-processed foods (UPF)).170,299
Two ‘megatrends’16,300 are increasingly recognised as critical to our future health and wellbeing: the climate crisis, and the digital environment, particularly the rapid development of artificial intelligence (AI). These megatrends will increasingly influence patterns of access to other resources for health, such as employment and income, as well as more directly impacting on our health and wellbeing. We briefly examine below the commercial determinants of health and impacts of the climate crisis on health and equity.301-303 We then explore some of the potential benefits and challenges for population health of AI and changes in the digital environment.
Commercial determinants of health
A commercial entity is generally defined as one that buys and sells goods or services for profit or a return on investment.304 Our economy includes a range of commercial entities, from small private-sector businesses and NGOs, through to state-owned enterprises and transnational organisations. The ownership, control, purpose and functions of these commercial entities varies widely.
Commercial entities can contribute positively and negatively to human health and equity. The ways that commercial actors influence health and equity are known as the ‘commercial determinants of health’.304 As an example of ‘pro-health’ business, nearly 200 leading financial institutions globally (managing more than US$16 trillion of assets) have pledged to support tobacco-free policies across their lending, investment and insurance portfolios.305 Many businesses in Aotearoa New Zealand, including those in primary industries, also have a strong focus on sustainability, wellbeing of employees and protecting the environment.306
Commercial systems strongly influence other determinants of health such as employment, transport, food systems, and increasingly, health care. The interconnections between our current economic system, some of the more damaging commercial determinants, and negative impacts on the environment (environmental degradation, biodiversity loss, and climate change) have also become very clear.307
Products and practices that directly affect health
There is increasing evidence that some commercial entities – particularly large transnational corporations – use practices and promote consumption patterns that are escalating the rate of non-communicable diseases, climate change, and social and health inequity on a global level. The scale of the problem is large. In 2019, the Global Burden of Disease study estimated that four industry sectors (tobacco, ultra-processed foods, fossil fuel and alcohol) account for at least one-third of global deaths.170
Factors such as occupational exposures (for example, to pesticides, asbestos or dust), shift work and other employment practices are also important components of the impacts commercial determinants have on health. For example, some manufacturing industries have lobbied for less stringent regulatory and enforcement standards, which has contributed to weaker labour and employment practices, environmental damage, and poorer workplace safety both in Aotearoa New Zealand and internationally. Ultimately this has led to workers dying and had health consequences for nearby communities.170,308
Protecting intellectual property (IP) is another way that commercial interests affect health. For example, while the pharmaceutical industry has made a huge contribution to health by producing lifesaving medicines, it has also restricted access to essential drugs and vaccines to secure high prices, despite massive public investment in developing those products.170
Compared with other businesses, extractive industries such as mining disproportionately consume or harm natural resources (a form of ‘negative externality’) for the value they generate to shareholders and investors. 309 This imbalance has social and geographical dimensions, since extractive activities often occur in less affluent areas while business owners and investors are more likely to live in wealthy and urban areas.310 Turning natural resources into commodities often degrades the environment, for example by affecting water and soil quality.299
Commercial entities – especially in the food, alcohol, tobacco and mining industries –influence policy and political decisions, through lobbying, political donations and misinformation.304,311 In Aotearoa New Zealand, the tobacco industry successfully lobbied for the repeal of the Smokefree Environments Regulated Products (Smoked Tobacco) Amendment Act 2022 in early 2024. This Act had introduced three evidence-based measures: decreasing tobacco supply, denicotinising tobacco and introducing a smokefree generation policy by progressively increasing the age at which tobacco could be legally sold to someone.294,312-314
In addition to having the Act repealed, the industry also successfully lobbied for sales of snus, oral nicotine pouches and snuff to be legalised, arguing for customer ‘choice’.294
[ix] ‘Hazardous drinking’ is as an established pattern of drinking that carries a high risk of damage to physical or mental health, or harmful social effects on the drinker or others. It is determined by using the World Health Organization's AUDIT checklist – a score of 8 or more indicates hazardous drinking.
The climate crisis
Climate change is one of two ‘megatrends’ increasingly recognised as critical to our future health and wellbeing.300 The climate crisis will have significant negative effects on Aotearoa New Zealand in the next 15 years. These effects include increased temperatures, changing rainfall patterns, and increasingly frequent and severe extreme weather events. These effects will cut across most determinants of health, including housing, income, employment, education, transport, infrastructure, food security and water quality.270,322
We expect the effects of the climate crisis will compound existing inequities, as they will disproportionately affect communities that are already vulnerable. For Māori, this includes potential interruptions to whakapapa and connection to whenua.303,323-325
Direct effects of the climate crisis on health
The effects of climate change are already bringing new and increasing hazards to Aotearoa New Zealand in the form of flooding, extreme weather events, extreme heat and heatwaves, drought, fire danger, sea-level rise and coastal inundation.270,303,326
These hazards carry risks that directly affect our health (Figure 33):303
- Floodwater increases the risk of drowning, injuries, gastrointestinal diseases and illness.
- Flooding and severe weather events damage homes, which can cause multiple health problems (such as mental health issues, respiratory problems from mould, infectious diseases from overcrowding).
- Flooding and severe weather events affect facilities and services that people rely on for their health and wellbeing (such as schools and ECE, primary health care, aged care, marae and urupā).
- Sea-level rise and severe weather events damage infrastructure that people rely on for their health and wellbeing (such as roads, communications, and water, electricity and gas).
- These hazards significantly affect mental health, particularly after repeated adverse events.327,328 Mental health impacts are disproportionately felt by the most affected communities (for example, Pacific communities in south Auckland, and rural communities in Tairāwhiti and Hawkes Bay affected by Cyclone Gabrielle and severe weather events in 2023).328
Figure 33. The impact of climate change on health

Source: Health National Adaptation Plan 2024-2027, Ministry of Health (2024)
Text description
Flowchart showing a cycle of:
- increasing CO2 levels
- food supply impacts – malnutrition, diarrheal disease
- environmental degradation – forced migration, civil conflict, mental health impacts
- rising temperatures
- extreme heat – heat-related illness and death, cardiovascular failure
- severe weather – injuries, fatalities, mental health impacts
- more extreme weather
- air pollution – asthma, cardiovascular disease
- changes in vector ecology – malaria, dengue, encephalitis, hantavirus, Rift Valley fever, lyme disease, chikungunya, West Nile virus
- rising sea levels
- water quality impacts – cholera, cryptosporidiosis, campylobacter, leptospirosis, harmful algal blooms
- increasing allergens – respiratory allergies, asthma.
Indirect effects of climate change on health
Increasingly other effects of climate change will indirectly affect our health. These effects include poorer air and water quality; drought; introduction of vector-borne diseases, more pollens and allergens; and greater ultraviolet light (UV) exposure. Poorer air quality increases premature mortality from respiratory and cardiovascular diseases; and poorer water quality and reduced availability increases the risk of contracting water-borne diseases (such as giardiasis, cryptosporidiosis and campylobacteriosis) and food-borne diseases (such as salmonellosis).329 These diseases can cause economic disruption, large outbreaks of illness and even deaths (such as was seen in outbreaks of campylobacter in Havelock North in 2016330 and of cryptosporidium in Queenstown in 2023).331
Climate change is already disrupting our social and economic systems. Severe weather events are costly – the Treasury estimates Cyclone Gabrielle and the Auckland floods of 2023 together cost between $9.5 and $15.3 billion.332,333 These events will increasingly impact on our primary industry (what and where we can produce food), our employment and incomes, and our housing and communities (including reactive or managed relocation from areas that will no longer be habitable).334
Climate change will disproportionately impact communities who live near rivers and the coast – which is most of us. Mean sea level in Aotearoa New Zealand is projected to rise by at least 10 cm by 2040 from 2020.335 Currently 750,000 people live in areas of Aotearoa New Zealand that are already exposed to extreme flooding.322,329,334 These areas include major urban centres and 500,000 buildings that collectively are worth more than $145 billion.
It is predicted that ‘insurance retreat’ - where insurers will no longer insure coastal properties at risk of inundation from sea level rise – will soon affect most properties currently within coastal inundation zones that have a current ‘one in a hundred year’ risk of flooding.335 A partial insurance retreat could be expected within a decade (with less than 10 cm of sea level rise). Modelling predicts a full insurance retreat is likely within 20 to 25 years, with timing dependent on the property’s elevation and distance from the coast. This will not only have implications for relocation of people and the health and cultural impacts of this, but also large effects on the housing market and broader economy.334,335
Different vulnerability to the effects of climate change
While everyone in Aotearoa New Zealand is affected by climate change, some groups are particularly vulnerable to climate-related hazards. These groups include children, older people, disabled people, people with chronic health conditions, Māori, Pacific peoples, people who live in rural or socioeconomically deprived areas, and people who work in primary industries.324,329 For today’s children and young people, the psychological and mental health impacts of the climate crisis are already well described.336
Māori and Pacific peoples are disproportionately at risk of negative climate change impacts, including exacerbation of existing socioeconomic inequities,323 because of the industries many are working in (particularly primary production) and current socio-economic circumstances.323
Climate change also poses risks to Māori culture, by reducing or restricting people’s access to whenua and taonga species, which will have an enduring effect on whakapapa, kaupapa and tikanga Māori.323,325 Displacement from whenua that is vulnerable to climate change may also disrupt Māori sharing location-specific mātauranga Māori and tikanga practices, and affect social cohesion and identity.269,325 Impacts from severe weather events may also have significant spiritual impacts, for example through disruptions to urupā (graveyards), as seen after Cyclone Gabrielle.337
The effects of the climate crisis on the Pacific region
Accelerating sea rise, ocean warming and acidification are major threats for Pacific nations. Despite accounting for just 0.02% of global emissions, the Pacific islands are uniquely exposed to climate events. Their average elevation is less than two metres above sea level. Ninety percent of the population live within 5 kilometres of the coast and half the infrastructure is within 500 metres of the sea.338 Climate change impacts include significant threats to cultural wellbeing and mental health, as well as greater risks from vector-borne and water-borne diseases, such as dengue and malaria.339,340
Aotearoa New Zealand’s close relationship with Pacific Island countries - including the significant populations of Pacific peoples who live here and our legal obligations to Cook Islands, Niue and Tokelau - mean that we need to consider how to support impacted communities, including potential needs for relocation and migration.341
Strategies to mitigate and adapt to climate change
As Figure 33 illustrates, the effects of climate change pose multiple risks to health outcomes. Therefore, implementing strategies to mitigate climate change (that is, to reduce greenhouse gas emissions, prevent air pollution and reduce global warming) can benefit both the environment and health. However, any strategies we use to mitigate and adapt to climate change must be monitored for equity. These are discussed further in our recommendations (Section 6).
Mitigating and adapting to climate change
- Mitigating climate change involves taking actions that will reduce or prevent greenhouse gas emissions from human activities. These actions include transitioning to renewable forms of energy, using energy more efficiently, adopting regenerative agricultural practices, and restoring forests and critical ecosystems. To effectively mitigate climate change, we need to make structural changes that will reduce emissions and limit global warming to 1.5°C above pre-industrial levels.342
- Adapting to climate change involves taking actions that make us less vulnerable to the current and expected effects of climate change (such as extreme weather, rising sea levels, biodiversity loss, and food and water insecurity). Measures – many of which need to happen at the local level – include planting more drought-resistant crop varieties, adopting regenerative agricultural practices, improving how we store and use water, managing land better to reduce the risk of wild fires, and building stronger defences against floods and heat waves.343
AI and other digital determinants of health
Despite the many benefits of the online environment – for work, study, socialising, shopping and entertainment, and information – the negative effects of social media, online marketing and misinformation on our health and wellbeing have become increasingly clear. There are also still important differences in access and digital literacy across our communities.
Online groups have contributed to hate speech, racism and violent extremism, sometimes targeting marginalised individuals.344,345 For young people, social media is associated with experiences of cyber-bullying, exposure to racism and discrimination, and anxiety.346,347 Prolonged periods online are associated with reduced physical activity. Online marketing to children of ultra-processed food and alcohol is associated with health harms,319,348,349 and misinformation on the internet associated with more people refusing vaccinations.350,351
AI is already widely used in smartphones, facial recognition technology, internet search engines and data analysis tools in business, agriculture and health systems. However, the rapid emergence of generative AI (such as ChatGPT in November 2022) and recent advances in other technologies have significant implications for global economies and societies.7,16
Given that generative AI is advancing so rapidly, the scale and timing of its impact on the economy, employment, society and the environment – and, therefore, on our health and wellbeing – is uncertain. However, the consensus is that AI will have a major impact.352 Some of its potential benefits and challenges are already evident. A critical issue is how we use AI to enhance societal wellbeing, democracy, health and equity and our economy, while also protecting against its adverse effects.353
In this section, we consider the impact that current and emerging AI is likely to have on health determinants, and some possible scenarios, risks and challenges.
Effects of AI on economic growth and productivity
If used properly, AI tools have the potential to unlock enormous amounts of data, creating new opportunities to increase economic prosperity and significantly improve lives.354 However, these gains make take years or decades to emerge. More cautious estimates suggest that generative AI could increase growth in labour productivity in Aotearoa New Zealand by just one percentage point a year. By 2038, this would add $76 billion to GDP.355
Aotearoa New Zealand’s economy is based on exports, and 80% of exports are agricultural. To stay competitive and innovative in the global market, AI will be critical to our primary production sector. AI is likely to give us advantages in resource management and monitoring (for example, water, chemicals and pesticides use), land management (for example, livestock, planting and irrigation), soil management and supply chain logistics.356 It has the potential to make primary production more efficient and profitable.
Effects of AI on employment
The impact that AI has on employment will depend on the pace that technology changes, the type of employment affected, and whether AI will help or replace workers. In the US, it is predicted that up to 30% of all hours worked will be ‘replaced’ by AI by 2030.18
The first industries and occupations to be rapidly affected by AI are likely to be those characterised by repetitive tasks and low complexity. For example, many office tasks can be easily automated by AI. US and European studies suggest 13–14% of current jobs will be replaced by AI in the short term, particularly in banking, finance, administration, secretarial, sales and manufacturing.18 Based on recent surveys in Aotearoa New Zealand, these sectors are increasingly affected here.357
In 2023, a Datacom survey of 200 large firms in Aotearoa New Zealand found that 48% of businesses were using AI; this had grown to 66% within one year.358 By March 2025, the AI Forum was reporting 82% of firms were using AI tools (a 15% increase in use in six months), along with a small reduction in jobs and some effect on new hiring of staff.357 Most of this increase appears due to incorporating ‘off the shelf’ AI tools like ChatGP and Perplexity into existing operations, rather than developing new AI tools.357
AI may also create new job opportunities, but the transition to these roles may not be easy for everyone, potentially leading to greater social and unemployment inequality.
The adoption of generative AI is unequal, indicating that it could be a skill-biased technology that exacerbates existing inequalities. On the other hand, generative AI tends to provide greater productivity improvements for workers who earn less to begin with, implying that it could also have an equalising effect if used by those workers with the most to gain.359
Within five years, a wide range of tasks across multiple sectors (including the public service, health and social care, engineering and science, and culture and media) are likely to be performed by AI. As some of these sectors have a disproportionate number of female workers, estimates suggest this change is likely to have a greater impact on women.18 It may also affect younger and older age groups, and disabled people differently.
In the next decade, the potential number of employees [in Aotearoa New Zealand] facing job disruption in the 45 to 49-year-old group is sobering…at least 30% of the tasks of managers, professionals, technicians, machinery operators and drivers, 40% of the tasks of sales workers, and 50% of the tasks of clerical and administrative workers will be effectively done by AI. Across the workforce…10% replacement by AI would equate to nearly 26,000 job losses for 25- to 29-year-olds.18[p18]
However, it is likely that these industries will use AI to replace an even higher proportion of tasks, so the number of people affected could be greater. Manufacturing is also susceptible to automation, where Pacific peoples are disproportionately represented. If AI replaces 10% of manufacturing workers over the next five years, it is estimated that 2,900 Pacific people could be looking for jobs, along with 27,700 others from the same sector, resulting in potentially negative changes for Pacific families and communities.18,360 Overall, these estimates imply significant impacts for many people in terms of loss of jobs and a need to retrain and develop new skills.
In addition to increasing efficiency and reducing costs, AI is likely to produce better quality outcomes than humans can. For example, AI tools may increase the precision in surgery and cancer diagnoses, make driving and public transport safer, and perform better analysis and research.353 Together these mixed effects on employment, efficiency and productivity will markedly influence our health and wellbeing.
Risks and challenges of AI
Concerns about AI include its accuracy (for example, ‘AI hallucinations’361); algorithmic bias and discrimination;362,363 increased polarisation of opinions and misinformation;364 surveillance, privacy and IP rights;365,366 and cybersecurity and safety (for example in health care).367,368 Globally it also poses societal and environmental risks, such as weaponised AI (for example, the autonomous weapons systems already being used in conflicts today).16,362
Energy consumption
AI needs good-quality data, large data centres and significant computational power (high performance computing).369 As AI technology advances, the demand for data centres, especially around Auckland, is expected to double.370 Hyperscale data centres consume vast amounts of electricity. Around 40% of power is used for cooling, which also affects local water supplies. This additional energy consumption will increase our carbon footprint and could hinder Aotearoa New Zealand's efforts to meet our climate goals and reduce carbon emissions. It may also affect the local energy system and the cost of energy.370
Algorithmic bias
Algorithmic bias includes racial and other biases in AI tools. AI algorithms and outputs depend on the quality of the data they use. When the data is poor quality or biased, the algorithms will be too.353 Another problem is that AI models developed outside Aotearoa New Zealand do not reflect our population. This could mean they apply inappropriate or discriminatory logic, such as that seen in predictive policing techniques and in the US ‘technocorrections’ industry.362 There are also concerns in health care that AI tools may replicate existing inequities, rather than reduce them.353
Governance
Governance challenges associated with AI include data privacy, security and ethics. AI systems rely on vast amounts of personal data, which raises concerns about data breaches and unauthorised access. To prevent data being misused, and protect people’s privacy, data protection measures must be robust.365
The lack of transparency in AI algorithms can lead to ‘black box’ scenarios, where it is difficult to understand or explain how decisions are made. This opacity can hinder accountability, which could exacerbate mistrust in the public service.371 It also makes it difficult to address errors or biases in AI systems.
Ethics and regulation
It is challenging to design and use AI systems in ways that respect human rights and do not perpetuate discrimination or inequality. The risks this poses in the public sector varies widely. While it may be low in some circumstances (such as using AI to monitor wildlife), it may be very high in others (such as using AI to assess who is eligible for surgery or a social benefit, or to develop policies that could exclude some groups).372
We need to soberly understand how emerging technologies create new social and existential trade-offs.362
Aotearoa New Zealand’s public sector and businesses need a robust regulatory framework to oversee AI and address ethical concerns. Current guidelines, such as the Government Chief Digital Officer’s Responsible AI Guidance for the Public Sector: GenAI, aim to balance the benefits and risks of AI.371,373 International frameworks are also useful.374,375 However, these guidelines must be used and monitored consistently, to ensure that AI applications are ethical and do not harm specific communities.
Data sovereignty
The way data is collected, stored and used is important, because it determines how a story is told and who tells the story. It is even more important in the context of AI where the data may be used in ways that are not easy to understand or explain, or may have built-in bias.
In Aotearoa New Zealand there have been increased calls for Māori data sovereignty, in accordance with Te Tiriti o Waitangi and the recognition, by the Waitangi Tribunal, of Māori data as a taonga.376,377 Māori data sovereignty refers to the inherent interest and rights Māori have in relation to the collection, ownership and use of their own data.378 It recognises that Māori data should be subject to Māori governance and supports tribal sovereignty and the realisation of Māori and iwi aspirations.378,379 This means that AI models using Māori data should be developed carefully by Māori or in partnership with Māori, and Māori data governance models utilised.
While the potential of AI is recognised and is being explored by Māori,380 Māori also have significant concerns. These include where and how data is stored, leading to calls for Māori-owned and Māori-hosted onshore data storage.378 Generative AI tools such as Chat GPT typically draw on data from the dominant culture and thus risk marginalising Māori and Pacific peoples’ voices. There is also the risk of undermining tikanga and commercial exploitation of taonga, including te reo.363,378 As a 2024 Treasury paper notes, ‘Related to [AI], Te Tiriti requires extra consideration of Māori rights and interests, as it creates certain obligations on the Crown that will not be provided for if we simply adopt international regulatory standards and systems.’363
Certain types of Māori data (such as data related to te reo Māori and other taonga) may need to be more actively protected, given their value and the contexts in which they are used.363 Māori organisations have already developed large language models (LLMs) and are using them to help preserve and revitalise te reo Māori.381
Data sovereignty and ethical use of AI is not a concern only for Māori. Pacific, community and public-service leaders PHAC spoke with are concerned about how AI can misinform people and increase inequities. Disquiet was also expressed about AI’s potential impact on shared values, democracy and governance.360
Overall, although there are many uncertainties about the specific impacts of AI on key determinants (including health care), the influence of AI is likely to be large on most aspects of our lives in the next 15 years. Steering and regulating the development of AI tools and their use – and monitoring the outcomes of this in terms of equity and wellbeing – will be critical.
5. What progress has been made?
In this section we summarise the perspectives of community, iwi and public service leaders and young people on the progress we have made since 2000. We also review evidence and evaluations for the effectiveness of policies and programmes in modifying the bedrock and soil of our forest, the fundamental structures and determinants of health. There is reason to be optimistic – although patchy and slow, some progress has been made. But given the stresses on our health and social systems, the economic stress many people in our communities are experiencing, and the enormity of current and future challenges such as the climate crisis, current responses lack sufficient urgency and scale.
Perspectives of community, iwi and public service leaders
In preparing this report, we spoke with community, iwi and public service leaders and young people about their understandings of health, progress in modifying determinants of health and health equity since 2000, and what they thought needed to be done to address current and future challenges (see Appendix 1 for details). They emphasised that there have been positive changes since 2000. They told us that that overall, local governments and the public service now better understand broader concepts of health and wellbeing, and the contribution of determinants to health and wellbeing. Leaders said that the interconnections between determinants of health, and their biological and physiological effects from early childhood across the lifespan are also now better understood.
The bedrock
We heard from community and iwi leaders that the public now understand more about the impacts that colonisation and racism have on health. There is increasing recognition of the promise and potential that Te Tiriti o Waitangi – the foundational contract for people who live in Aotearoa New Zealand – offers. There is also strong awareness of the inter-relationships between a community’s health and that of their environment.
[I] take heart with te ao Māori perspective – collective ownership of assets, intergenerational, long-term thinking…
We acknowledge Māori as tangata whenua…and [acknowledge] tikanga.
…We see pae ora, the ability to thrive and live vibrantly as being a combination between culture, identity and belonging and the natural world around us… We’re not only self-managing, not only living healthy lives and participating in society, but we're also guardians of our natural landscape.
Leaders told us that rights legislation and approaches related to disability (for example, Enabling Good Lives87) and gender diversity (for example, provision of gender-diverse health care) have progressed. Implementation of cross-party commitments, such as aiming to reduce child poverty, have shown that positive impacts in communities can be achieved over a short period, when there is political will.
Across government, leaders told us that the rationale for taking a public health or ‘population’ approach to social issues is now better understood and being applied. For example, the justice sector has utilised a preventive approach, recognising the societal drivers of violent crime in developing strategies to address the current government target of reducing violent crime.382
Introducing wellbeing legislation383,384 and the Treasury’s “Living Standards” framework208 were perceived as positive steps. However, these have not been fully embedded in the public service, and wellbeing requirements added to the Public Finance Act are being removed (as at August 2025).385
Leaders also expressed concerns about the increasing financial and housing challenges faced by many whānau, exacerbated by post-pandemic cost of living pressures and economic and social policy changes. Rising unemployment and job insecurity, household food insecurity, and the anxiety and mental health issues experienced by young people were common concerns. These factors risk a reversal of any positive progress made in health equity in the last decades.
Investing in communities
We heard a very clear message from community leaders we spoke with. They stressed the importance of mana and self-determination, and developing whānau and community capacity. These factors were seen as fundamental to changing peoples’ lives, improving social cohesion, economic prosperity, and successful wellbeing outcomes. Leaders told us it is essential to devolve resources and decisions to communities and others who are ‘lower down the system’.
Shift power to communities, enabling them to assert more ownership, voice and influence on issues that affect them. The role of community voice, leadership, priority setting, and solution generation have been especially evident [in Healthy Families].
For iwi and hapū, this would represent a shift towards recognising mana and affirming tino rangatiratanga. And for Pacific communities, it would acknowledge that Pacific peoples have the strengths, abilities and resilience to develop relevant, culturally aligned local solutions.
You know, with respect, what happens in Wellington with all the best will in the world, when failure occurs on the ground, what's the impact in town [Wellington]? …. The price is paid in the community and the lives of the individuals and their families. It’s there where capability, resource and power has got to be.
There is robust evidence that programmes to support whānau and community aspirations (such as Healthy Families New Zealand,386 Whānau Ora387 and Ngā Tini Whetū388) are making positive differences to people’s lives.84,386,389,390 Many informants spoke of the potential to make greater progress when leaders, workers and communities were focused on improving circumstances for the most vulnerable members of society:
The biggest question is do we have the will to shift things on behalf of the vulnerable? Collectively, as a society, what is our role to shift these outcomes? Because I think…this is a solvable problem. We've demonstrated that by making progress.
Leaders told us that investment in multi-year, Crown–iwi and hapū social programmes are needed to give iwi and hapū greater autonomy, flexibility, and allow for longer-term planning. The programmes need to be sustained and should focus on broad outcomes such as whānau prosperity and wellbeing. They should build on those that have been shown to work and achieve a positive return on investment (such as Whānau Ora commissioning391 and Ngā Tini Whetū388).
We can design impactful solutions with whānau all day, but if you don't change the way that government is thinking, how they think and how they do policy and commissioning, then it's all for nothing.
An enabling approach from government and public services
Leaders support greater investment in place-based and community-led programmes, supporting local solutions that are valued, prioritised and resourced in meaningful and sustained ways. This requires a different approach from government.
I think that it is literally impossible for the current architecture to deliver on the outcomes that we're seeking … we have to flip the architecture, flip the model on its head…the principle of subsidiarity says you leave power and resource in proximity to the problem being resolved, closest to that. People don't live their lives in silos – and [thinking that] interactions with fragmented unintegrated bureaucracies will somehow create an appropriate comprehensive response to multifactorial problems … it never happens.
Senior public service leaders also recognised the insufficient intersectoral work of government departments and the ineffectiveness of working in silos.
I don’t think there is encouragement or support from leadership to work cross-sectorally across the board. It may be perceived as too hard, too time consuming and that sacrifices will be required when it comes to cross-agency decision making and sign-out. This needs to be an expectation in terms of ways of working.
There was critique from in and outside the public service that central government ministries often have little expertise in policy implementation processes – this needs to improve or they need to ‘get out of the way’. While recognising the need to resource communities adequately to empower them to find their own solutions, the public service needs to devolve decision-making and clear any obstacles that get in the way of action.
It only works through good relationships and when [the] Crown’s not in the way. It doesn’t work because of people, power and control. The place we want innovation to happen is in the communities. The Crown’s too constrained by ministerial priorities and political priorities.
…a lot of theories, but we need to move to implementation – how to make government more effective. Analysis is often too high level to be useful – it is true but useless.
As a senior public service leader noted:
Even if a policy is beneficial, it requires translation – to allocation of resources, to agencies, then via contracts to services, and finally to whānau. At each stage there are different levers that need to be understood.
In line with this, there were calls to strengthen and upskill the public service at local and regional levels, so that decision making, commissioning, and resourcing are better informed by local knowledge.
Regions are the way of the future. Community solutions are the way of the future. Regions working with iwi, with Pasifika, with strong PHOs. I would be putting solutions to the regions, to the community. There’s more trust between the iwi and the communities than the Crown and the communities.
Devolve greater responsibility, decision-making and resources (including senior experienced people) in the public service to the regions with the highest need, so that decisions can be made on the spot.
We heard that the public service urgently needs better analytical tools and skills to design, implement and evaluate policy implementation in ‘real time’. These tools are readily available outside of government.
Government [departments] are slow and don’t know what they want – ministries have no idea about tech and analytics now available. We don’t need more policy analysis; we need tools to turn it into action.
But communities need to be involved in setting out what is important, and which questions are being asked of data. Local knowledge and the understanding of how each community works (‘practice-based’ evidence) needs to be integrated with data analytics in the context of each community. This will support the design of solutions for successful outcomes.
There are always issues with biases in data and pure belief in quantitative data – we need to know its limitations, and value what other things around evidence in practice and local things, so that evidence can be enacted in local context.
Public services need to be able – and willing – to take risks. Some informants noted there are often ‘permissions’ (i.e. not real obstructions) and mandates to work collaboratively that are not taken up.
We need people who can pick up the phone, who can build a relationship, who can get stuff across the line and influence and pressure other parts of the sector.
Leadership from government
We heard that every level of society needs flexible, imaginative and reflective leaders, to manage current and future challenges, provide anticipatory, future-looking governance, and ensure our systems are resilient and have the capacity to adapt.
There is a gap between acknowledgement of the problem [such as the climate crisis] and willingness to do stuff …it takes political courage.
Leaders told us that good leadership is based on evidence, not misinformation. Being honest and taking people with you are key to developing a common understanding. Improving transparency in the political process is critical to avoid negative impacts on the public perceptions of, and trust in, government.
The power of industry at the political table is profound.
Leaders also told us that our political parties need to agree on some shared values and commit to long-term multiparty agreements, especially as we have a short political cycle and parties’ views on policies seem increasingly polarised. We need ’[the] belief that brave changes are being built to last.’392
Democracy relies on common, enduring values – social justice, equity – but we need new tactics and strategies.
We need to shift the “win–lose” culture of government.
Overall some progress has been made, but a lack of systemic change
Most leaders pointed to a lack of systemic change and some of the barriers to this. They noted the need to get the fundamentals right, to invest in the conditions that nurture our society as a whole.
There hasn't been much shift in the systemic issues – housing, income etc.
If you only focus on the 6% of the population who are not in a good way and you neglect the 25% that are hanging on by the skin of their teeth, they will just slide in…you're probably going to miss the things that are keeping the rest of the population healthy. And that's where I think an undue focus on pathology as against wellbeing can actually skew your thinking…
We have stark disparities. I think the disparities for Māori are still like a source of national shame. And intergenerational disadvantage and dysfunction, we just have not made enough progress. But we have made progress.
Assessing the evidence for progress
Evidence-based policy implementation
Government policy makers and legislators over the last 25 years have had access to a large body of public health evidence about how modifying determinants of health (such as assuring adequate household incomes, safe and dry homes, healthy food and satisfying work) can improve health and wellbeing. Policies and programmes addressing income support, child poverty, social housing, home ownership and improving housing standards, have well-evidenced positive impacts on health outcomes. There is strong evidence for the effectiveness of investing in early childhood development and family support to improve health and wellbeing outcomes.110 However, the model of intervention and implementation approach are critical in determining the extent to which these interventions reduce inequities in health.36,78,88,220,252,393-397
Public health action using a range of legislative, tax and health promoting interventions on commercial determinants of health such as tobacco and alcohol has contributed significantly to improved health outcomes and absolute reductions in health inequities, such as in SUDI, some cancers, heart disease and stroke.73,398,399 Public health has also played a key role in advocating for and monitoring safe drinking and recreation water and improving air quality. Improving water and air quality can have strong pro-equity effects, as more disadvantaged parts of the community often benefit most.
We now understand more about the impact determinants of health have on intersecting outcomes. In other words, the determinants not only affect health and wellbeing, but also other desirable outcomes like success in education and employment, social cohesion and crime reduction.183 This more holistic understanding of the importance of wellbeing outcomes is reflected in the Treasury’s The Living Standards Framework 2021,208 and in programmes such as Whānau Ora83,84 and Healthy Families New Zealand.386
A recent review of the way the political economy of a country influences population health (that is, how economic theories work in the real world, and how politics and the economy influence each other and health) concluded that social democratic welfare states, countries that spend more on public services, and countries with lower income inequalities have better self-reported health and lower mortality.220 Conversely, there is also extensive evidence of the associations between economic recession, unemployment and introduction of neoliberal policies with increased inequities in health and mortality.96,172 However there are still gaps in the evidence and need for more empirical studies in our context, recognising the challenge of evaluating the effects of interventions in a complex system with multiple interrelationships.
Nourishing the bedrock and soil of our forest
Since 2000 there has been positive progress in addressing some elements of the bedrock and soil.
Te Tiriti o Waitangi: redress and reparation
Before building further on the promise that Te Tiriti o Waitangi holds, the essential steps of recognising the past and ongoing impacts of colonisation – and the need for redress and reparative justice – are required.400 After more than a century of resistance and far-sighted leadership by Māori in the face of adverse acts or inaction by the Crown, the Waitangi Tribunal and successive governments have engaged in a process of recognition through the settlements process. In some instances, Crown acknowledgement of, and apologies for, breaches of Te Tiriti o Waitangi have been made.401
Some recent reparation models have addressed non-financial redress in new and positive ways. For example, the Tūhoe Claims Settlement Act 2014 and Te Urewera Act 2014 include a Crown apology for breaching Te Tiriti o Waitangi, limited financial and cultural redress, and mana motuhake (self-determination) redress through a joint Crown–Tūhoe social service management plan, based on the 40-year vision of Tūhoe.402-404 Another example is Ruruku Whakatupua (Whanganui River Deed of Settlement) and Te Awa Tupua (Whanganui River Claims Settlement) Act 2017.405,406 Reaching these settlements has required committed and inspired leadership on both sides, multi-partisan government support, and persistence and compromise by Māori over decades.
Legislation that enables people to exercise their freedoms and human rights
Legislation is a key element of the bedrock we need to nourish our forest. The New Zealand Bill of Rights Act 1990,407 Human Rights Act 1993408 and Homosexual Law Reform Act 1986409 were milestones in Aotearoa New Zealand’s anti-discrimination law.
Since 2000, the government has also supported the wellbeing of the Rainbow community through the Civil Union Act 2004410, Marriage (Definition of Marriage) Amendment Act 2013,411 and Conversion Practices Prohibition Legislation Act 2022.412
There’s a massive difference between walking into a room and being tolerated […] versus being celebrated. Community for me means people who know what it’s like [to be me]. [Rangatahi, HIVE 2025]
Aotearoa New Zealand ratified the United Nations Convention on the Rights of Persons with Disabilities (UNCRPD) in 2008151 and the United Nations Declaration on the Rights of Indigenous Peoples in 2010.413 These are significant milestones. Many of these legislative changes have been agreed through multiparty processes, with leadership from individual politicians. However, our current Human Rights Act needs review, and many pieces of legislation are still not compliant with UNCPRD or UNDRIP, with a lack of substantive progress in realising these international treaties.
The New Zealand government has also maintained reservations in relation to the United Nations Convention on the Rights of the Child (UNCROC), relating to the employment of children, age mixing in prison and differing treatment of children who are not legally resident in Aotearoa New Zealand.414
Reductions in income inequality and unemployment make a difference
In the forest, the soil represents resources that nourish whānau health and wellbeing – individually and collectively. After rapid increases in income inequality in the 1990s, peaking in 2015, there was a slight reduction in income inequality between 2016-2020, through income transfers and progressive taxes.415 However, income inequality is again increasing, and a focus on income obscures extreme disparities in wealth.62
Over the same period, unemployment also fell from its peak in the 1990s. This had a positive impact on youth, Māori and Pacific peoples. However, unemployment is on an upward trend again, with these groups again affected significantly more than others.144
More positively, the Māori economy has grown substantially, from $17 billion in 2018 to $32 billion in 2023, and the rate of Māori asset growth is significantly faster than that of the overall economy (from $69 billion in 2018 to $126 billion in 2023), outstripping predictions.59
Multi-party support for addressing child poverty
Aotearoa New Zealand achieved significant reductions in child poverty between 2012–14 and 2019–21, with further declines up to 2023 supported by taxation levers and social policies (progressive taxation, Working for Families and ECE subsidies).416,417 There was initially strong multipartisan support to address the issue, resulting in the introduction of the Child Poverty Reduction Act which established the framework for measuring and reporting on child poverty and agreed long-term targets.
This shows that, with focus and concerted effort, complex problems can be successfully addressed. However there needs to be a stronger focus on reducing the persistent inequities between children of different ethnic groups.416
Investment in early childhood education
Education is a key determinant of health – and in turn, healthy children and young people attend school more regularly and learn better. Early childhood education (ECE) has received increased government support for ECE attendance since 2000, most recently with ‘Family Boost.’418
Despite decades of underinvestment in kōhanga reo, and governments failing to adequately sustain kōhanga reo as an environment for transmitting language and whānau development, it has proved to be a resilient movement for Māori aspirations for mokopuna.419 However, far fewer kōhanga operate now than at their peak of over 800 in 1994.419 Similar efforts to maintain Pacific languages (for example, through a’oga fa’a Samoa) have survived, but without adequate investment.
Since 2019 the number of licensed ECE services overall has declined by 5%.420 There is robust evidence for the cost-effectiveness of early intervention and quality early education for children in terms of health, education and justice gains. But there is not yet a strategic investment strategy or multi-agency approach to support sustainable, quality ECE and early childhood programmes.
Changes in secondary education
When young people do well at school, they are more likely to take part in training and employment. Between 2002 and 2004, the government introduced NCEA, replacing the School Certificate and university entrance system that focused on external exams, standardised testing and scaling. NCEA aimed to increase diversity in the curriculum and better recognise individual skills.
Overall, NCEA has produced more successful outcomes for students, but large disparities in educational achievement remain, experienced disproportionately by Māori and Pacific young peoples.421 At the same time, students who attend kura kaupapa Māori achieve similar outcomes to non-Māori students in mainstream schools, and better outcomes than Māori students in mainstream education.422
Quality housing for everyone is possible - but requires sustained political commitment
Ensuring that everyone can access quality housing has been a goal of multiple governments. Despite overwhelming evidence for the health and social benefits, and positive return on investment provided by social housing, achieving this aim has suffered from different ideological approaches and policy swings.192,252,256,258,259,423,424
The increased rate of social homes built between 2017-2024 (accelerating in 2023-2024 with over 8000 new homes built by Kāinga Ora in the two years March 2023-March 2025) shows that it is feasible for social housing to ramp up to meet housing demand.425 The implementation of the Healthy Homes Standards and strengthened tenancy laws also illustrate implementation of evidence-based policy to support low income whānau and households. Other initiatives focused on specific populations, such as the Healthy Homes Initiative426 and Housing First255 (addressing homelessness) have demonstrated important health and social benefits.
However, home ownership rates remain low and there is overwhelming evidence of housing need, with rates of severe housing deprivation increasing over the last three decades.427 There is still a large unmet need for accessible housing and inclusive design standards. The current use of accommodation supplementary benefits transfers large amounts of public money into private property investors; this is not a long-term solution.428 Without more sustained investment in infrastructure, social housing and good-quality affordable homes, our precarious housing market will continue to be an immense challenge for many people and for health equity.
Imprisonment rates can be reduced
Although public concerns about violent crime often make headlines, the New Zealand Crime and Victims Survey suggests levels of crime have not changed much since the survey began in 2018, with small increases in fraud and vehicle theft.429 The significant positive policy and practice shifts that have occurred in our justice system are less well known. For example, from 2007 to 2021 the rate of incarceration of young Māori men (<25 years) dropped significantly.430 Changes in sentencing policy (such as more community-based, intensive supervision), and the government’s 2017 goal to reduce incarceration by 30% contributed to this, while measures associated with the COVID-19 pandemic had temporary effects.431
This reduction was also associated with greater recognition in the Courts of the underlying causes of offending, with the development of Alcohol and other Drug Treatment courts,432 and rangatahi and Pasifika youth courts.433 There is still however insufficient support for the learning impairments, addiction and mental health issues, and disability needs (for example related to fetal alcohol spectrum disorder (FASD), traumatic brain injury or neurodiversity) of many people whom we imprison.
The children who, at age 10, or 11 we think of as “vulnerable” and in need of care and protection – are very often the same children who, at age 14, we see before the Youth Court. They have the same underlying issues but they move from being seen vulnerable to being seen as criminal…the children before the Youth Court are those who we, as a society, have profoundly failed in their early years. Our failure to provide a safe and nourishing environment for children to grow up in sets these same children on a path to prison.434
Changes to care for children experiencing neglect or abuse
The Royal Commission of Inquiry into Abuse in Care, examining the period 1950-1999, has highlighted not only decades of abuse, disproportionately experienced by Māori, Pacific peoples and disabled children, but also the cycles of violence this has created.435 Over 200,000 people were systematically abused while in the care of state and faith-based institutions, and there were decades of deliberate cover up. This has contributed to institutional mistrust, intergenerational trauma and significant health impacts. It has been estimated that survivors have an average life expectancy of 46 years (24 years lower than the rest of the community of that age cohort), and are more likely to suffer violent deaths (from self-harm, motor vehicle deaths and assault).436
This abuse also has significant economic costs – not only for the individuals and families concerned. The Inquiry estimated the total economic cost of abuse and neglect in care between 1950 and 2019 at around $200 billion, with lifetime health costs estimated at 7% of total lifetime costs.437 The total cost is over three times the cost of the government's COVID-19 response, and over four times the cost of the Canterbury earthquakes response and recovery.438
The way we care for children experiencing neglect or abuse has started to change, but there is still a long way to go. There is still significant ongoing abuse and neglect of children while in the custody of Oranga Tamariki, disproportionately in secure residences and when children return to their parents’ homes.439
However, from 2014 -2023, the number of Māori and non-Māori children who were subject to a report of concern to Oranga Tamariki fell, with the proportion of Māori remaining at about 50%.440 And although the rate of tamariki Māori in care increased between 2014 and 2018, it has fallen significantly since then. This reduction may be associated with recent legislative and policy changes. For example, Section 7AA (since repealed in April 2025) of the Oranga Tamariki Act 1989), and Oranga Tamariki partnerships with iwi are intended to ensure tamariki Māori are in the safe care of their whānau, hapū and iwi.441
Legislation to reduce harm from tobacco and alcohol works
Taxation and pricing levers have been key to addressing harm from tobacco and alcohol in Aotearoa New Zealand. Overall, the effect of corrective tax policies on health outcomes has been pro-equity. For example, tobacco taxes have contributed to major declines in smoking, with greater impacts on young people and Māori, resulting in fewer smoking-related diseases and deaths. There is evidence of strong public support for greater use of taxation levers, for example in addressing harm from alcohol and sugary drinks.442
Changes in approaches to supporting whānau
In addition to universal social and health services, a range of programmes and projects focus on specific communities or families with more complex support needs. These programmes use varied approaches such as collective impact,443 systems change389 or social investment methodology.444 They may have multiple, broad wellbeing aims, or be more tightly focused (for example, focusing on a specific point in life, such as pregnancy or early childhood).
Strengthening Families is a structured, interagency case-conferencing system for coordinating services to whānau that has been operating in Aotearoa New Zealand since 1999.445 It aims to intervene early to support families facing challenges and offer prevention or intensive support. It was developed by Oranga Tamariki, the Ministry of Health and Ministry of Education; eight other government departments are signatories.
Outcomes of Strengthening Families have never been formally evaluated. However, in 2019, a review for Oranga Tamariki said that it was dealing with increasingly complex cases, and in many areas, government agencies were engaging poorly in local management groups.446
Whānau Ora, established in 2010 collectively by Te Puni Kōkiri, the Ministry of Health and the Ministry of Social Development, supports whānau to determine and achieve their own goals and aspirations. It is a Māori-led and whānau-centred approach. The Whānau Ora commissioning model includes support from kaiārahi (navigators) and flexible funding to ‘[enable] whānau to work together intergenerationally, in culturally aligned kaupapa with financial support.’447
We saw Whānau Ora as an opportunity to do things differently. We were not bidding to be the Government's alternative welfare net; we were bidding to be an impact investor, to foster a pipeline of investment in whānau capability and innovation.83
Whānau Ora has been extensively evaluated, including analysis of the social return on investment of specific interventions. These evaluations have shown the approach has highly positive wellbeing and economic benefits.447,448 This evidence shows that specific interventions can create equitable changes for whānau, but these interventions need to be sustained and scaled to the need.83,84,391,448,449
Ngā Tini Whetū was developed in 2019 and is funded by Te Puni Kokiri, Oranga Tamariki and ACC. This programme is delivered through Whānau Ora commissioning agencies. It supports whānau to act autonomously, use their strengths to stay on the path towards mauri oho (energised life force) and to flourish with mana.391 Despite having to manoeuvre around ongoing system barriers such as inflexible agency funding and governance mechanisms, the programme has been positively evaluated.390
Since 2015 there has been development of ‘social investment’ approaches by successive governments.450 Social investment is characterised by a focus on outcomes (as defined by whānau, communities or government), investment in early intervention, and use of data and evidence to prioritise resources where the impact and value is highest.444 Three social investment place-based initiatives were established in 2016 with two – the South Auckland Social Wellbeing Board451and Manaaki Tairawhiti452 – still in operation. The Social Investment Agency, established in 2024, has commissioned three further ‘demonstration initiatives’ as of June 2025.453
Place-based approaches such as the South Auckland Wellbeing Board, the Southern Initiative,454 Healthy Families New Zealand386 and the Tāmaki Regeneration programme,455while having varying goals and approaches, have similarities in aiming to create and resource community-led solutions. These programmes also aim to use data more effectively, intervene early, respond to local priorities and coordinate government services to work more effectively for communities.
What have we learned? Some progress - but ongoing challenges
Along with the assessment above, the trends in key determinants and health inequities in Aotearoa New Zealand presented in Section 3 reflect mixed progress. We demonstrate improvements in some key determinants but show that the uneven distribution of resources and opportunities has largely persisted over 25 years. Regardless of the indicator used, Pākehā are consistently privileged in terms of the determinants of health. Pākehā remain more advantaged in terms of wealth, income and material circumstances, and this is reflected in housing, education, employment and subsequent health outcomes.
There has been little progress on important determinants such as income equality, and home ownership, household crowding and affordability indicators have gone backwards since 2000. Wellbeing outcomes such as social connectedness and mental wellbeing are also going in a negative direction.
Our current economic system does not aim to achieve equity, but neither is it meeting the stated aims of a neoliberal market economy, such as lower prices for consumers. After four decades of neoliberal economics, we have low economic productivity and growth, and evident market failures (such as the housing market and supermarket duopoly).176,456-458
In the absence of a strong commitment to redistribution (via the tax and benefit system), a focus on economic growth entrenches inequalities and arguably comes at the expense of social cohesion. Any positive benefits of our current economic model are highly unequal. Almost two in five people find it hard to meet everyday costs;178 two-thirds of New Zealanders do not feel ‘well off’, and one in four sometimes do not have enough to eat.179 This was the primary concern of young people that were interviewed for this report.
New Zealand will have to lower the cost of living and make sure that there is fair pay so people can actually thrive in the country. There needs to be changes so that people can live comfortably and with dignity on the income they get.
[Rangatahi, The HIVE]
Our social safety net is failing, with benefit levels that are cementing in hardship and again increasing child poverty.427,428,459 These all have direct effects on physical and mental health.
It’s been so important to me to provide for myself and for the people I care for; without that, I feel a little helpless. [...] I’ve noticed my mental health has been impacted significantly when I have less money. [Rangatahi, The HIVE]
AI and the digital environment offer huge benefits and potential for good, but also the potential to increase harm from discrimination, the spread of mis- and disinformation, and the exacerbation of inequities. AI tools have developed within the current environment and reflect the global economic system and colonial history.378 The online environment contributes to misinformation, unfiltered discrimination (such as through trolls, and racist or misogynist influencers) and increased access to harmful products. The contribution to endemic social anxiety, cyber bullying and violent extremism is also a public concern.460 These harms can be mitigated, if governments take account of the needs and concerns of different communities and ensure these are reflected in appropriate systems of governance and regulation. Importantly, these systems should uphold inclusivity, transparency and human-centred values rather than allowing power over digital environments to be concentrated in the hands of a few.373
We need data centres in Aotearoa that serve communities…we need to retrain models with our own data. AI entrenches bias when using existing data and algorithms.
Trust in public services is currently vulnerable, partly fuelled by misinformation and industry lobbying.461 Social divisions are evident across key issues such as the significance of Te Tiriti o Waitangi,179 and the extent to which environmental protection should be weighed against business interests.17 The security of one of our greatest assets – our ‘clean, green environment’ – is threatened by weakening of key regulatory protections.462 And, despite recognition of the reality of climate change and evidence of our susceptibility to the impacts of it in Aotearoa New Zealand, our response has been slow and inadequate.
Young people told us about their aspirations for loving relationships, strong family and cultural connections, financial stability, and good jobs. Many spoke about the need to make our places — both physical and digital — more supportive, accessible, and liveable. The links between our environment, mobility (accessible public transport), and mental wellbeing came up often. People want to feel safe and able to move freely. Although many were positive about their own individual future, they were pessimistic about the possibility of system change.
As one leader told us, on a global scale we are now facing a ‘poly-crisis’ – that is, where crises are not just amplifying and accelerating but also appear to be synchronising. The triple planetary crisis of climate change, nature and biodiversity loss, and pollution and waste, is feeding human crises, leading to conflicts for resources, population displacement and widening gaps in health outcomes.16
We need to recognise the deep uncertainty and complexity this brings. There is, even more than before, a need for evidence rather than misinformation, a focus on intergenerational equity and an acknowledgement of what we don’t know.
It feels like the world is unstable, and that stress stays with me every day
[Rangatahi, The HIVE]
Even since from our childhood, so many ‘once in a lifetime’ occasions. Financial crisis, global pandemic…Housing crisis, youth mental health crisis.463
6. What needs to change?
PHAC’s recommendations
You’ve got a metaphorical flood in your laundry. You've got two jobs – both to find the leak and block it – and mop it up, ‘cause you don't want to live in a mess. But if you don't block the leak, you're gonna be mopping a damn long time…The understandable short-term priority for mopping, which we see at the moment unfortunately, is resulting in running out of mops and moppers. The public health, social determinant conversation [is] about root cause identification, finding the underlying hole and blocking it up.
To achieve pae ora and intergenerational wellbeing, we need to address all levels affecting the growth of our forest. In this final section, we focus on actions the government can take now to better nurture our forest. Unless the bedrock is strong and the soil fertile, our health system will face even greater demands than today, and we will not reduce differences in health and wellbeing outcomes as effectively or efficiently. This will also slow down improvements in overall health and social outcomes.7,30,78,96 We also need to nourish the root networks, the relationships within whānau and in the communities that support us.
An intergenerational and future-focused approach is required, with agreed, long-term wellbeing goals. Central government provides the key settings (such as an equitable tax structure and fair employment conditions) that ensure people have access to the resources they need to thrive. Central government leadership is also critical in addressing challenges like AI, climate change and changes to the way we govern our society – this cannot be done by any other single organisation. However, the government is not the only player in many of these areas; iwi and hapū, non-governmental and community-based organisations, and business can also contribute significantly.
Some of these actions need long-term thinking and multiparty political agreement. This should be achievable. Most iwi and hapū have a multi-generational vision, and strategies that extend well beyond political terms.464,465
An important advantage is that although the impact of multiple, negative determinants of health can compound, the positive impact of solutions can too.16 When considering how effective a potential change can be, it is critical to look at the likely compounding positive effects across health and wellbeing outcomes. Understanding the optimal level (for example, intervention at a population or community level) and the timing of intervention is also important.
Many of the approaches we propose are ‘win-win’ – they have large wellbeing co-benefits. For example, good urban design and social housing not only deliver better homes and living environments, but also health gains, improved school attendance, and have benefits for local employment and community cohesion. In addition, these interventions can contribute to climate mitigation and environmental protection.
Given the synergy of potential actions, our recommendations to the Minister of Health focus on investments that simultaneously address multiple government goals and achieve co-benefits. We expect the Minister will work with colleagues on a whole of government approach.
Invest in and empower communities, the root network of our forest
Wellbeing, social cohesion, economic prosperity, and health start within our whānau and communities. Their mana, aspirations for self-determination, capacity and strengths are fundamentals to build on. Early support for children and their families in our communities is vital to improving health equity and wellbeing across the life course. Our review of evidence and our engagement with community, iwi, and public service leaders suggest that both the siloed way government currently does its business and a lack of innovative approaches ‘get in the way’ of community-led solutions to the challenges we have outlined. Therefore, the actions we propose below are primarily focused on supporting a change in the approach of the public service, in order to support communities to achieve long-term, measurable wellbeing and health equity goals.
These recommendations align with rangatiratanga for iwi and hapū, supporting Māori to direct their own solutions and achieve their own aims for the future. For Pacific communities, these recommendations acknowledge that Pacific peoples have strengths and abilities to design and deliver culturally aligned, high quality, local solutions.
Nurture the bedrock
Shared values and respect for human rights are key to a thriving and resilient democracy and a cohesive, healthy society. Democracy relies on agreement on facts, public trust in government and public services, and acknowledgement of our shared history. By 2040, 200 years since Te Tiriti o Waitangi was signed, the Crown and Māori must have a positive and future-focused relationship, built on confidence and mutual respect.470
Towards 2040: Te Tiriti o Waitangi and our constitution
As a first step, the Crown must meet its existing commitments under Treaty settlements, and significantly improve how settlements are managed, as recommended in the recent Auditor-General’s report (2025).471 If the government fails to provide the promised redress, iwi, hapū and whānau will forego significant economic and social opportunities, and the health and wellbeing benefits associated with them.
For a settlement to be durable and the Crown’s apology to be meaningful, public organisations need to move beyond transactional ways of working with iwi and hapū…The public sector needs to understand that settlements are the basis for long-term relationships with iwi and hapū, and that it needs to manage them accordingly.471
Failure to meet Crown commitments would further damage the government’s reputation, making it harder for the public sector (including the health sector) to achieve what the settlements intended. It could also create litigation and financial risks for the Crown.471 It is essential for mana Māori, health and wellbeing that the Crown respect existing obligations under current settlements, and that further progress in processes of reparative justice is made in good faith.
The PHAC supports initiating a broad nationwide discussion in communities about Te Tiriti o Waitangi and our future constitutional arrangements moving towards 2040. The frame and scope of this korero must be agreed by both parties to Te Tiriti o Waitangi and led by respected Māori and Tangata Tiriti leaders. The discussion should cover our constitution, rights and freedoms, recognising the ongoing impact that colonialism has on Māori, and the need for reparative justice. It needs to address common misinterpretations of Te Tiriti o Waitangi and ‘misremembering’ of our history.
In every society, there can be a kind of social amnesia where people may innocently forget what might have happened in the past. But in this country, there has been a deliberate misremembering of history that has obscured the reality of what colonisation really was, and is. It has replaced the harsh reality of its racist violence and its illegitimate usurpation of power with a feelgood rhetoric of Treaty-based good faith and Crown honour.472
The process for this discussion needs to be thoughtful and deliberate, allow for ongoing reparation and healing, and offer communities support. Matike Mai, the kaupapa originally led by Dr Moana Jackson and Margaret Mutu for the National Iwi Chairs forum, could provide a blueprint for starting that discussion. 473,474 The working group of Matike Mai held over 250 hui throughout New Zealand over three years, and proposed a range of different possible models for constitutional change, with the goal of transformation by 2040.473,474
The discussion must allow people to express their views safely and hear, and reflect on, other people’s views. Recognising existing power imbalances, it must be adequately resourced and appropriately arranged, so that everyone can take part. Rangatahi voices must have priority and greater weight, as young people have a bigger stake in intergenerational equity.
We can also learn from others’ experiences – for example, the agreements, plans and processes developed between provinces and federal government of Canada and Indigenous (First Nations) peoples since ratifying UNDRIP.475,476
Commit to human rights and anti-discrimination
For a healthy, equitable and inclusive society, we need to embed existing rights legislation more deeply into our constitutional framework. We can build on the anti-discrimination and inclusion gains made for disability and Rainbow communities.
It is also essential that we continue repairing the discrimination embedded in policies, practices and social norms, as this drives inequality and perpetuates health gaps between Māori and non-Māori. Active anti-racist action must be rooted in our systems.86 These actions would uphold Te Tiriti o Waitangi commitments and our international commitments, such as those under UNDRIP. Celebrating Indigeneity as a positive determinant of pae ora – within a non-racist system that does not penalise tangata whenua for being Indigenous – should be our goal. Recognising and healing intergenerational trauma, decolonising and re-Indigenising is important in this process,29 along with tangata o Te Tiriti learning to be an honourable partner.
Aotearoa New Zealand also needs to acknowledge the shared whakapapa of tangata whenua with te tagata o le moana and address the impact that colonisation has had on Pacific nations. An important step in this process is re-examining our identity and re-situating ourselves as a Pacific nation alongside others. This can enlarge and inform our perspectives about how to respond (nationally and regionally) to climate change and environmental challenges, and how to act on inequities that Pacific peoples experience in education, employment, wealth and health in Aotearoa New Zealand.
Modifying the market economy
The goal of a thriving economy and greater wealth should be improved collective wellbeing, rather than a narrow focus on GDP. Our economic system - that results today in one in four of our children growing up in unhealthy, crowded homes, with inadequate material resources and a lack of sufficient food - cannot be seen as a success.
If we are to address the uneven distribution of determinants of health (such as income and wealth) alongside the other challenges we face, we need more discussion and consensus about the values that underlie our economy.
Looking after our people and planet are the two main issues that matter most to me. I don’t think we can have one without the other, I believe they go hand in hand. This means lifting everyone out of poverty and creating robust environmental policies. [Rangatahi, The Hive]
The World Economic Forum’s The Future of Growth Report 2024 looks at multiple factors to assess balanced growth. It scores Aotearoa New Zealand relatively well on inclusiveness and resilience, less well on innovation and poorly on sustainability.477 To improve this score, Aotearoa New Zealand could expand work on wellbeing previously carried out by the Treasury.208,478,479 Other jurisdictions explicitly consider broader wellbeing and intergenerational outcomes in legislation and budgets, such as in the Welsh Well-being of Future Generations Act (2015).480
Wales has developed measurable milestones, such as reductions between social groups in education, employment, mental health and life expectancy differences; a million speakers of Welsh by 2050; and net-zero greenhouse gas emissions by 2050. Scotland is considering a similar Parliamentary Bill as of June 2025, and there are similar discussions in other EU countries. There is advocacy internationally for implementation of similar legislation, including in Australia and Aotearoa New Zealand.481-483
We need to create economies that are distributive by design – ones that share value far more equitably amongst all those who help to generate it.484
Outdated economic theory which has failed to deliver equitable outcomes should be challenged. Future-thinking economic theories are now considered mainstream rather than alternative. Examples are the circular economy (based on principles of eliminating pollution and waste, circulating or recycling products and materials, and regeneration);485 and the concept of a regenerative economy, also known as the ‘doughnut economy’, that recognises our environmental limits and the value of strong societal foundations.486,487 This concept has been reinterpreted in Aotearoa New Zealand, sharing Indigenous thinking evident in other global models.488 This kind of approach is already evident in economic strategies espoused by some iwi, for example Kai Tahu,465 and the Kīngitanga.489
Reset economic levers
Views differ on how fair and progressive our current economic system is. Wealthier people tend to think it is fairer than those who are less wealthy.179 But low working incomes and benefit levels today are clearly not enough for people to have a healthy life and fully participate in society.179,428 Instead, alongside a complex and rather punitive social welfare system, they contribute to entrenched poverty, affecting far too many of our children.428
At the same time, an ageing population, increased demand for health and disability services and challenges like the climate crisis put increased fiscal pressure on our tax system. Current and future governments have choices over how to manage these fiscal pressures. They can do so through spending controls, greater use of private funding mechanisms, or increases in tax as a share of the economy. Each of these have trade-offs in terms of fairness and efficiency.490
Tax levers that could be further utilised include larger redistributive income and/or wealth transfers (for example, through capital gains tax (CGT) on property and assets).490 These transfers could be reinvested in adequate provision of social and health services accessible to all.
Although Aotearoa New Zealand had made some progress on gender pay equity, this has recently stalled,491 and even less progress has been made with other important supports for secure and satisfying employment, such as fair pay agreements. A disproportionate number of Māori and Pacific peoples, particularly women, are on the minimum wage or earn less than $25 an hour.492,493 Lifting the minimum wage to a ‘living wage’ would be a pro-equity step for all.
It took me so long to be able to land a part-time job to help lessen the financial burden for my family. I had to really network and meet people who had connections that would entrust a young boy to undertake a job responsibly. There is such a negative perception around young people and jobs, and when you add coming from a minority background with little English into the mix, well, then you’re screwed. [Rangatahi, The HIVE]
The government could also consider a universal child benefit in addition to more targeted measures for families. At the other end of the life-course, although our universal superannuation scheme has historically led to low levels of elder poverty, it was premised on high levels of home ownership, which increasingly will not be the case.494 Recently, several reports have proposed a universal basic income, or a ‘social floor’ (baseline living standard) for all households. Given the potential impact of AI on employment in future, this may become an urgent need, and the PHAC recommends further investigating this approach.359,428,493
Confronting the megatrends
Invest in ‘win-win’ solutions that nourish the soil and have compounding benefits for health and other social outcomes
The climate crisis: inserting urgency into our response
Climate change is the greatest global health threat facing the world in the 21st century, but it is also the greatest opportunity to redefine the social and environmental determinants of health.301
Aotearoa New Zealand’s response to the COVID-19 pandemic demonstrates that rapid, dynamic government action, informed by science and evidence, can successfully address major global health threats and save lives.79,495 Climate change requires a similar focus and urgency but with longer term commitment.
Climate change makes me very stressed, and I think it’s very disheartening. I feel like I’m not doing enough to contribute. Feels hopeless on an individual level because mega corporations do so much and there's only so much we can do. [Rangatahi, The HIVE]
Interventions to mitigate climate change, support transition to clean energy, and reduce emissions, deliver cost savings and avoid the costs and risks that arise from inaction. These include market risks, greater ill health, and the cost of having to make a harsher, more expensive transition in future.496,497International evidence shows strategies for adapting to and mitigating climate change provide multiple co-benefits (Figure 34).495,498
Unlike abstract emissions targets or distant ecological concerns, tangible health outcomes from climate mitigation offer immediate, compelling, and widely shared benefits while simultaneously reducing the health risks of climate change.498
Thinking carefully about how we plan our cities and towns and build our homes is an example of action critical to our health and wellbeing. This also has long-term consequences. Health co-benefits of climate mitigation approaches such as improved urban design and active transport include increased access to physical activity, reduced urban air pollution,499,500 reductions in excess body weight and type 2 diabetes, heart disease, road traffic accidents, cancer and respiratory disease, and improved mental health and wellbeing.269 Active transport initiatives in Aotearoa New Zealand, alongside well-designed urban infrastructure, have been shown to have significant positive effects on physical activity and mental wellbeing, and on household savings through lower car use.501,502
…Perhaps if climate action works, I might live in a greener city with clean energy, walking past urban gardens... [Rangatahi, The HIVE]
Some interventions are low cost to implement with a high return on investment. For example, improving car emission standards in Aotearoa New Zealand to European standards has estimated benefits between 35 and 48 times higher than the estimated cost of the policy. Social benefits due to the reduced health effects of air pollution would range from $8,342 million to $1,076 million (in 2019 NZ$ as net present value).500
Using AI tools with the capacity for analysing large datasets and models has the potential to assist in more rapid design, planning and real-time responses in urban design, and in the energy and agricultural sectors. It is important that these changes are made with, and not to, communities, and that any unintended impacts and outcomes are monitored to ensure the changes are not disproportionately benefiting or disadvantaging certain groups.
There are also major economic and investment opportunities associated with climate change mitigation.513 Depending on the mix of policy options adopted, potential co-benefits from emissions reduction and accelerating the transition to clean energy include:
- Increased productivity (as renewable electricity is more efficient and cheaper than fossil fuels).
- Greater energy security and independence.
- Opportunities for innovation to research and develop low emissions solutions, especially in food production.
- Increased resilience – for example through land-use changes that reduce erosion, or by designing electricity and urban networks for emissions reduction.
Figure 34. Health co-benefits of climate mitigation measures by sector in Aotearoa New Zealand
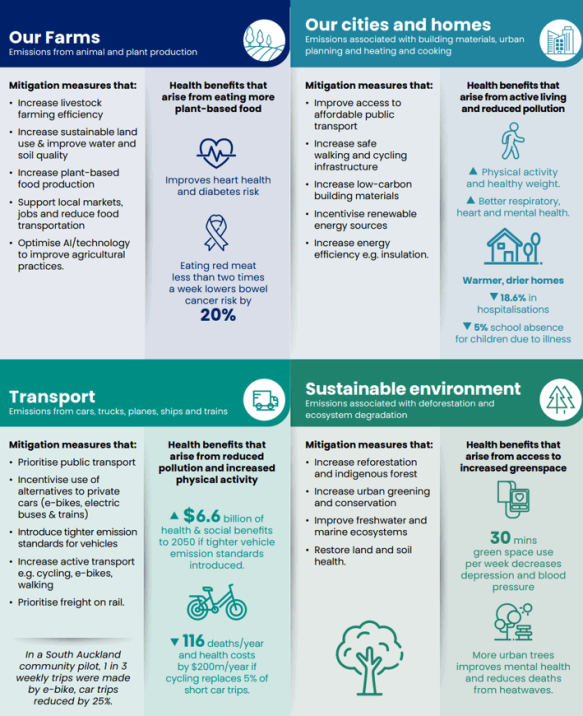
Source: Adapted from “Multiple benefits of climate mitigation measures” Melbourne Climate Futures, 2025.503
Infographic references 255,426,500,504-512
Text description
Our farms
Emissions from animal and plant production
Mitigation measures that:
- Increase livestock farming efficiency
- Increase sustainable land use and improve water and soil quality
- Increase plant-based food production
- Support local markets, jobs and reduce food transportation
- Optimise AI/technology to improve agricultural practices
Health benefits that arrive from eating more plant-based food
- Improves heart health and diabetes risk
- Eating red meat less than two times a week lowers bowel cancer risk by 20%
Our cities and homes
Emissions associated with building materials, urban planning and heating and cooking
Mitigation measures that:
- Improve access to affordable public transport
- Increase safe walking and cycling infrastructure
- Increase low-carbon building materials
- Incentivise renewable energy sources
- Increase energy efficiency e.g. insultation.
Health benefits that arise from active living and reduced pollution
- Physical activity and healthy weight
- Better respiratory, heart and mental health
Warmer, drier homes
- Decrease of 18.6% in hospitalisations
- Decrease of 5% school absence for children due to illness
Transport
Emissions from cars, trucks, planes, ships and trains
Mitigation measures that:
- Prioritise public transport
- Incentivise use of alternatives to private cars (e-bikes, electric buses and trains)
- Introduce tighter emission standards for vehicles
- Increase active transport e.g. cycling, e-bikes, walking
- Prioritise freight on rail.
In a south Auckland community pilot, 1 in 3 weekly trips were made by e-bike, car trips reduced by 25%.
Health benefits that arise from reduced pollution and increase physical activity
- $6.6 billion of health and social benefits to 2050 if tighter vehicle emission standards introduced.
- Reduction of 116 deaths/year and health costs by $200m/year if cycling replaces 5% of short car trips.
Sustainable environment
Emissions associated with deforestation and ecosystem degradation
Mitigation measures that:
- Increase reforestation and indigenous forest
- Increase urban greening and conservation
- Improve freshwater and marine ecosystems
- Restore land and soil health.
Health benefits that arise from increased greenspace
- 30 mins green space use per week decreases depression and blood pressure
- More urban trees improves mental health and reduces death from heatwaves.
Utilise positive economic levers
Positive economic levers to change behaviours have proved very successful in Aotearoa New Zealand and elsewhere. 237,422 They include giving people a wider range of choices and incentives to encourage them to shift to clean transport and more sustainable farming measures. These measures include:
- electrifying the car fleet
- public-sharing e-bikes and scooters506
- better, cheaper and more accessible public transport
- environmental standards and product traceability.302,513
Producers and investors will respond to a changing market when there is a high degree of certainty about the policy commitments. That commitment spurs innovation, competition and investment in the whole supply chain. This is because businesses understand the policy signal, have certainty in travel direction, and can identify market opportunities.513
The public sector is a large and powerful ‘customer’.7 It can use this status to give its suppliers a positive incentive when they take actions that mitigate climate change. Examples include using construction contracts that meet climate-resilient standards for government buildings; and buying healthy locally grown food for public institutions (such as hospitals and schools).514 This can contribute to better health outcomes, and local economic growth and jobs, while also reducing carbon emissions.
We need to identify similar levers to incentivise change in other systems that influence health, such as shifting the food system to produce more plant-based foods and high-value dairy products. Learnings from global examples such as Origin Green in Ireland, and from local research, development and innovation could extend existing programmes (such as the voluntary New Zealand Farm Assured Programmes515) to the whole food system.
Activities that promote healthy and affordable food in communities can also help us mitigate and adapt to climate change. Community food initiatives (such as māra kai, community gardens and regenerative planting) revitalise cultural knowledge about food production and improve social cohesion and physical and mental health outcomes – while also reducing carbon emissions.514 Reducing and recycling food waste reduces emissions and improves communities’ food security. When whānau have greater food security and access to healthy foods, they can maintain a healthy body weight and have better oral health. Ensuring children have enough to eat, have good hearing and oral health improves their education outcomes. This will have a long-term impact on their employment and income opportunties.517
AI and the digital environment
AI is rapidly changing, and in uncertain ways. There is a high risk that societal changes resulting from AI will reinforce existing inequities.362 Given this, the speed of change, and uncertainties, here we focus on actions to address some of the potential challenges to wellbeing.
Government has a key oversight role
The government has a key role to provide and oversee frameworks that enable us to take up the benefits of technological change, protect us against risks, and steer AI and the digital environment towards equity.371,373 Government and private-sector investments in AI need to recognise the biases in data that AI tools use, particularly when those tools use data from other countries and apply them in Aotearoa New Zealand. When AI tools (such as police facial recognition tools) use existing data and algorithms, they entrench bias, which increases people’s mistrust in government services.
Rubbish in, rubbish out – data quality is critical. Often data is not gathered from the community it is supposed to serve…is biased, and there is no accountability (unlike having a real doctor, for example). This is important if it is a life and death matter such as in health care.
Given that the quality of data has a major impact on the output of AI algorithms, it is crucial to improve the quality of ethnicity data held by the health sector and other government agencies.518
AI sovereignty refers to a nation’s capability to develop, manage and use AI in ways that align with its own values, regulations and interests. AI sovereignty is increasingly recognised as important, and not only for assuring national security and defence.519, 520 Reducing dependence on external AI technology, enhancing our global competitiveness, and fostering innovation and new models, can create high value jobs and retain local talent and expertise.
There are strong ethical arguments for AI sovereignty, for example, in development of public service large language models (LLMs). There is also a strong argument for AI sovereignty related to Te Tiriti o Waitangi obligations. It is a prerequisite that Māori govern and lead how Māori data is used by AI tools. It is therefore a priority to invest in developing AI tools that support innovative economic and social development specific to iwi and hapū.377,378
Aotearoa New Zealand has infrastructure capacity, innovative companies and a lot of quality data. Given this, we should invest in creating AI tools that are specific to Aotearoa New Zealand, particularly in critical areas like environmental management, primary production and health care. Reducing our dependence on foreign AI technology, fostering innovation and new models, and becoming more globally competitive would create high-value jobs in Aotearoa New Zealand and retain local talent.18,356,359
Support people whose jobs are affected by AI
Where rapid job losses related to AI are likely to, or do, occur, investment by government and industry in flexible regional and local programmes will be required, to allow people to retrain, upskill and adapt to change. Other countries in our region are already directing young people into short (3-12 months) vocational courses on AI, to provide them with job opportunities in the technology sector and to support businesses transform using AI.521
The government must also strengthen the social safety net for those who lose their jobs. If AI reduces the labour share of income, we may need to use other mechanisms to raise tax revenue through capital and introduce a universal basic income approach.359
Plan for the extra energy that AI needs
When the government and private sector are planning investments in clean energy, they must account for the extra energy requirements of AI. AI depends on high-performance compute and large data centres, which escalates its demand for energy and water.
Given Aotearoa New Zealand has the capacity for developing more renewable energy, it has a potential advantage in the global AI market - if there is sufficient investment in new renewable energy sources. AI also has the potential to create an intelligent coordination layer across the generation, transmission, and use of energy, and support a more resilient and adaptive energy system.522
Use AI to support ‘win win’ solutions
AI tools with the capacity for analysing large datasets and models have the potential to assist in more rapid design, planning and real-time responses in urban and environmental planning, and in the energy and agricultural sectors. It is important that these changes are made with, and not to, communities, and in line with Māori data sovereignty. It is also important that any unintended impacts and outcomes are monitored to ensure the changes are not disproportionately benefiting or disadvantaging particular groups.
Actions for the health system
Finally, we propose key actions for the health system. Although the focus of this report is on the determinants of health outside the health care system, we recognise the important contribution it makes to our health and wellbeing. The health system also has internal and external influence, and levers that it can use to address the ‘megatrends’ and challenges set out in this report. These recommendations align with the three themes above.
Appendix 1. Methods and evidence
1. Literature and evidence reviews
We carried out several literature searches with the support of Ministry of Health librarians. The search strategies were focused on:
- Policy and programmes to improve equity in health outcomes
- Health, equity, and climate change in Aotearoa New Zealand
- The mechanisms (physiological, biological and epigenetic) for how determinants influence physical and mental health
- The commercial determinants of health (and relationship to alcohol harm, excess body weight and other health damaging factors)
- Climate change and health
- AI and predicted effects in Aotearoa New Zealand.
We particularly focused on research and evaluations carried out in Aotearoa New Zealand, including those available in the grey literature, and on the period 2010-2025. We reviewed systematic reviews or ‘reviews of reviews’ of the international literature in these fields. We also accessed key literature recommended by PHAC committee members and public health experts.
2. Key informant interviews
The PHAC aimed to inform this report with learnings from a range of experienced community, iwi and public service leaders. These ‘key informants’ were identified through nomination by PHAC members, by ‘snowballing’ (i.e. referral by other informants) and through identification of lead academics and experts involved in research on key determinants of health, such as housing and transport. We aimed to interview people with knowledge from across a range of areas, from economics to housing, AI and the climate crisis, disability and transport. We also wanted to hear from people with a range of expertise and experience, from research, public service, to programme implementation and ‘practice evidence.’ We based the semi-structured interviews around four main themes/questions. These were:
- the informant’s own concepts of health and understandings of the contribution of determinants of health to wellbeing;
- their assessment of progress made in addressing inequities in determinants of health and in health outcomes since 2000;
- the key challenges they saw looking out to 2040; and
- key actions or solutions they proposed, based on their experience, ‘practice evidence’ or other sources e.g. published research.
The interviews were carried out between December 2024-June 2025, in person or online. The majority of informants were interviewed by Dr Clair Mills (PHAC secretariat), usually accompanied by another secretariat colleague. Interviews were recorded and summary notes taken. Key themes were identified and collated, along with relevant quotes.
| Interviewee | Organisation |
|---|---|
| Tevita Funaki | CEO, The Fono |
| Huhana Hickey | Lawyer and disability advocate |
| Hikitia Ropata | Executive Chair of the Āti Awa Toa Hauora Iwi Māori Partnership Board. |
| Bronwyn Petrie | Healthy Communities, Te Whatu Ora |
| Eric Crampton | Economist, New Zealand Initiative |
| Aimee Hadrup | Auckland City Council /Southern Initiative |
| Monique Kelly | WAO (general manager), Wanaka |
| Kaeden Watts | Public Health Agency, Ministry of Health |
| Helen Leahy | Pou Ᾱrahi, Ngā Waihua o Paerangi (Ngāti Rangi) |
| Helmut Modlik | CEO | Tumu Whakarae, Te Rūnanga o Toa Rangatira |
| Esther Woodbury | Disability researcher and advocate |
| Mary Roberts & Jacinta Fa'alili-Fidow | Moana Connect |
| Terryann (TC) Clark | Cure Kids Chair in Child and Adolescent Mental Health, University of Auckland |
| Belinda Borrell | Researcher, Massey University |
| Ganesh Nana | Economist, former CEO of the Productivity Commission |
| Geoff Short | Ministry of Health (acting DDG; previously at TPK, involved in development of Whānau Ora and Nga Tini Whetū) |
| Philippa Howden Chapman | Professor, School of Public Health, University of Otago and director of the Kainga Oranga | Housing and Health Research Programme |
| Alex MacMillan | Professor in Environmental Health, University of Otago |
| Amanda Hinkley, Sally Mackenzie, Mary Fisher | Whaikaha | Ministry of Disabled People |
| Jonathon Boston | Professor of Public Policy, Victoria University |
| Louise Signal | Professor and Director of the Health Promotion and Policy Unit, University of Otago |
| Caroline Shaw | Associate Professor, University of Otago |
| Gael Surgenor | Community and Social Innovation |
| Liam Williams, Sandra Laws | MBIE (AI strategy development) |
| Anna Stevenson | Public Health physician, Canterbury Public Health |
| Anna Matheson | Associate Professor, Victoria University; lead evaluator of Healthy Families |
| Hauora Māori Advisory Committee | Chair: Parekawhia McLean and members |
| Ian Lambie | Chief Science Advisor, Ministry of Justice |
| Phil Walker | Senior policy advisor, Ministry of Justice |
| Ann Sears | Public Health physician, Te Whatu Ora |
| Peter Lucas Jones | CEO, Te Hiku media; Chair of Te Aupōuri iwi |
| Hinemoa Elder | Deputy chair of Te Aupōuri iwi. |
| Tanya Maloney, Jean MacDonald | Oranga Tamariki |
| Fatumatah Bah | Ministry of Health |
| Bill English | Board member, Impact Lab Ltd and Manawanui Support Ltd; former Cabinet Minister and Prime Minister |
| Carol Berghan, Tui Te Paa, Lisa McNab | CEO and leadership team at Te Hiku Development Trust, Kaitaia |
| Aumea Herman | Chief Clinical Advisor Pacific Health, Ministry of Health |
| Rhys Jones | Te Kupenga Hauora Māori, Auckland University and member, Ora Taiao |
| Karen Lavin, Grant Blackwell | Climate Commission |
| Ashley Bloomfield | CEO, ESR and University of Auckland |
| Aphra Green | Deputy CEO, Social Investment Agency |
| Paul Henderson | Researcher, Maxim Institute |
| Shelley Katae | CEO Tāmaki Regeneration Company |
3. Engagement with The Hive
The HIVE functioned from 2019 to June 2025 as a collaboration between rangatahi (young people), the Ministry of Youth Development and Curative (a creative change agency), to support youth voice and perspectives into government services. The PHAC secretariat first gathered insights from young people from a broad range of existing sources (see below) and then tasked The HIVE to sense check the relevance of the existing information. We asked The HIVE to gather further insights with a range of rangatahi from across the motu, through interviews and social media engagement.
Members of The Hive conducted peer interviews with 28 rangatahi from across Aotearoa New Zealand in May 2025. All interviewees were between the ages of 17–25 years. Participants included Māori, Pacific, Pākehā, Asian, Middle Eastern, African, rainbow, gender diverse, urban and rural young people. The findings of these interviews have validated and added to existing youth engagement information on what young people perceive as the most significant determinants of their health and wellbeing. Financial security was identified in these interviews as the most significant influence on young people’s health and wellbeing. This and other findings are summarised into a report (HIVE insights- Determinants of Health). We have used quotes in the PHAC report (in green font) from diverse rangatahi interviewed as part of this engagement.
4. Review of data and community ‘voice’ from prior community engagement
A diverse range of workshops, hui and talanoa have been conducted in recent years to inform the development of health sector policies and strategies. These include engagements with children and young people, whānau Māori, Pacific communities, disabled communities, and other ethnic communities. The insights gathered reflect the voices and experiences of these groups. PHAC decided not to repeat further community consultation specifically for this report, but to draw on the findings and richness of these existing sources. We reviewed the summaries and had access to some of the raw data. We focused on participants’ understandings of health, the determinants of health and what they viewed as important for the future.
Children and Young People
- The HIVE. Quarterly newsletters 001-004. Curative NZ and Ministry for Youth Development. News & Updates | The Hive: https://www.thehive.nz/news
- The HIVE. Determinants of Health: Hive - Youth Perspectives. 2025. Insights prepared for the Public Health Advisory Committee. Curative NZ and Ministry for Youth Development.
- Stubbing, J., Gibson, K., Bardsley, A. et al. “We’re living in a world that wasn’t built for us”: A qualitative exploration of young New Zealander’s perspectives on socio-ecological determinants of declining youth mental health. BMC Public Health 25, 1648 (2025). https://doi.org/10.1186/s12889-025-22618-2
- Ministry of Social Development | Te Manatū Whakahiato Ora. 2022. What About Me? The Youth Health and Wellbeing Survey 2021 Overview Report. Link: Youth Health and Wellbeing Survey MSD 2021
- Mana Mokopuna – Children and Young People’s Commission. 2024. “A place to talk peacefully” What helps and what gets in the way. Mokopuna voices on healing from family and sexual violence in Aotearoa New Zealand. ISBN 978-0-473-73046-8 November 2024. https://www.manamokopuna.org.nz/voices. “A place to talk peacefully: Mokopuna voices on healing from family violence and sexual violence in Aotearoa | Mana Mokopuna
- Mana Mokopuna – Children and Young People’s Commission. 2024. “You need to get in early, as soon as you see people struggling.” Understanding the life-course journey. Mokopuna voices to inform the Child and Youth Wellbeing Strategy Review 2024.ISBN: 978-0-473-73381-0. You need to get in early - voices report | Mana Mokopuna
- Mana Mokopuna Children and Young People’s Commission 2024. Ki te kore te kaikiri ki roto o Aotearoa, kātahi te wāhi pai rawa atu."Without racism Aotearoa would be better": Mokopuna share their experiences of racism and solutions to end it | Mana Mokopuna
- Ministry of Youth Development – Te Manatū Whakahiato Taiohi. Youth Plan Voice, Leadership, Action Strategic Framework. youth-plan-strategic-document-final-.pdf
Whānau Māori
- Iwi Māori Partnership Boards (IMPBs). URL: https://www.tewhatuora.govt.nz/health-services-and-programmes/maori-health/iwi-maori-partnership-boards-impbs Webpage accessed 1 May 2025.
- Whatua - Summary Report: Engagement for the development of Whakamaua: Māori Health Action Plan 2020-2025. Wellington: Ministry of Health. Whatua: Engagement for the development of Whakamaua: Māori Health Action Plan 2020-2025 | Ministry of Health NZ
Pacific community insights
- Te Mana Ola: The Pacific Health Strategy engagement report –Tagata sa’ilimalo, Pacific women, youth, rural communities, Pasifika Rainbow+ / MVPFAFF+. Lived experience of a mental health condition.
- Health and Disability System Review pacific-persepectives-health-system-review-final-pdf-version.pdf
Disabled Communities
- Te Whare Whaikaha | Disability Resource Centre. I.Lead conference report cards. 2024. Accessed via: https://www.ilead.org.nz/
- Minister of Health. 2023. Provisional Health of Disabled People Strategy. Wellington: Ministry of Health. Provisional Health of Disabled People Strategy | Ministry of Health NZ
Ethnic Communities
- Ministry for Ethnic Communities | Te Tari Mātāwaka. 2021. Engagement on the priorities of the Ministry for Ethnic Communities: What really matters to communities.
- Ministry for Ethnic Communities 2024. Ethnic Evidence report. Wellington, New Zealand. mecethnicevidencereport2024.pdf
Consultations Covering a Diverse Range of Communities
Health and Disability System Review engagements:
- Health and Disability System Review. 2019. Health and Disability System Review - Summary of Submissions. Wellington: HDSR. summary-of-submissions-report-for-the-nz-health-and-disability-system-review.pdf
- Mauriora Associates Limited. New Zealand. 2019. Health and Disability System Review – Summary of the Health and Disability system review Wānanga: Facilitator Report 2019. final-report-from-the-health-and-disability-sector-review-wananga-2019.pdf
Pae Ora engagements:
- Van Paauwe, P. Cernis, A. Hall, K. Royal, E. Goodwin, E. McArdle, A. 2023. Voices for Change | Diverse lived experience perspectives and opportunities for health equity. Curative & Connect+co for Manatū Hauora | Ministry of Health.
- Ministry of Health. 2023. Pae Ora Health Strategies: Summary of feedback from engagement. Wellington: Ministry of Health. Pae Ora Engagement summary - Note Ethnic communities, Hauora Māori, Pacific Health, youth, Disability, Rural, rainbow, women.
- Ministry of Health. 2023. Te Mana Ola Engagement Report: What we heard from Pacific peoples. Wellington: Ministry of Health. Te Mana Ola engagement report
- Manatū Hauora. 2023. Ngā Wānanga Pae Ora Summary Report: Engagement for the development of Pae Tū: Hauora Māori Strategy. Wellington: Ministry of Health. Pae Tū Engagement report
Appendix 2. Case studies
1. Preventing diabetes
To illustrate how we can more effectively prevent diabetes, one of Aotearoa New Zealand’s biggest health challenges, we identify ‘win-win’ solutions: interventions across multiple sectors with health and wellbeing co-benefits. Implementation strategies start with addressing factors in the bedrock and soil.
The challenge
Unhealthy diet and excess body weight are the biggest preventable health risk factors for Type 2 diabetes. One in three adults, nearly 1.5 million of us, were classified as obese (with a BMI of 30 or over) in 2023/24, and rates in children are also increasing.76 The more than doubling of excess body weight over only three decades in Aotearoa New Zealand (which is mirrored globally) does not reflect genetic changes, a lack of moral fibre, or individual laziness.524 Rather, these changes parallel the introduction of highly processed foods and sophisticated marketing strategies, along with the impacts of colonisation and a food production system that have removed people from their land and traditional food sources.492,525-527 At the same time, one in four households are sometimes or often struggling to put food on the table179 and healthy food is the least affordable, despite our country producing enough food to feed 40 million people.514
The cost to health, wellbeing, and society
Excess body weight accounts for 17.5% of premature death and disability, and in 2021 drove $2 billion of direct health system costs each year, or 8% of total health expenditure.528 It leads to an estimated total cost to society (through things like loss of productive workforce) of $4-9 billion.528
“The future economic liability of diabetes in our country should be a major concern for all of Cabinet, not just the Minister of Health.”
[Sir Bill English, former Minister of Finance]
It is predicted there will be a 90% increase in people with diabetes, to more than half a million of us by 2044. Māori, Pacific peoples, and people living in the most deprived neighbourhoods are already disproportionately affected.2,76 The losses to whānau through ill health, disability and early death will be significant if the current trajectory is not changed – but there will also be enormous associated economic losses and social costs borne by all of us.
Progress so far…
No country has yet successfully reversed their “obesity epidemic.”529 However there have been areas of improvement internationally and locally that we can learn from and build on. No one policy or intervention will solve the issue, and solutions must be developed and co-designed with people in the most affected communuties.530
“Win-win” solutions
A layered combination of approaches is needed for diabetes prevention, aligning with Te Tiriti o Waitangi and recognising the unequal impacts, especially for Pacific peoples. We know that given the powerful commercial influences at play, this challenge cannot be resolved with individual and community-targeted programmes alone, although these are an important element.514,531 Interventions start with the bedrock and soil, and can build off existing programmes, such as some of the ongoing Healthy Families New Zealand initiatives.532,533
National settings – the bedrock and soil
- Governments can create the policy settings (e.g. for wages, taxes, food production, welfare and housing) to ensure that low-income households have sufficient disposable income to enable autonomy to make healthy food choices and afford a healthy diet, without relying on grants and food parcels.
- A national food and nutrition strategy could drive and monitor implementation of the policies below.
- Regulatory and taxation levers are key mechanisms in responding to commercial interests that damage our health and wellbeing.534-536 To note, the food and beverage industries are powerful lobbies with strong political connections, as documented recently in Australia.537,538
Evidence-based, cost-effective “whole population” interventions include taxes on sugar-sweetened beverages (SSBs), as already introduced in over 130 jurisdictions globally, including three-quarters of Pacific nations and several US cities.539 Taxes can also be applied to unhealthy ultra-processed foods. These taxes have varied designs, but have been shown to:
- incentivise industry reformulation to reduce sugar levels in SSBs
- reduce sugar intake
- have positive effects on childhood and adult obesity
- reduce dental caries; and
- support the health budget through ‘earmarked’ taxes.443,539
SSB taxes have had greatest benefits for young people and people on low-incomes.517
- Other levers include:
- Mandatory standards for reducing sodium and added sugar in key food categories of processed and ultra-processed foods.
- Regulating online advertising, sales and sponsorship, especially that aimed at children and young people, and food labelling. These are low cost, effective approaches.535
- Mandatory nutrition policy for schools and ECE services that ensures foods and drinks provided or sold are healthy and sustainable and that sufficient resources, support and training are allocated for implementation.
- At least doubling the coverage and funding of Ka Ora, Ka Ako in schools and ECEs.
Regional and local settings
- Support increased physical activity at the local and regional level, by expanding the range of choices people have. For example, shaping urban design through:
- Walking paths and cycle lanes540,541
- Public rental e-bicycles, subsidised e-bikes or other active modes of transport501,508,511
- Enhancing accessible public transport.540
These interventions, particularly focused in communities with high rates of diabetes, have already demonstrated co-benefits in local settings in Aotearoa New Zealand. These include health outcomes - increased physical activity, improved mental health, weight reduction and reduced illness related to a reduction in polluting emissions, and also household economic benefits.541-543
Community settings – supporting the tōtara root network
- Support community-led, co-designed programmes that address food insecurity, food sovereignty, physical activity and broader wellbeing issues.386 These include such examples as:
- The West Auckland Kai Village kaupapa544 – fostering relationships, sharing mātauranga Māori, with a collective approach to local food initiatives
- The Food Hub Collective (formerly the Papatoetoe Food Hub) – a community-led enterprise, in which surplus food is rescued from being wasted and turned into good affordable food for the community, within a zero-waste approach.545
- Kai Rotorua546 – teaching and learning activities around planting, growing and harvesting and storing kumara and healthy kai, and other Māori-led initiatives, such as māra kai and the Kai Atua project.547,548
- Revitalising Pacific cultural knowledge systems of growing food, preserving food and adapting to climate change and severe weather events. Pacific churches, as “socio-cultural villages” may play an important role in supporting this transformation.549
The overall impact of these multiple interventions at each level of our tōtara forest need to be monitored over time and by population groups, to ensure progress towards equity.
2. Health equity, homes and community design
The importance of home
Home means a place of connectedness and relationships, of identity and security. For Māori, kāinga (or papakāinga) represent the anchoring of tangata to whenua and embody mana (ancestral authority) over surrounding land.550 Kāinga are an expression of cultural identity and connection to the whenua.551 The centrality of ‘home’ to families, for nurturing good relationships and unity are all important aspects of a good home common to Pacific peoples,492,552 and also for many non-Māori, non-Pacific peoples. Adequate housing is a human right.553
Health and wellbeing benefits
The positive benefits for health and wellbeing of warm, dry and safe homes, and the importance of appropriate design to meet the intergenerational and cultural needs of whānau have been well researched in Aotearoa New Zealand. Insulated, well-designed housing reduces energy costs and functional crowding, and related illnesses from damp and mouldy housing, such as asthma, respiratory infections, rheumatic fever and chronic conditions.192,252,256,258,259,423,424
Housing security - that is, secure tenancy or home ownership - is also critical and has multiple impacts on wellbeing of whānau and children. It improves attendance and continuity of education, community connections, household economy, access to employment and a sense of security and safety. Insecure tenancy of housing is associated with increased likelihood of potentially avoidable hospitalisations in young children.424
What is the challenge?
Housing affordability is a major issue, especially for families on lower than median incomes.260 In December 2024, the median house price was 7.3 times the median annual household income (down from 10.1 times at the market peak in late 2021), and rents were at a record 28% share of income.554 As of March 2025, there were over 19,000 people on the public housing register, with nearly all having high priority needs; it is known that this considerably under-estimates housing need. Nearly half were Māori whānau and 35% Pacific peoples.555
Nearly one in five young people in the Growing Up in New Zealand (GUiNZ) study have been experiencing the most unstable tenancies or worsening residential stability since birth. These trajectories of experience are associated with material hardship, living in public housing or private rentals, and at worst, homelessness.556 Many children in Aotearoa New Zealand still live in inadequately heated homes (one in five in the GUiNZ study).556 Homelessness and severe housing deprivation persist at high levels and are associated with very poor health outcomes.427
“Win-win” solutions
A range of housing models and investment is needed to achieve quality affordable housing for all. Experience indicates that funding of housing policy packages is particularly effective when coordinated with community groups, and when there is fair enforcement of housing standards.557 There is a need to increase the capacity of iwi, social housing providers and Kāinga Ora as well as negotiating with private developers and investors to assure more affordable housing. Building rural and urban homes which meet the needs of intergenerational whānau, and accessible housing for people with disabilities should be prioritised.
Climate mitigation and multiple social benefits
Developing community and associated infrastructure (including schools and health services) alongside new or retrofitted homes is essential. Building climate-resilient, affordable homes, with urban densification and development of public transport, alongside public green and blue spaces, has multiple benefits - reducing our carbon emissions, providing employment and supporting local economies, and improving health, educational and social outcomes, including social cohesion.558
As homes and communities built today will still be homes for our mokopuna in 100 years, what we do now is critical.559
Improving the Building Code, phasing out fossil fuels in commercial buildings and homes, and energy labelling of commercial buildings and homes would, if introduced from 2025, reduce cumulative emissions by 6,100kt by 2030, helping deliver almost a third of the required savings the Climate Change Commission have said are needed. These approaches are widely supported throughout the building industry.559
Social housing
The role of government in social rental housing has fluctuated in Aotearoa New Zealand over decades but is relatively small compared with OECD countries like the UK, the Netherlands and France, and below the OECD average of 7% of total housing stock.560 Iwi and hapū-led housing projects are playing an important, if still under-resourced, role. The Waitangi Tribunal’s Wai 2750 Kaupapa inquiry into Māori Housing Policy and Services describes the impact of years of insufficient responses to Māori housing issues that have had an intergenerational impact on Māori communities, continuing to be felt today.561
Scaling up things that work
Below we identify existing housing initiatives that could be scaled up to meet current and future housing needs.
- Iwi and Māori-led housing initiatives within the MAIHI Ka Ora – National Māori Housing strategy (2022).562 The 2022 Whai Kāinga Whai Oranga funding pool of $731m over four years was the biggest investment in Māori housing and infrastructure in decades, but it remains inadequate in the face of the need and the decades of neglect - and requires long-term cross-party political commitment and scale-up.563
- Toitū Tairāwhiti, a collaborative of four iwi across Tairāwhiti and eastern Bay of Plenty (Ngāti Porou, Rongowhakaata, Ngai Tamanuhiri and Te Aitanga a Mahaki) has developed a partnership with Te Tūāpapa Kura Kāinga (Ministry of Housing and Urban Development). Having already built 51 new homes for whānau in the region, further investment is supporting 150 more whānau in their rohe into new homes.564 Similar agreements are being implemented with others such as Te Pouahi o Taitokerau (Northland hapū and iwi)565 and Ka Uruora (a collective iwi charitable trust based in Taranaki).566
- Fale mo Aiga – Pacific Housing Strategy 2030 plans home ownership for 500-700 Pacific peoples’ households, by 2030. A ten-fold scale up, as proposed by the Tamaiti ole Moana 2033 report - with the building of 5000 more suitable multigenerational homes for Pacific families through a range of approaches (including Kāinga Ora and community housing provider homes, and underwriting residential development) is a more realistic response to the housing needs of Pacific communities.492
- Scaling up the Warmer Kiwi Homes programme and Healthy Homes Initiative to target 30,000 homes of Pacific families with children for insulation and ventilation upgrades.
- Housing First Originating in Finland in 2007 and introduced in Aotearoa in 2017, Housing First recognises that it is easier for people to deal with complex issues, such as physical ill-health, mental health and addiction needs, if they have a stable place to live. It is targeted towards people who have complex needs and require intensive ongoing support services. Local research shows that after five years of having a home, there were significantly improved outcomes for people in the programme across mental and physical health (measured as reduced hospitalisations, outpatient visits and pharmaceutical use), but also in income levels (+38%) and significantly reduced police offences and criminal charges.255 The ‘Housing First’ approach could be adapted and scaled up to ensure, for example, that all low income whānau with children (or expecting them) can access a home and ‘wrap around’ support.
- Increase the proportion of affordable social housing and Kāinga Ora state-owned units of total housing stock to 7% by 2040.567
- An increase of social housing to 7% of total stock by 2040 would mean building an additional 3,600+ units each year (a similar rate to that in 2023-2024), to reach at least 140,000 dwellings by 2040, requiring a relative increase in building activity and budget required to achieve this. This compares with the funding of only 1500 new social houses announced in the 2024 Budget.
- As of April 2025, 84% of the over 86,400 social rental housing available was managed by Kāinga Ora, with more than 9800 new Kāinga Ora homes built between June 2023 and April 2025.425 Community Housing Providers (CHPs) provided the remainder, ranging from small charitable trusts and iwi to Councils, with 1670 additional builds in the same period.
- Providing lower-cost debt facilities to community housing providers (CHPs) via the Community Housing Funding Agency is useful, but CHPs alone are unable to build to the scale required, and leveraging up the capacity of Kāinga Ora is needed. With the current reduction in total new-builds (3000 fewer per month than in August 2023), the waiting list for social housing will continue at 20,000 to 25,000 households and may even increase further if immigration settings exacerbate existing housing shortages.567
- Replicate alternative Crown approaches to community housing, such as the Tāmaki Regeneration Programme.455
The Tāmaki Regeneration Programme
The Tāmaki Regeneration Programme includes three east Auckland suburbs close to central Auckland - Glen Innes, Panmure, and Point England. It is home to over 20,000 people, many for several generations, with over one-third of residents aged under 25 years. Sixty percent of residents identify as Māori and/or Pacific peoples. Mana whenua of Tāmaki include Ngāti Pāoa, Ngāi Tai ki Tāmaki and Ngāti Whātua Ōrākei. Sixty percent of housing in Tāmaki is social housing, with the first state houses built there in the 1930s, expanding with rapid urban growth after World War Two. The economic reforms of the 1990s had major impacts on the communities in Tāmaki, resulting in very high unemployment, declining household incomes, alcohol and drug issues, and community safety concerns.
Evolving from the 2007 “Tamaki Transformation” project (which was widely distrusted and perceived by the communities as ‘gentrification’ when selling off of state housing was proposed), the Tāmaki Regeneration Company (TRC) was created as a Schedule 4A Company in 2013 under the Public Finance Act (ensuring broader social and regeneration outcomes beyond simple commercial return). It is jointly owned by the Government and Auckland Council. After substantial community and mana whenua engagement, TRC developed an outcomes framework with four key priorities:
- Social (supporting Tāmaki whānau to thrive)
- Housing (building homes and communities)
- Economic (helping the local economy to thrive); and
- Placemaking (supporting local cultural identity and sense of belonging).
A key learning from this engagement was that people did not want just “a warm, dry home” …they said “we want to own our own house just like every other whānau in Aotearoa. And we want a quality job, good education for our kids and health.” [TRC]
In addition to the home building programme, TRC supports a shared home ownership programme, Innovation Hub and Jobs & Skills Hub, and partners with a range of community organisations to support social outcomes.
What has worked?
As of January 2025, 1,559 homes have been delivered, including 28 transitional homes, 420 public homes, 434 affordable homes (including 87 in the shared home ownership programme, 77% of whom are Māori and/or Pacific whānau) and 677 ‘market’ homes. In addition, over two hundred whānau have moved along the housing continuum into home ownership of an affordable home, 18% of these from public housing.
Other social outcomes have been positive. Over 1,458 local people have been supported into jobs since 2014, with 90% staying in jobs. In 2025, the Hub has placed 143 local people into employment, with 76% of placements Māori and/or Pacific peoples, as of June. TRC has also partnered with local iwi, community groups and agencies to support local innovators and entrepreneurs through the Innovation Hub, built the Kererū Kidney Centre to help make treatment more accessible for Tāmaki residents requiring dialysis, and supported the whānau-by-whānau programme (supporting whānau with immediate needs).
Success factors and enablers
The “Tāmaki commitment” - where TRC has committed to re-housing all whānau that want to stay in the area - has been a key to success. Building close relationships with mana whenua and community leaders, supporting community priorities, and hiring local people have been other critical factors. Important enablers include having a permissive framework from government, with the mandate to look at the whole housing system and its drivers rather than single products; owning assets locally and having the legal powers and structures to support delivery of objectives.
The future…
The housing pipeline takes 3-5 years to completed build, so long-term planning and budgets are needed. In the 2023 Budget Bid for 2024-2028, $870m was approved to deliver 742 houses up to 2028 and enable 468 houses after that period. TRC will build 742 new homes (a net 167 new homes), with a mix of 1-5 bedrooms (one-third will have 4-5 bedrooms). There will be 426 new social homes, 251 shared home ownership homes and 65 affordable rental homes.
TRC will submit resource consents for 1,673 homes and have the capacity and processes in place to support the delivery of 350-500 new homes every year from FY28. To note, the ability to deliver at this pace will be dependent on funding for both infrastructure and housing, and alignment between Tāmaki’s infrastructure programme and the TRC build programme.
Learnings…
Some projects that deliver on community aspirations and government priorities cannot easily be monetised by economic or cost-benefit models. TRC staff note that key learnings include:
- Build relationships with both mana whenua and wider community and establish desired outcomes with the community from the start.
- Focus on what you can do best, rather than going too broad; partner with community and other providers to deliver in areas where they are the experts, as this is more efficient and delivers greater outcomes on the ground.
- Be upfront and manage expectations.
- Understand early the associated in-ground infrastructure needs.
- A separate governance structure (with community representation) allows you to have strategic focus on the specific regeneration area, and to make the best decisions for that community – without the distraction of wider organisations or other developments.
Appendix 3. A timeline
Key dates and reports: determinants of health and health equity
Key reports are referenced in Yao et al568
| 1840’s | Chadwick E. Report on the Sanitary Condition of the Labouring Population of Great Britain (1842); Engels F. The condition of the working class in England (1845); Durkheim, E. (1897). Le suicide; Virchow R. Typhus epidemic and “social medicine” (1848);569 Du Bois WEB & Eaton I. The Philadelphia Negro: a social study. |
| 1946 | WHO Constitution and definition of health, including social wellbeing. |
| 1948 | United Nations (UN) General Assembly. Universal Declaration of Human Rights. |
| 1967 | The UK Whitehall Study of civil servants demonstrated a steep gradient based on social status. Compared with the highest grade (administrators), men in the lowest grade had 3 times the mortality rate from coronary heart disease, from a range of other causes, and from all causes.570 |
| 1973 | Andersen R & Newman JF. Societal and individual determinants of medical care utilization in the United States. |
| 1978 | Development of primary health care, including a comprehensive intersectoral approach and the Alma Ata Declaration. |
| 1980 | Black Report (UK): the United Kingdom Department of Health and Social Security published the Report of the Working Group on Inequalities in Health, also known as the Black Report (after chairman Sir Douglas Black, President of the Royal College of Physicians).571 |
| 1980 | Hauora: Māori Standards of Health by Eru Pomare and colleagues, with subsequent editions in 1988, 1985 and 2007.572 |
| 1985-1988 | The Whitehall II study (UK) investigated the “…degree and causes of the social gradient in morbidity” and showed a similar inverse relationship between employment grade and health as that for mortality.573 |
| 1998 | National Advisory Committee on Health and Disability (NHC) published The Social, Cultural and Economic Determinants of Health in New Zealand: Action to Improve Health.8 |
| 1999 | Michael Marmot and Richard Wilkinson “Social Determinants of Health.”88 |
| 2000 | Berkman LF & Kawachi I. Social Epidemiology. |
| 2000 | Office of Disease Prevention and Health Promotion, US Department of Health and Human Services: Healthy People 2010. Outlined two overarching goals: to enhance life expectancy and the quality of life and to eliminate health disparities between different segments of the population. |
| 2000 | Jones, C. Levels of racism: a theoretic framework and a gardener's tale.111 |
| 2000 | Reid et al. Disparities in health: common myths and uncommon truths.66 |
| 2002 | Commission on Macroeconomics and Health (World Health Organization) |
| 2002 | PHAC published The effect of environmental factors on the health of New Zealanders, highlighting significant environmental issues linked to ill health and health inequalities, such as air and water quality, as well as emerging issues (at the time) like climate change and health in urban environments.50 |
| 2002 | Ministry of Health. Reducing Inequalities in Health.52 |
| 2003 | Decades of Disparity. Ajwani Blakely, Robson et al., examined ethnic mortality trends in New Zealand from 1980-1999.205 |
| 2004 | The PHAC report, A Way Forward: Public policy and the economic determinants of health examined the relationship between socioeconomic status and health. It showed that the chances of enjoying good health and a long life reflect differences in socioeconomic position and ethnicity, and considered the role that public policy can play in reducing inequalities in health.51 |
| 2005 | World Health Organization (WHO) Commission on Social Determinants of Health (CSDH). |
| 2006 | Wilkinson RG & Pickett KE. Income inequality and population health: a review and explanation of the evidence. |
| 2006 | Van Doorslaer E, et al. Inequalities in access to medical care by income in developed countries [OECD]. |
| 2008 | Mackenbach JP et al. Socioeconomic inequalities in health in 22 European countries. |
| 2008 | Commission on Social Determinants of Health. Closing the Gap in a Generation: Health equity through Action on the Social Determinants of Health - Final report of the Commission on Social Determinants of Health.6 |
| 2014 | Beeston C et al. Health Inequalities Policy Review for the Scottish Ministerial Task Force on Health Inequalities |
| 2017 | Saunders M, Barr B, McHale P, Hamelmann C. Key policies for addressing the social determinants of health and health inequities. (WHO Regional Office for Europe)395 |
| 2022 | The Lancet Series: Racism, Xenophobia, Discrimination and Health.113 |
| 2023 | The Lancet Series: Commercial Determinants of Health.305 |
| 2023 | Waitangi Tribunal. Hauora: Report on Stage One of the Health Services and Outcomes Kaupapa Inquiry. 41 |
| 2025 | World Health Organization. World Report on Social Determinants of Health Equity.7 |
Appendix 4. Analysis of trends and indicators
In Aotearoa New Zealand there are important and persistent differences in access to the determinants of health and in health outcomes for different population groups. The aim of our analysis was to assess trends in key indicators of determinants and of health status, but more importantly, to understand the absolute and relative changes in the differences between population groups for each of these indicators over the last 25 years.
Selection of indicators
There are international and local frameworks that provide indicators for monitoring the determinants of health. These include the Sustainable Development Goals,574 the World Health Organization’s Operational framework for monitoring social determinants of health equity,209 the Treasury’s Living Standards Framework208 and Stats New Zealand’s Indicators Aotearoa New Zealand – Ngā Tūtohu Aotearoa.207 We reviewed these frameworks to inform our selection of indicators (see Tables 1 and 2).
Given resource and time constraints, our analysis is primarily based on indicators from publicly available datasets (see Tables 3 and 4 for the main sources used). This limited our choices of indicators, as many are not available by the level of disaggregation and/or the timeframe (from 2000) that we sought. Additionally, changes over the last 25 years in the definitions of some indicators (e.g. severe housing deprivation) and the way in which some were measured (e.g. frequency of measurement and size of samples) made assessment of trends over time more challenging.
Disaggregation
We analysed the chosen indicators by multiple variables such as gender, socioeconomic deprivation, ethnicity, disability and age where applicable. The report presents a selection of graphs that demonstrate important differences and/or trends.
We present many indicators by ethnic group. Ethnicity is the ethnic group or groups that people identify with or feel they belong to. It is self-perceived, and people may belong to one or more ethnic groups. In Aotearoa New Zealand, ethnicity is an evidence-based marker of health need.575,576 At any given level of socio-economic deprivation, Māori and Pacific peoples have poorer health outcomes than other ethnic groups.15,577,578
Ethnicity Data Protocols for the Health and Disability sector guide the collection, classification, recording and output of ethnicity data.579 When people identify with multiple ethnic groups, various methods are used to assign a single ethnic group for the purposes of reporting and analysis.
“Prioritised ethnicity” is used in many health analyses, whereby each respondent is allocated to a single ethnic group using an established prioritisation framework that ensures that ethnic groups of policy importance or of small size are recognised first.579 Māori, Pacific peoples and Asian are prioritised as the first three groups. So, for example, if someone identifies as Māori, Pacific and European, they will be assigned prioritised Māori ethnicity.
Stats New Zealand and the New Zealand Health Survey use “total response” ethnicity. “Total response” refers to a method where each person is counted in all of the ethnic groups they identify with; this means the total number of responses is bigger than the number of respondents.
Ideally, the method used for assigning ethnicity should be related to the context and question being asked.580,581 Prioritised ethnicity is the preferred method to analyse inequities between Māori and non-Māori; total response ethnicity will underestimate inequities between Māori and European ethnic groups because there will be many Māori who are also counted in the comparator European total response group. However, analyses using prioritised ethnicity undercount some ethnic groups, particularly Pacific peoples. Additionally, the assigned ‘prioritised’ ethnicity may not reflect the ethnicity a person most strongly identifies with.
There are well-documented problems related to the completeness and quality of ethnicity data in Aotearoa New Zealand. Post-enumeration surveys indicate the Census has an undercount which is greater for Māori, Pacific and Asian peoples than for Europeans. This leads to inaccurate population estimates, which can have impacts on policy and implementation, especially for those with highest health needs.582,583 Māori continue to be underrepresented in health data sets compared to official population numbers.584
This report draws on a variety of data sources which have different ways of reporting outcomes for populations. Given the time and resource constraints for this report, we were limited to using outputs that were readily available. Consequently, ethnicity groupings are not consistent throughout the report. For determinants of health, total response ethnicity is used and data on four population groups is graphed: Māori, Pacific, Asian and European. We acknowledge that there are groups in the population (such as people of Middle Eastern, Latin American and African ethnicity) that are not included in these graphs.
For health outcomes, prioritised ethnicity is used (except for the New Zealand Health Survey). Some health outcome data are presented as a comparison between Māori and non-Māori/non-Pacific populations, while other health outcome data are presented for four groups: Māori, Pacific, Asian and non-Māori/non-Pacific/non-Asian (nMnPnA).
Surveys
Some of the data presented come from surveys and therefore represent estimates of that measure within the population. Where sample sizes are small the accuracy of estimates, particularly for sub-populations, are less certain. In our data analysis we have chosen not to include confidence intervals but acknowledge that the confidence intervals could be large when groups are small. We note that data collection for the 2021-22 Household Economic Survey was restricted by both COVID-19 and weather-related events, resulting in a smaller number of households being interviewed.
Selected indicators
Tables 1 and 2 illustrate the complete set of indicators we have selected. Indicators graphed in Section 3 are asterisked. The remainder are appended in the online version of the report. The final two columns of Table 1 show whether the indicator is in the World Health Organization’s Operational framework for monitoring social determinants of health equity209 and/or Stats New Zealand’s Indicators Aotearoa New Zealand – Ngā Tūtohu Aotearoa.207
*Indicators that are included as Figures in Section 3
a. World Health Organization. Operational framework for monitoring social determinants of health equity, 2024.209
b. Stats NZ. Wellbeing data for New Zealanders.207
*Indicators that are included as Figures in Section 3 (where disaggregation is by multiple variables, the disaggregation with the asterisk is shown as a Figure in Section 3)
We have used data from a wide variety of sources, such as the census, national surveys, reports and web tools. Many of these are publicly available and are summarised in the tables below.
| Information Source | Summary | Reference |
|---|---|---|
| *Census | Official count of people and dwellings in Aotearoa New Zealand every 5 years. | Stats NZ | Tatauranga Aotearoa. Census. 2024. (accessed June 11, 2025) https://www.stats.govt.nz/census/ |
| *Household Economic Survey (HES) | Annual survey on household income, savings, and expenditure. ~20,000 households surveyed. | Stats NZ | Tatauranga Aotearoa. Household income and housing cost statistics – HES (Income). 2024 (accessed June 11, 2025) https://datainfoplus.stats.govt.nz/item/nz.govt.stats/27d850c1-939c-4e93-b61c-a1b5196b7f27 |
| *Household Labour Force Survey (HLFS) | Quarterly survey of people employed, unemployed and not in the labour force. ~15,000 households each quarter | Stats NZ | Tatauranga Aotearoa. Household Labour Force Survey sources and methods: 2025. 2025 (accessed June 11, 2025) https://www.stats.govt.nz/methods/household-labour-force-survey-sources-and-methods/ |
| *General Social Survey (GSS) | Survey that reports every two years on wellbeing. ~12,000 individuals | Stats NZ| Tatauranga Aotearoa. About the General Social Survey. 2023 (accessed June 11, 2025) https://www.stats.govt.nz/help-with-surveys/list-of-stats-nz-surveys/about-the-general-social-survey/ |
| *Stats NZ | Collects and publishes data from censuses and surveys and publishes insights. | Stats NZ |Tatauranga Aotearoa. Homepage (accessed June 11, 2025) Home | Stats NZ |
| Kiwis Count Survey | Quarterly survey on people’s trust in public services. ~ 2,000 people surveyed per quarter. | Public Service Commission | Te Kawa Mataaho. Rangahau Kiwis Count. (accessed June 11, 2025) https://www.publicservice.govt.nz/research-and-data/kiwis-count . |
| Education Counts | Includes reports and data on students in the education system from early learning to tertiary. | Ministry of Education | Te Tāhuhu o Te Mātauranga. Education Counts. 2025. (accessed June 11, 2025) https://www.educationcounts.govt.nz/statistics |
| Ministry for the Environment | Provides reports on the state of the environment e.g. air, climate change, fresh water. | Ministry for the Environment | Manatū mo Te Taiao. Facts and science. 2025 (accessed June 10, 2025) |
| Ministry of Social Development | Provides reports on household incomes, material wellbeing, poverty, inequality and hardship. | Ministry of Social Development | Te Manatū Whakahiato Ora. Household incomes, material wellbeing, poverty, inequality and hardship. 2025 (accessed June 10, 2025) https://www.msd.govt.nz/about-msd-and-our-work/publications-resources/research/household-incomes-material-wellbeing-poverty-inequality-and-hardship.html |
*Tools:
- Aotearoa Data Explorer - Stats NZ | Tatauranga Aotearoa. Aotearoa Data Explorer. 2025 (accessed June 11, 2025) https://explore.data.stats.govt.nz/
- Infoshare - Stats NZ | Tatauranga Aotearoa. Infoshare. 2025 (accessed June 11, 2025) https://infoshare.stats.govt.nz/
- Place and ethnicity group summaries - Stats NZ | Tatauranga Aotearoa. Place and ethnic group summaries. 2025 (accessed June 11, 2025) https://tools.summaries.stats.govt.nz/
| Information Source | Summary | Reference |
|---|---|---|
| New Zealand Health Survey | Continuous ‘rolling’ survey of the health and wellbeing of children and adults reported annually. 9,719 adults and 3,062 children surveyed in 2023/24. | Ministry of Health | Manatū Hauora. New Zealand Health Survey. 2025 (accessed June 12, 2025) /node/1811 |
| Virtual Diabetes Register | Provides estimates of the number of people with suspected diabetes based on hospital discharges, outpatient attendance, pharmaceutical dispensing and laboratory tests. | Health New Zealand | Te Whatu Ora. Virtual Diabetes Register and web tool. 2024 (accessed June 12, 2025) https://www.tewhatuora.govt.nz/for-health-professionals/data-and-statistics/diabetes/virtual-diabetes-register-web-tool |
| Maternity web tool | Provides annual statistics on people giving birth, their pregnancy and characteristics of live-born babies from the National Maternity Collection. | Health New Zealand | Te Whatu Ora. Report on maternity web tool. 2024 (accessed June 12, 2025) https://www.tewhatuora.govt.nz/for-health-professionals/data-and-statistics/maternity/report-on-maternity-web-tool |
| Immunisation coverage | Annual and quarterly reporting of immunisation coverage. | Health New Zealand | Te Whatu Ora. Immunisation Coverage. 2025 (accessed June 11, 2025) https://www.tewhatuora.govt.nz/health-services-and-programmes/vaccine-information/immunisation-coverage |
| New Zealand Child and Youth Epidemiology Service | Provides reports on the health of children and young people. | New Zealand Child and Youth Epidemiology Service. Collating and disseminating information on the health of children and young people in New Zealand. 2025 (accessed June 12, 2025) |
Table 5: How are we tracking? A scorecard
| Determinants | Total population trend | Trends by sub-group | Trends in total population measures, and in absolute and relative inequities by ethnic group, gender, age and disability |
|---|---|---|---|
| Income (individual and household) |
|
| Real increase in all household incomes 2007-2021 but no change in income gaps by ethnic groups. Decrease in gender gap overall but large inequities for women by ethnic group. |
| Income inequality |
|
| No substantial change since 2000. Housing costs contribute to increased net income inequality, which impacts differentially on low-income families. |
| Child poverty |
|
| Absolute reductions in measures of child poverty for all ethnic groups from 2007-2009 up to 2022/23 - but increases in relative inequity. Significant increases in material hardship in 2023/24. |
| Food security (in households with children <15 years) |
|
| Food insecurity measures improved from 2012/13 up to 2020/21 but have significantly worsened since 2022/23. Large inequities for Pacific peoples (2.4 times higher than non-Pacific), disabled (1.6 times non-disabled) and children living in the most deprived quintiles compared with least deprived (2.9 times higher). |
| Unemployment |
|
| Total employment fell from 2011/12 to 2022/23 with reductions in absolute and relative inequities. However, there are stark inequities by ethnic group, age and region, which are exacerbated in economic recession. |
| Not in Employment, Education or Training (NEET) |
|
| Little change in overall NEET over last decade; now increasing again. Small reductions in absolute and relative inequities by ethnic group 2010-2020. |
| ECE attendance |
|
| Narrowing of absolute and relative ethnic inequities since 2000, but increasing again since 2020 |
| School attendance |
|
| Attendance overall declining since 2015, exacerbated by COVID-19 pandemic. Inequities slightly increasing by ethnic group and School Equity Index. |
| Attainment NCEA Level 2+ |
|
| Increased for all ethnic groups up to 2020 but declining for all groups since. |
| Kaupapa Māori schooling |
|
| Increasing numbers of children enrolled after earlier declines. |
| Household crowding |
|
| A small reduction in relative inequities but an overall increase in household crowding for all ethnic groups compared with 2001. |
| Housing ownership |
|
| Declining for all ethnic groups up to 2023, and with increased inequities, especially for Pacific peoples. |
| Iwi affiliation |
|
| Growth in iwi affiliation in Census data. |
| Te reo speakers |
|
| Increases mainly due to population growth. |
| Loneliness |
|
| Worsening indicator up to 2022/2023; marked differences by age group. The measure continued to worsen for young adults 25-34 years in 2023/2024. Disproportionately experienced by disabled people. |
| Trust |
|
| Increasing inequities by ethnic group and by age group (younger people>older) in trust in institutions and in community. |
| Environmental indicators |
|
| Climate and biodiversity measures show declines in most indicators. |
| Greenhouse Gas Emissions (GHG) |
|
| GHG emissions heading in the right direction, but not yet at 1990 levels |
Legend
Progress made, inequities reducing
Progress stalled, no change in inequities
Negative trend, increasing inequities
| Health indicator | Total population trend | Trend in sub-groups | Trends in total population measures, and in absolute and relative inequities by ethnic group, gender, age and disability. |
|---|---|---|---|
| Life expectancy |
|
| Overall increase in life expectancy (LE). Narrowing of the absolute difference in LE for Māori, but small increase for Pacific peoples compared to nMnP. Gaps also persist by socioeconomic status, disability and region. |
| Infant mortality and child mortality |
|
| Overall reductions in mortality (note small numbers). Some reductions in absolute and relative inequity for Māori compared with non-Māori but worsening for Pacific infants. Still unacceptable differences by socioeconomic status (NZDep quintile) for infants and children. |
| Heart disease, stroke and circulatory mortality |
|
| Halving of total population CVD mortality. Important reduction in absolute inequity between Māori and nMnPnA. Relative inequities persist for Māori and Pacific peoples. |
| Diabetes prevalence |
|
| Total population increase in prevalence. Increase in absolute inequity for Pacific peoples and relative inequities persist for Māori, Pacific and Indian peoples, and by level of socioeconomic deprivation. |
| Psychological distress |
|
| Marked rise for all since 2011/12. Large inequities by age group (young people>>older people), ethnic group, socio-economic status and disability. |
| Oral health |
|
| Poor data; incomplete. Likely no significant overall improvement, and persistent inequities by ethnic group, rurality and socioeconomic status. |
| Health risk factor: smoking |
|
| Significant reduction in smoking rates for all, across all ethnic groups and ages. Relative inequities persist for Māori and Pacific peoples, disabled people and those living in the least advantaged areas. |
| Health risk factor: vaping |
|
| Significant increase in vaping rates for all since 2017. However major inequities by ethnic group, socioeconomic deprivation and age (15-24yrs). |
Legend
Progress made, inequities reducing
Progress stalled, no change in inequities
Negative trend, increasing inequities
Appendix 5. AI terminology
Definitions -the language of artificial intelligence
Artificial intelligence
The term ‘AI’ incorporates machine intelligence, machine learning, robotic intelligence, and artificial general intelligence (AGI).
Machine intelligence
Machine intelligence (also called ‘machine learning’) reproduces human ability to detect, describe and analyse patterns in data. It learns from, and acts on, the patterns to refine its capabilities.
Deep learning
Deep learning is a type of machine learning that uses artificial neural networks. These networks mimic how neurons in the human brain signal to one another. Deep learning needs a lot of data but has a powerful predictive capability. It is used in tools like voice recognition, fraud detection, self-driving cars and fintech. AI models built with deep learning can learn shortcuts from the data they’re trained on. This allows them to simulate processes more accurately, and much quicker, than methods that rely on computation.
Artificial general intelligence
AGI (also called ‘full AI’ or ‘human-level AI’) coordinates and integrates AI, so it can operate with a full, or extended, range of human abilities, which aims to match, or surpass, anything human. AGI produces broad and deep data analysis, findings and recommendations, faster – and potentially better – than humans.
Superintelligence
Most machine-learning experts think AGI will quickly and vastly outstrip the combined cognitive capacities of humans. It could become capable of revolutionary technological and economic advances in every sector, much more rapidly than is currently possible.
Source: Adapted from Henderson P. At the cutting edge: How Artificial Intelligence will change our primary sector forever. Auckland, 2023.356
Appendix 6: Te reo glossary
Aotearoa
New Zealand
Hapū
Kinship group, sub-tribe
Hauora
Health, wellbeing
Hui
To gather, assemble; meeting
Iwi
Tribe (In the context of this report ‘iwi’ is sometimes used more broadly to include post settlement entities).
Kai
Food
Kaiārahi
Navigators
Kaitiakitanga
Guardianship
Kāinga
House, home
Kaupapa
Purpose, policy, initiative, theme or topic
Kīngitanga
The King movement
Kōhanga reo
Māori language preschool
Kura kaupapa
Māori school
Mana
Prestige, authority, influence
Mana motuhake
Autonomy, self-government, independence
Māori
Indigenous people of Aotearoa
Marae
The open area in front of the wharenui, where formal greetings and discussions take place. Often also used to include the complex of buildings around the marae.
Mātauranga
Knowledge, wisdom
Mauri oho
Energised life force
Mokopuna
Future generations (grandchild, descendant)
Oranga
Wellbeing
Ōritetanga/Rite tahi
Equity
Pae Ora (Act)
Healthy Futures Act (2022)
Papakāinga
Housing on ancestral land
Pākehā
New Zealander of European descent
Rangatahi
Young person
Taiao
Environment, natural world
Tairāwhiti
Gisborne/East Cape district
Tamariki
Child/children
Tangata Tiriti
Those who do not whakapapa Māori but belong to the land by right of Te Tiriti o Waitangi (coined by Sir Edward Taihakurei Durie in 1989)
Tangata whenua
Indigenous people; people born of the whenua
Taonga
Treasure, property or possession
Te Tai Tokerau
Northland
Te Tiriti o Waitangi
The Treaty of Waitangi
Te reo Māori
Māori language
Tikanga
The customary system of values, laws and practices that have developed over time and are deeply embedded in the social context
Tino rangatiratanga
Sovereignty, self-determination
Tūpuna (or tīpuna)
Ancestors
Wahakura
A woven flax bassinet
Waka
Canoe, vehicle
Wānanga
To talk, discuss
Wāhine
Female, women
Whare wānanga
Place of higher learning, university
Whakapapa
Genealogy, family lineage
Whānau
Extended family, family group
Whenua
Land, country
Appendix 7: Additional data trends 2000–2024
In section 3 of the main report we examine trends in important determinants of health and health outcome indicators. In this annex we provide additional indicators to provide a more comprehensive picture of the important and diverse factors that contribute to our health and wellbeing.
Additional trends in determinants of health 2000–2024
Workplace deaths, injuries and ill health
While unemployment negatively affects wellbeing, being in work is associated with social status, greater income, and may also offer structure and purpose.228 However, work can also be associated with exposures to health risks, including acute injuries, chronic exposure to hazards such as asbestos, and psychosocial stress.585
The rate of work-related acute fatal injuriesx in Aotearoa New Zealand is 1.6 times higher than in Australia and 6.4 times higher than in the UK.586 Although the rate of workplace deaths in Aotearoa New Zealand has declined overall in the last 20 years, there have been notable exceptions resulting from the Pike River mine explosion (2010), the Canterbury earthquakes (2011) and the Whakaari/White Island eruption (2019) (see age-standardised rate, 3-year moving average (Figure 35)).
Each year in Aotearoa New Zealand an average of 50 to 60 workers are killed while at work.585 Some occupations are at higher risk of adverse physical exposures. From 2011 to 2022, over 50% of fatalities involved a vehicle, and more than 90% of fatalities were among male workers. Forestry and logging had the highest rate of fatalities.585
Figure 35. Work-related acute fatalities, number and age-standardised rate, 2002-2021
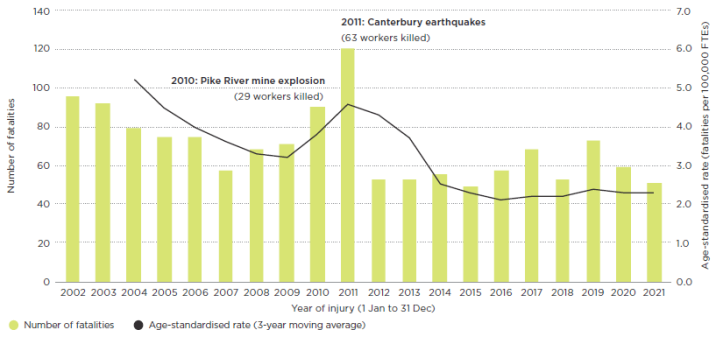
Copied from: Worksafe | Mahi Haumaru Aotearoa. High level summary - Work health and safety: An overview of harm and risk in Aotearoa New Zealand 2024 page 3.587
There were over 400 work-related serious non-fatal injuriesxi annually between 2017 and 2021.585The rate of serious injury has decreased since 2002, with a steeper decrease in the rate for Māori than non-Māori. Between 2002-04 and 2019-21, after adjusting for changes in workforce size and age structure, the rate of serious non-fatal injury reduced by 30% for Māori workers and by 19% for non-Māori workers (Figure 36), but the rate of injury remained higher for Māori than non-Māori workers.585
Figure 36. Work-related serious non-fatal injuries, age-standardised rate for Māori and non-Māori, 2002-04 to 2019-21
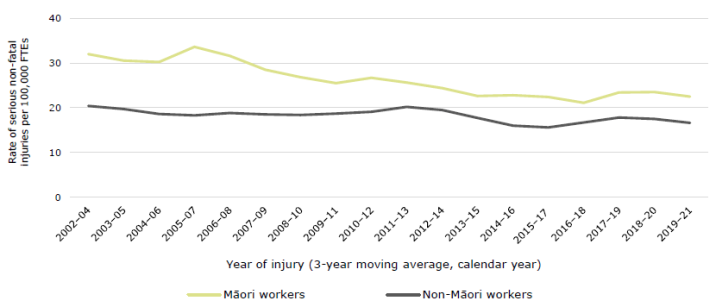
Copied from: Worksafe | Mahi Haumaru Aotearoa. Work health and safety: an overview of work-related harm and risk in Aotearoa New Zealand 2024. Page 19, Figure 12585
Chronic exposure to hazards at work (such as benzene, solar radiation, crystalline silica, wood dust and asbestos), causes more illness and death than acute injury. Common causes of work-related death and ill health are lung cancer, mesothelioma, chronic obstructive pulmonary disease, ischaemic heart disease, musculoskeletal disorders and mental ill health.585 Worksafe’s 2019 analysis estimates that a worker is 15 times more likely to die from a work-related disease than from a workplace accident.588 Worksafe estimates that annually there are 750 to 900 work-related health deaths (excluding those caused by injury) and 5,000-6,000 hospitalisations.589
[x] The Worksafe definition of work-related fatalities includes workers who die from injuries while working and members of the public who die as a result of someone else’s work activity. However, our analysis does not include non-worker fatalities as it is based on work that excluded this group due to inconsistencies in definitions over time.
[xi] Worksafe defines serious non-fatal injuries as injury events in which a patient admitted to hospital is determined to have a probability of death of at least 6.9%
Severe housing deprivation
Severe housing deprivation is the official term for homelessness and is defined by Stats NZ as “a living situation where people with no other options to acquire safe and secure housing are without shelter; in temporary accommodation; sharing accommodation with a household; or living in uninhabitable housing.”590 Of these four types of severe housing deprivation, those living in uninhabitable housingxii form the largest group of people, comprising 61% of the severely housing deprived population in 2023.592
The number and proportion of people who were severely housing deprived increased from 99,462 (2.1% of the population) in 2018 to 112,496 (2.3%) in 2023.592 Severe housing deprivation prevalence increased for all ethnic groups between 2018 and 2023 except for Asian people (Figure 37). Estimates of severe housing deprivation from the 2023 census indicate marked inequities by ethnic group, age and disability. Compared with Europeans, Pacific peoples are more than 5 times and Māori more than 3 times as likely to experience homelessness. Disabled people, children, young people (15 to 29 years) and people identifying as LGBTQIA+ also experience higher rates.592
Measures of severe housing deprivation are considered estimates because they are constructed from a combination of variables rather than being counted from a single direct question to individuals in the census. The estimates are likely to undercount the true population experiencing severe housing deprivation. Additionally, uninhabitable housing was not assessed prior to 2018, and so people living in those conditions were not included. Comparison of rates of severe housing deprivation over time requires caution due to the above and other methodological reasons.593
Figure 37. Severe housing deprivation by total response ethnicity, 2001-2023

Source: 2018 and 2023 ADE Stats NZ Census. 2001-2013 Amore K. (2016). Severe housing deprivation in Aotearoa/New Zealand: 2001-2013. Table 5.594
*For 2001-2013, this group is Non-Māori/non-Pacific/non-Asian/non-MELAA
[xii] Uninhabitable housing is defined as dwellings that lack at least one of six basic amenities (drinkable tap water, electricity, cooking facilities, a kitchen sink, a bath or shower and a toilet). To be included in this category, the residents also have to be assessed as having a low income.591
Experience of racial discrimination
Experience of racism is associated with poorer health and wellbeing measures.595 Questions on experience of racial discrimination were asked in the New Zealand Health Surveys of 2011/12, 2016/17 and 2020/21. Māori, Pacific peoples and Asian people report experiences of racism more than European New Zealanders.123,595
In the 12 months before the 2020/21 survey, 13.8% of Māori, 9.5% of Pacific peoples, 12.3% of Asian and 4.8% of adults identifying as solely of European or other nMnPnA ethnic groups* reported experiencing racial discrimination (Figure 38).596 The proportion of Māori who experienced racial discrimination in the past 12 months increased from 10.8% in 2011/12 to 13.8% in 2020/21. In 2020/21 the experience of racial discrimination in the previous 12 months differed by gender, affecting 16.8% of Māori women and 10.7% of Māori men.596
Figure 38. Experience of racial discrimination in the past 12 months by ethnic group*, 2011/12, 2016/17 and 2020/21
Use arrow keys to navigate the key indicator items.
- Download
- Download dataset
- Source
Ministry of Health | Manatū Hauora. 2023. Racial Discrimination 2011/12, 2016/17 and 2020/21: New Zealand Health Survey. Adapted from Page 9, Figure 3596
Digital technologies
There have been rapid changes in digital technologies in the last 25 years, with internet use and the introduction of artificial intelligence being of particular significance. These technologies continue to transform how we engage in and perform activities, including our social relationships, learning, work, and interactions with institutions. This in turn shapes health outcomes, from direct impacts on mental and physical health to the ability to access health and other services using these technologies.346,597
Access to the internet
Household access to the internet increased dramatically between 2001 and 2013, then continued to increase gradually through to 2023. While there was a large gap between ethnic groups in access to the internet in 2001, this has closed. In 2023, 94% of Europeans and 91% of Māori had internet access at a household level (Figure 39). People on low incomes and those aged over 75 years have lower access to the internet than the general population.597,598 Given that many organisations (in health care and other sectors such as social, housing, education and employment) provide information and services online, lack of internet access is a major barrier to accessing these services.
Figure 39. Access to the internet at a household level, by total response ethnicity, 2001-2023
Use arrow keys to navigate the key indicator items.
- Download
- Download dataset
- Source
2013-2023 Stats NZ Aotearoa Data Explorer. 2001 and 2006 Ministry of Social Development Te Manatū Whakahiato Ora. The Social Report: Te pūrongo oranga tangata. 2016. Page 222, Table SC1.1 599
Screen time
We are spending an increasing amount of time on screens (which includes computers, tablets, mobile devices and television). In 2014-15, children aged 11 to 13 years who participated in the New Zealand Kids Cam project used screens on average for over one third of their time after school.600 Data from the New Zealand Health Survey on the amount of time children spend engaging with screens is expected in November 2025. The OECD Programme for International Student Assessment (PISA) found that 15-year-olds in Aotearoa New Zealand spent 20 hours a week on the internet in 2012. This had increased to 42 hours per week by 2018.601
The use of social media by young people has benefits and harms. While it provides a means of social connection, support and information, there are concerns about its potential addictive nature and possible effects on mental health,602 cyberbullying,603 exposure to inappropriate content and marketing and managing safety online.347,460,604
Justice system
People who are or have been in prison generally have poorer health outcomes and higher health needs than the general population.605 For example, 62% of prisoners interviewed in 2015 in Aotearoa New Zealand had a diagnosis of a mental health or substance use disorder in the previous 12 months, three times the rate of the general population.606 This disparity is seen for other health conditions, including oral health, chronic diseases, and communicable diseases.605 Additionally, those who have contact with the prison system have higher mortality rates following release. People released from prison in Aotearoa New Zealand between 1998 and 2016 had more than three times the death rate of the general population.607
There is evidence of systemic bias in how the justice system interacts with some populations, including Māori, and disabled people. An Independent Panel commissioned by New Zealand Police | Nga Pirihimana O Aotearoa found evidence of bias at structural, institutional and interpersonal levels.608 This research found that all other things being equal, Māori were 11% more likely to be prosecuted by Police than NZ Europeans and experienced higher levels of police apprehensions, use of force incidents and TASER deployment.608
In Aotearoa New Zealand, more than half of the people in prison are Māori,609 while making up 18% of the total population (2023 Census). In recent years, there has been an increase in the prison population held on remand, and this increase is projected to continue.610 The reasons behind this include increased use of technology identifying people who do not meet bail conditions and increasingly lengthy court proceedings, which delay trials and sentencing.431 These delays have disproportionately affected Māori.431
Males make up over 90% of prisoners.609 The rates of imprisonment of sentenced Māori males compared with European males under 30 years are shown in Figure 40. There has been a significant decrease in the rate of imprisonment of Māori men under 30 years since 2000.611 However, imprisonment rates for Māori men aged over 30 years have increased.611 This reflects changes in the exposure of different age cohorts to varying policy settings across time.
Figure 40. Comparisons of European and Māori trends in imprisonment rates for males under 30 years
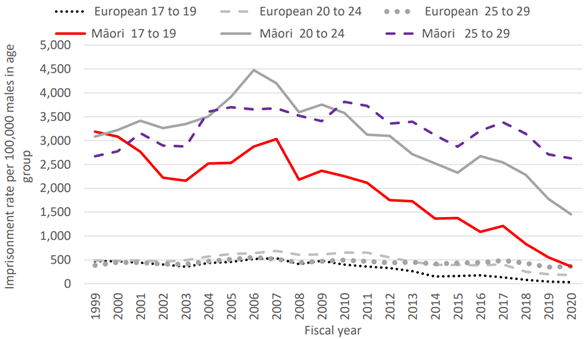
Source: Copied from Cook L. Examining the over-representation of Māori in prisons: 1910 to 2020. Page 16, Figure 9611
There has been recent success in reducing incarceration of young people (while inequitable rates between ethnic groups persist). Historically, the high proportion of Māori children entering state care was associated with subsequent high rates of imprisonment of these cohorts.431,611 Policy settings that reduce the number of children in State care, the incarceration rate of young people, and that prioritise the health and wellbeing of those who come into contact with the Justice system can improve outcomes and health equity for this population.
Air quality
Air pollution contributes to cardiovascular diseases such as strokes and heart attacks and respiratory diseases such as chronic obstructive pulmonary disease and lung cancer. It exacerbates asthma and bronchitis.612 In Aotearoa New Zealand the air pollutants that have the biggest impact on health are nitrogen dioxide and fine particulate matter that measures less than 2.5µm (PM2.5).613
We breath in particulate matter, which can settle in our throat and lungs causing respiratory and cardiovascular effects. The very fine particles, called PM2.5, travel to the lungs, while the larger ones (PM10 – measuring less than 10 µm) reach the nose and throat. Particulate matter mainly comes from domestic fires, but also from other sources such as motor vehicles (brake/tyre wear) and windblown dust from industry and construction. Levels of particulate matter have reduced in recent years, related to interventions to reduce domestic fire emissions. In Aotearoa New Zealand, between 2006 and 2016 there was a decrease of 21% in exposure to human-generated PM2.5 and an estimated decrease in premature deaths (-9%) and hospitalisations (-11%) from PM2.5.613
Long-term exposure to nitrogen dioxide increases the risk of premature death and respiratory illness, and short-term exposure to high concentrations can trigger asthma attacks. Motor vehicle emissions, particularly diesel vehicles, are the most common source of nitrogen dioxide in Aotearoa New Zealand. Between 2006 and 2016, the modelled average concentration of nitrogen dioxide that people were exposed to increased by 13%, with an estimated 28% increase in premature deaths and 39% increase in hospitalisations related to nitrogen dioxide.613 Exposure to nitrogen dioxide is not uniform across population groups: in 2016, 31% of the total population and 55% of Pacific peoples lived in areas with annual average nitrogen dioxide higher than the WHO 2021 guideline.614
In 2019, it was estimated that human-made air pollution in the form of PM2.5 and nitrogen dioxide was a factor in 3,239 premature deaths, 13,237 hospitalisations, 12,653 cases of childhood asthma and over 1.771 million restricted activity days.615
In most monitoring sites there was improvement in levels of particulate matter and nitrogen dioxide between 2016 and 2023.616,617 However, concentrations continue to exceed the WHO guidelines, especially during winter and in urban areas.17,616,617
Freshwater
The health of freshwater ecosystems is inseparable from the wellbeing of the environment and communities. Freshwater is a taonga for Māori and has an important place in tikanga, mātauranga and mahinga kai.618 Despite widespread acknowledgement of the importance of freshwater health (made explicit in the concept of Te Mana o Te Wai in freshwater policies released in 2020), there has been ongoing degradation of some rivers, lakes, wetlands and groundwater.17,619
The quality of freshwater in Aotearoa New Zealand has been degraded by many things including agriculture, industry, wastewater and storm water.17 This leads to contamination with bacteria and excess nitrates, which has negative consequences for environmental and human health.17,620 Between 2019 and 2024, 12% of monitored groundwater sites exceeded maximum acceptable values for nitrates.621 Certain regions, such as Canterbury, are particularly affected (with the situation predicted to worsen due to the time it takes for nitrates to move through groundwater sites).622
The presence of E. Coli in freshwater indicates contamination with animal or human faeces. It is used as a proxy to indicate likely contamination with other pathogens such as campylobacter that cause illness in humans. Between 2001 and 2020, 41% of river monitoring sites were worsening in terms of E. Coli levels and 37% were improving623 (Figure 41). Contamination of groundwater drinking sources is also a concern. In 2023, 6% of 11, 026 samples from water bores and 33% of samples from springs failed to meet the drinking water standard for E. Coli.624
Figure 41. E. Coli trend direction 2001-2020
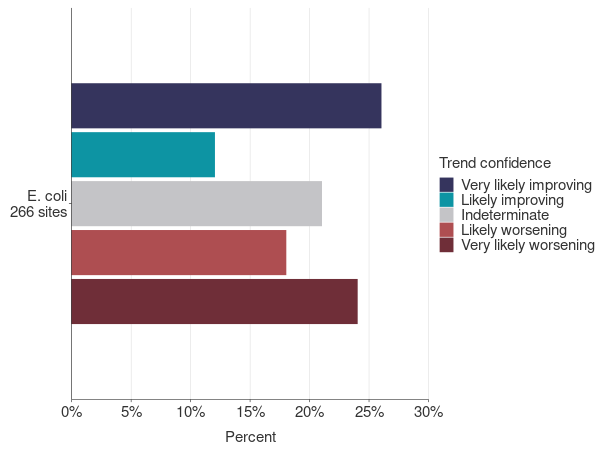
Copied from: Stats NZ 2022 623
Trends in health outcomes 2000-2024
In this section we provide some additional data on trends in health outcomes (child mortality, lung cancer, prevalence of diabetes) and risk factors (excess body weight and alcohol consumption) that complement those described in section 3. We also look at a selection of indicators as proxies for access to health care (including potentially avoidable hospitalisations, enrolment with Lead Maternity Carers and childhood immunisation coverage).
Child mortality
There have been persistent differences in mortality rates for children aged 1 to 14 years by ethnicity and socio-economic deprivation.278 Since 1990-91, death rates in children aged 1 to 14 years declined for all socio-economic groups, with a substantial reduction in the absolute inequity in mortality rates between children living in the most socioeconomically deprived areas compared with the least deprived areas (Figure 42).
However relative inequity persists, with death rates consistently 2 to 4 times higher for those living in the most socioeconomically deprived areas, compared with the least deprived areas. Mortality rates for children living in the most socioeconomically deprived quintile today are higher than those for children in the most privileged quintile over 30 years ago.278
Figure 42. Mortality rates of children aged 1-14 years by New Zealand Index of Deprivation (NZDep) quintile, 1990 to 2018
Use arrow keys to navigate the key indicator items.
- Download
- Download dataset
- Source
New Zealand Child and Youth Epidemiology Service. From Adams et al 2022. Page 8, Figure 2.7278
Deaths from lung cancer
There is a lag time of 20 to 30 years between reductions in population tobacco use and changes in lung cancer mortality.625 Between 2000 and 2020, there was a gradual decline in the mortality rate from lung cancer for all ethnic groups (Figure 43). The mortality rate from lung cancer reduced more for Māori than for other ethnic groups during this time, resulting in a reduction in absolute inequities for Māori compared with non-Māori/non-Pacific/non-Asian (nMnPnA) people. However, relative inequities persist, with rates for Māori remaining 3 times that of nMnPnA people since 2007.
Further substantial reductions in smoking rates for Māori have occurred since 2013/14 (Figure 31, Section 3), which should reduce future lung cancer mortality rates. If a lung cancer screening programme is introduced and successfully implemented, this could further reduce relative and absolute inequities in lung cancer mortality.626
Figure 43. Mortality rates related to malignant cancers of the trachea, bronchus and lung*, by prioritised ethnicity, WHO age-standardised, 2000-2020
Use arrow keys to navigate the key indicator items.
- Download
- Download dataset
- Source
Mortality Collection.
Prevalence of diabetes
The Virtual Diabetes Register estimates the number and proportion of people with type 1 and type 2 diabetes in the Aotearoa New Zealand population at any point in time (prevalence). Diabetes is more common in populations living in the most deprived neighbourhoods (74 per 1,000 people in 2023) compared with the least deprived (28 per 1,000 people in 2023) (Figure 44).281 The estimated prevalence of diabetes by prioritised ethnicity is shown in Section 3, Figure 26.
Figure 44. Estimated prevalence of diabetes (type 1 and type 2) by New Zealand Index of Deprivation (NZDep), WHO age-standardised, 2013 to 2023
Use arrow keys to navigate the key indicator items.
- Download
- Download dataset
- Source
Virtual Diabetes Register, Health New Zealand Te Whatu Ora
The rising incidence (new cases) and prevalence of diabetes parallels increases in excess body weight (EBW). While we acknowledge the limitations of body mass index (BMI) measurement, particularly its application to different ethnic groups, it provides a pragmatic tool to assess changes in population EBW.284Aotearoa New Zealand has the third highest rate of obesity (BMI 30 or more) of all countries in the OECD.283 In 2023/24 one in three (34%) adults had a BMI of 30 or more, compared with 17% in 1997.227,285
In 2023/24, two thirds (67%) of adults were considered to have EBW (BMI of 25 or more), with it being more common among Pacific peoples (89%) and Māori (77%) (Figure 45). EBW was more common in those living in the most socioeconomically deprived neighbourhoods (where 76% had a BMI of 25 or more) compared with the least deprived (60%).227
While there was only a small increase in the proportion of the population with BMI of 25 or more between 2013/14 and 2023/24 (65% to 67%), the proportion of the population with BMI of 30 or more increased significantly from 29% to 34%.227
Figure 45. Population with BMI 25 or over by total response ethnicity, 2006/07 and 2011/12 to 2023/24

Source: New Zealand Health Survey
Note data not collected in 2021/22
Health risk factor: alcohol
Alcohol consumption can affect all aspects of wellbeing.628, 629 In the short-term alcohol intake increases the risk of accidents and injuries (including road traffic accidents), affects decision-making and can lead to aggressive or violent behaviour.628 Long-term health impacts include addiction, increased risk of cancers and stroke, and foetal alcohol spectrum disorder.628 This alcohol-related harm is experienced inequitably amongst population groups.629 Alongside the extensive impacts on whānau, alcohol-related harm has high societal economic costs, estimated to be $9.1 billion annually.630
Consumption of alcohol is a common reason for people attending Emergency Departments. A snapshot survey of 19 Emergency Departments at 2am on a Saturday in 2019 found that one in six patients were receiving treatment for alcohol-related issues.631 Alcohol-related presentations to the Christchurch Emergency Department increased from 5.5% in 2013 to 11% in 2022.632 There was also a change in the age profile, with an increased proportion of older people presenting with alcohol-related issues and a decrease in youth aged 25 years and under.632
Survey data indicate a slight downward trend in reported alcohol consumption in recent years. More people do not drink alcohol at all and the proportion who drink heavily has fallen. In 2023/24, 81% men and 71% women had an alcoholic drink in the previous year, a reduction from 85% and 75% in 2011/12.227 The proportion of people aged 15 years and older who report drinking heavily (defined as drinking 6 or more standard drinks on one occasion at least weekly) decreased between 2016/17 and 2023/24.227 This decrease was seen for men and women, and across most age groups, particularly for younger adults.
Heavy drinking rates have also decreased across all ethnic groups. Figure 46 shows that the proportion of adults who report drinking 6 or more standard drinks on one occasion at least weekly decreased for all ethnic groups between 2016/17 and 2023/24. There was a small decrease in the absolute difference between Māori and nMnPnA heavy drinking rates during this time from 5 percentage points to 3.7 percentage points. Heavy drinking rates are higher in men than women for all ethnic groups. For example, 13.6% of nMnPnA men and 4.8% of nMnPnA women drank 6 or more standard drinks at least weekly in 2023/24.227
The volume of pure alcohol in alcoholic beverages available for consumption (both imported alcoholic drinks and alcohol produced in Aotearoa New Zealand for local consumption) has decreased slightly since 2010.633 Alcohol available for consumption per person aged 18 and over decreased from 2.2 standard drinks a day in 2010 to 1.77 standard drinks a day in 2024.633 Measures of the volume of different types of alcoholic drinks available for consumption indicate a decrease in beer and wine consumption since 2006, and an increase in consumption of spirit-based drinks (RTDs), that peaked in 2022.633,634
Figure 46. People who drank 6 or more alcoholic drinks on one occasion at least weekly by total response ethnicity, 2016/17-2023/24
Use arrow keys to navigate the key indicator items.
- Download
- Download dataset
- Source
New Zealand Health Survey
Access to primary health care
Access to high quality primary health care is an important determinant of health, which can also mitigate the impact of inequities in other determinants of health. A selection of indicators have been chosen, reflecting measures of access to and engagement with primary health care.
Ambulatory sensitive hospitalisations for people aged 45 to 64 years
Ambulatory sensitive hospitalisations (ASH) are acute hospital admissions for illnesses or conditions that could have been avoided by interventions in primary care or the community, such as vaccination, or timely and effective management of conditions such as asthma in children or heart disease in adults.
From 2001 to 2024 there was a significant 10.9% increase in the total population ASH rate for people aged 45 to 64 years (from 3337 per 100,000 to 3704 per 100,000 people). This total population rate conceals large inequities between groups. Rates for Māori and Pacific peoples were 2 to 3 times higher than for nMnPnA people in each year from 2001 to 2024 (Figure 47). ASH rates were lowest for Asian people, with rates falling between 2001 and 2024.
The relative and absolute inequities in ASH rates for Pacific peoples compared with nMnPnA people increased between 2001 and 2024, and were highest between 2007 and 2019. ASH rates for Pacific peoples increased to a peak in 2011 (8664 per 100,000), declined slowly until 2019 and then fell sharply in 2020-2022. However, they rebounded back to 2019 levels in 2023.
There was a decrease in total population ASH rates between 2020 and 2022, with bigger and more prolonged reductions for Māori and Pacific peoples than for other ethnic groups. During this time, public health measures related to COVID-19 varied in stringency and geographic location. Changes in social connection and behaviours, lower levels of circulating bacteria and viruses, and reductions in access to primary and secondary health services are likely to have contributed to the differing ASH rates experienced by different ethnic groups during this time.70,635,636
Figure 47. Ambulatory sensitive hospitalisation rate for people aged 45-64 years (WHO age-standardised) by prioritised ethnicity, 2001-2024
Use arrow keys to navigate the key indicator items.
- Download
- Download dataset
- Source
National Minimum Dataset – Hospital Events.
Potentially avoidable hospitalisations in children
Potentially avoidable hospitalisations (PAH) are a broader group of conditions than ASH. PAHs include hospitalisations due to illnesses and injuries that could potentially be prevented by:
- effective primary healthcare services
- public health interventions such as injury prevention (e.g. child car seats) and health promotion and/or
- social policy interventions, such as income support and housing policy.637
PAH are one of the Child Poverty Related Indicators identified under the Child Poverty Act 2018 and are reported annually.638
Figure 48 is based on an analysis of PAH by the New Zealand Child and Youth Epidemiology Service, covering the years 2000 to 2020.278 Figure 49 shows a similar analysis by the Ministry of Health for the years ending June 2020 to June 2024. PAH rates were relatively stable for children aged 0 to 14 years from 2001 to 2019 (Figure 48) but with significant differences between ethnic groups.
PAH rates for Pacific peoples’ children were persistently high at about double the rate for non-Māori/non-Pacific/non-Asian/non-MELAA children. Rates for Asian children were lowest but showed the biggest proportionate increase between 2000 and 2019, increasing by 74%.
Figure 48. Potentially avoidable hospitalisations in children aged 0-14 years by prioritised ethnicity 2000-2020
Use arrow keys to navigate the key indicator items.
- Download
- Download dataset
- Source
New Zealand Child and Youth Epidemiology Service. From Adams et al. 2022. Page 17, Figure 3.6278
As seen with ASH in adults (Figure 47), PAH rates for children in all ethnic groups dropped in 2020. This was likely due to public health measures instituted during the COVID-19 response, with decreased transmission of infectious diseases associated with closed borders, decreased community interactions and school closures. PAH rates for children remained low for all ethnicities for 2020/21 and 2021/22 before rising again in 2022/23 (Figure 49). The increase in PAH rate in 2022/23 was particularly marked for Pacific peoples’ children, with an increase in both the relative and absolute inequities between Pacific peoples and nMnPnA children between 2020/21 and 2023/24.
Figure 49. Potentially avoidable hospitalisations in children aged 0-14 years by prioritised ethnicity, year ended June 2020-June 2024
Use arrow keys to navigate the key indicator items.
- Download
- Download dataset
- Source
National Minimum Dataset
PAH rates differ by socioeconomic status, with those living in more socioeconomically deprived areas having higher rates of PAH. Between 2000 and 2015, children living in the most socioeconomically deprived areas (quintile 5) had much higher PAH rates than other children.
From 2015 to 2019, PAH rates fell for children living in quintile 5, while they increased for those living in quintile 4. From 2019 to 2023/24, the PAH rates for children living in quintiles 4 and 5 have been very similar, and considerably higher than those of children living in less socioeconomically deprived areas (quintiles 1 to 3).278,639
Unmet need for General Practice care due to cost
In Aotearoa New Zealand, cost can be a significant barrier to accessing primary health care. GP visits are free for children under 14 years of age, but for everyone else, there is usually a fee, which varies between practices and around the country. In 2023/24 the New Zealand Health Survey reported that 15.5% of the population 15 years and over said that in the previous 12 months they did not see a GP due to cost, despite having a medical problem.227 This is the highest rate since 2011/12.
The proportion of the population who do not see a GP due to cost varies by age (Figure 50), disability (Figure 51), gender and ethnicity. In 2024 there were particularly high rates of unmet need for a GP due to cost for women (19%), adults aged 25 to 34 years (25%), disabled people (22%), Pacific peoples (22%) and Māori (20%).227
Figure 50. Unmet need for a GP in the past 12 months due to cost by age group, 2011/12-2023/24
Use arrow keys to navigate the key indicator items.
- Download
- Download dataset
- Source
New Zealand Health Survey
Figure 51. Unmet need for a GP in the past 12 months due to cost for adults 15 years and older by disability, 2018/19-2023/24
Use arrow keys to navigate the key indicator items.
- Download
- Download dataset
- Source
New Zealand Health Survey
Rates of unmet need for a GP due to cost are much lower for children than adults. In 1996 GP consultations for children under 6 years of age became free, with afterhours visits included from 2011. In July 2015, this was expanded to children under 13 years and then to children under 14 years in 2018.640
Figure 52 shows low rates of unmet need for a GP due to cost for children aged 0 to 4 years, and reductions for older children in the years following the policy changes. The policy improved absolute inequities for Māori and Pacific children, for whom rates of unmet need due to cost fell from 7.7% and 6.5% in 2011/12 to 1.9% and 1.5% in 2023/24 respectively, while there was a smaller decrease for Asian and nMnPnA children.227
Figure 52. Unmet need for GP in the past 12 months due to cost for children aged 0 to 14 years by age group, 2011/12-2023/24
Use arrow keys to navigate the key indicator items.
- Download
- Download dataset
- Source
New Zealand Health Survey
Access to timely care in pregnancy
Early registration and care provided by a Lead Maternity Carer (LMC – usually a midwife, sometimes an obstetrician) in pregnancy allows for access to timely care and support during this critical period. Pregnancy outcomes are poorer for Māori and Pacific peoples than for New Zealand Europeans.279 Mothers and babies who receive care late in pregnancy or after delivery are more likely to experience poorer outcomes.641,642
In the last 9 years there has been an increase in women accessing care late in pregnancy (Figure 53) or only after birth (postnatally) (Figure 54). Between 2016 and 2023, the proportion of Māori and non-Māori/non-Pacific (nMnP) enrolling with an LMC late in pregnancy doubled, to 11.6% and 4.7% respectively. The proportion of Pacific peoples enrolling late in pregnancy increased to over 10% in 2023.
There were substantial increases in enrolment with an LMC after giving birth for all ethnic groups. In 2023 this rate was 5 times higher than it had been in 2016 for Māori and Pacific and 10 times higher for nMnP. In 2023, 1 in 10 Pacific peoples, 1 in 20 Māori and 1 in 33 nMnP people enrolled with an LMC after giving birth. This implies they did not receive LMC care during pregnancy.
A 2019 review identified six integrated factors that were considered barriers to equitable maternal health outcomes and experiences in Aotearoa New Zealand – physical access, political context, the maternity care system, acceptability, colonialism, and cultural factors.643 The causes for the increase in late access to pregnancy care over the last decade need to be addressed.
The Perinatal and Maternal Mortality Review Committee note that since they started reviewing data in 2007, Māori and Pacific mothers and babies have had poorer outcomes than New Zealand Europeans.279 The proportion of people receiving care late in pregnancy or after birth has increased for all ethnicities, but with rates higher for Māori and Pacific peoples, this is likely to exacerbate inequities (note higher infant mortality rate for Pacific peoples (Figure 24, Section 3)). It is critical that systemic biases are addressed and barriers to accessing care early in pregnancy are removed.279
Figure 53. Registration with a Lead Maternity Carer in the third trimester by prioritised ethnicity 2016, 2019 and 2023
Use arrow keys to navigate the key indicator items.
- Download
- Download dataset
- Source
National Maternity Collection
Figure 54. Registration with a Lead Maternity Carer after giving birth, by prioritised ethnicity 2016, 2019 and 2023
Use arrow keys to navigate the key indicator items.
- Download
- Download dataset
- Source
National Maternity Collection
Childhood immunisation
Infants and young children can become very unwell and even die from conditions such as whooping cough, meningitis and measles, but these diseases can be prevented by immunisation. High coverage and timely immunisation protect not only the health of a child but also protect the whole community. High coverage prevents infections spreading and therefore protects vulnerable members of the population, such as the very young, the very old, or those with underlying conditions that increase their risk from infectious diseases (i.e. people who are immunocompromised).
Whānau need timely access to health care workers whom they trust and who can provide immunisations.644 Figure 55 shows that coverage rates for infants fully immunised at 6 months (according to the National Immunisation Schedule) were lower in the year to December 2024 than they had been in any year since 2009.645,646 Rates started falling in 2016, with a sharper decline in 2020. In the year to December 2024, 46.4% of Māori and 56.2% of Pacific peoples’ children had their first three series of immunisations on time (by 6 months).646
Figure 55. Infants who were fully immunised at 6 months^ by prioritised ethnicity, 2009 to 2024
Use arrow keys to navigate the key indicator items.
- Download
- Download dataset
- Source
Health New Zealand | Te Whatu Ora
Between 2013 and 2017 immunisation coverage for children aged 2 years was over 90% for all ethnic groups. From 2016, a gradual decline in coverage occurred, followed by a sharp decrease from 2020, with an ongoing decrease since then (Figure 56). In the year to December 2024, coverage for 2-year olds was 63.6% for Māori, 70.4% for Pacific peoples, 83.4% for Asian and 82.1% for European children.646
Figure 56. Children who were fully immunised at 24 months^ by prioritised ethnicity, 2009 to 2024
Use arrow keys to navigate the key indicator items.
- Download
- Download dataset
- Source
Health New Zealand | Te Whatu Ora
References
- Smith L, Lamb-Yorski R, Marama M, Asiasiga L, Pivac-Solomon J, Brown T, Grootveld C, Lees K. Implementation and emerging outcomes evaluation of the Place-Based Initiatives: Litmus Ltd, 2019.
- Teng A, Stanley J, Krebs J, Jackson C, Koea J, Gurney J. et al. Projected increases in the prevalence of diabetes mellitus in Aotearoa New Zealand, 2020–2044. NZMJ 2025; 138:1608 94-106.
- Health New Zealand Te Whatu Ora. Improving Primary Care. 4 March 2025. URL: https://www.tewhatuora.govt.nz/health-services-and-programmes/primary-care/improving-primary-care (accessed May 19 2025).
- Office of the Controller and Auditor-General Tumuaki o Te Mana Arotake. Meeting the Mental Health Needs of Young New Zealanders. Wellington: Office of the Controller and Auditor-General Tumuaki o Te Mana Arotake; 2024.
- Wilkinson R, Marmot M. Social determinants of health: the solid facts. Regional Office for Europe. World Health Organization. Regional Office for Europe; 1998.
- Commission on Social Determinants of Health. Closing the gap in a generation: Health equity through action on the social determinants of health. Final Report of the Commission on Social Determinants of Health. Geneva, 2008.
- World Health Organization. World Report on Social Determinants of Health Equity. Geneva, 2025.
- National Advisory Committee on Health and Disability (National Health Committee). The Social, Cultural and Economic Determinants of Health in New Zealand: Action to Improve Health. Wellington, 1998.
- Stats NZ Tatauranga Aotearoa. Population estimates and projections: National population projections: 2024(base)–2078. 2025. https://www.stats.govt.nz/information-releases/national-population-projections-2024base2078/ (accessed 5 June 2025).
- Wu Z, Wong S, Scragg R. Asian Health in Aotearoa: Findings from the New Zealand Health Survey 2002–2021. Auckland, 2024.
- Sorenson C, Drummond M, Bhuiyan Khan B. Medical technology as a key driver of rising health expenditure: disentangling the relationship. Clinicoecon Outcomes Res 2013; 5: 223-34.
- Diabetes tech demand surges, health system struggles to keep up. New Zealand Herald. 2025 16 January 2025.
- Ministry of Health Manatū Hauora. Tatau Kahukura Māori Health Chart Book 2024 online version. 2024. https://www.health.govt.nz/publications/tatau-kahukura-maori-health-chart-book-2024-online-version#nga-mana-hauora-tutohu-health-status-indicators (accessed April 3 2025).
- Health Quality & Safety Commission. Bula Sautu – A window on quality 2021: Pacific health in the year of COVID-19. Wellington: Health Quality & Safety Commission, 2021.
- Health New Zealand Te Whatu Ora. Life Expectancy in Aotearoa New Zealand: An Analysis of Socioeconomic, Geographic, Sex and Ethnic Variation from 2001 to 2022. Wellington, 2024.
- United Nations Environment Programme & International Science Council. Navigating new horizons: a global foresight report on planetary health and human wellbeing. Internet: United Nations Environment Programme, 2024.
- Ministry for the Environment & Stats NZ. New Zealand’s Environmental Reporting Series: Our environment 2025 | Tō tātou taiao. Wellington; 2025.
- Henderson P. Gone for Good: AI and the future of work. Auckland: Maxim Institute, 2025.
- Henderson P, Cole J, Baulis N. How AI is changing democracy: Nudging, Microtargeting and epistemic bubbles. Auckland: Maxim Institute, 2023.
- Hawkesby C. Resilience as a pathway to prosperity. 5 September 2024 2024. https://www.rbnz.govt.nz/hub/publications/speech/2024/resilience-as-a-pathway-to-prosperity (accessed May 5 2025).
- PwC. Building prosperity A pathway to wellbeing for all of Aotearoa: PricewaterhouseCoopers New Zealand, 2022.
- The Treasury Te Tai Ōhanga. Te Tai Waiora: Wellbeing in Aotearoa New Zealand 2022. Wellington, 2022.
- Reid P, Paine S, Te Ao B, et al. Estimating the economic costs of Indigenous health inequities in New Zealand: a retrospective cohort analysis. BMJ Open 2022; 12:e065430.
- Orange C. The Story of a Treaty | He Kōrero Tiriti. Wellington: BWB Bridget Williams Books; 2023.
- Donkin A, Goldblatt P, Allen J, et al. Global action on the social determinants of health. BMJ Glob Health 2017; 3:e000603.
- Wilkinson C, Low F, Gluckman P. Beyond genes: How fathers play a biological role in the health of future generations, 2022.
- Loppie C, Wien F. Understanding Indigenous health inequalities through a social determinants model: National Collaborating Centre for Indigenous Health, 2022.
- Cram F, Te Huia B, Te Huia T, Matutina-Williams M, Williams N. Oranga and Māori Health Inequities 1769-1992: Katoa Ltd, 2019.
- Condo Riveros S, McGlade H, Roth G. Indigenous determinants of health in the 2030 Agenda for Sustainable Development: United Nations Economic and Social Council, 2023.
- Lewis T, Buck D, Wenzel L. Equity and endurance: how can we tackle health inequalities this time? 16 March 2022 2022. https://www.kingsfund.org.uk/insight-and-analysis/long-reads/how-can-we-tackle-health-inequalities (accessed 23 May 2025 2025).
- Public Health England & UCL Institute of Health Equity. Local action on health inequalities: Understanding the economics of investments in the social determinants of health. London UK, 2014.
- World Health Organization. Health Equity. 2025. https://www.who.int/health-topics/health-equity#tab=tab_1 (accessed 20 May 2025 2025).
- Ministry of Health Manatū Hauora. Pae Ora Health Strategies: Summary of feedback from engagement. Provisional Health of Disabled People Strategy. Wellington, 2023.
- Te Kāhui Tika Tangata Human Rights Commission. Tika ki te Whai Oranga Right to Health. 2025. https://tikatangata.org.nz/human-rights-in-aotearoa/right-to-health (accessed 30 March 2025).
- Office of the United Nations High Commissioner for Human Rights & World Health Organization. The Right To Health. Geneva: Office of the United Nations High Commissioner for Human Rights; 2008.
- Ministry of Health Manatū Hauora. Achieving Equity in Health Outcomes: Highlights of important national and international papers. Wellington, 2018.
- Fredman S. Substantive equality revisited. International Journal of Constitutional Law 2016; 14(3): 712-38.
- Ministry of Health Manatū Hauora. Achieving Equity in Health Outcomes: Summary of a discovery process. ISBN 978-1-98-859706-5 (online) ed. Wellington: Ministry of Health Manatū Hauora; 2019.
- Ministry of Health Manatū Hauora. Te Tiriti o Waitangi framework. 6 May 2024. https://www.health.govt.nz/maori-health/te-tiriti-o-waitangi-framework (accessed May 22 2025).
- Public Health Advisory Committee. Position statement on Equity, Te Tiriti o Waitangi, and Māori Health. 2023. https://www.health.govt.nz/about-us/new-zealands-health-system/health-system-roles-and-organisations/health-committees-and-boards/public-health-advisory-committee/about-us#toc-0-3 (accessed May 1 2025).
- Waitangi Tribunal. Hauora: Report on Stage One of the Health Services and Outcomes Kaupapa Inquiry. Wellington, 2023.
- New Zealand Government. Pae Ora (Healthy Futures) Act 2022. Version as at 25 October 2024. Wellington: Parliamentary Counsel Office | Te Tari Tohurohu Pāremata; 2022.
- Curtis E, Jones R, Willing E, et al. Indigenous adaptation of a model for understanding the determinants of ethnic health inequities. Discover Social Science and Health 2023; 3(1): 10.
- Tulchinsky T, Varavikova E. A History of Public Health. The New Public Health 2014: 10.
- UK Parliament. The 1848 Public Health Act. https://www.parliament.uk/about/living-heritage/transformingsociety/towncountry/towns/tyne-and-wear-case-study/about-the-group/public-administration/the-1848-public-health-act/ (accessed May 23 2025).
- Miller C. The shared history of public health and planning in New Zealand: A different colonial experience. Progress in Planning 2016; 106: 1-21.
- Ministry of Health Manatū Hauora. Chronology of the New Zealand Health System 1840 to 2017. 2017. https://www.health.govt.nz/system/files/2024-05/chronology-of-the-new-zealand-health-system-1840-to-2017_0.pdf (accessed June 13 2025).
- Carpinter P. Summary - History of the Welfare State in New Zealand: Treasury, 2012.
- Kia Piki Ake Welfare Expert Advisory Group. History of the New Zealand Welfare System. 2022. https://www.weag.govt.nz/background/history-welfare-system/ (accessed June 4 2025).
- Public Health Advisory Committee. The health of people and communities: the effect of environmental factors on the health of New Zealanders Wellington, 2002.
- The Public Health Advisory Committee (sub-committee of the National Health Committee). The Health of People and Communities A Way Forward: Public policy and the economic determinants of health. Wellington, 2004.
- Ministry of Health Manatū Hauora. Reducing Inequalities in Health. Wellington: Ministry of Health | Manatū Hauora; 2002.
- Stats NZ Tatauranga Aotearoa. 2023 Census population counts (by ethnic group, age, and Māori descent) and dwelling counts. 29 May 2024. https://www.stats.govt.nz/information-releases/2023-census-population-counts-by-ethnic-group-age-and-maori-descent-and-dwelling-counts/ (accessed March 30 2025).
- Auckland Council Kaunihera o Tāmaki Makaurau. Tāmaki Makaurau Moananui-ā-Kiwa Pacific Auckland Who are Pacific people? 2025. https://www.aucklandcouncil.govt.nz/plans-projects-policies-reports-bylaws/our-plans-strategies/auckland-plan/about-the-auckland-plan/Pages/pacific-auckland.aspx (accessed April 2 2025).
- Roy Morgan Research. State of the Nation New Zealand Report 4 - March 2012, 2012.
- Smellie P. How our world has changed since 2000. 2011. https://www.stuff.co.nz/national/4506537/How-our-world-has-changed-since-2000 (accessed May 4 2025).
- Te Kāhui Tika Tangata Human Rights Commission. Revealing poll shows people see te Tiriti o Waitangi as partnership. 2023. https://tikatangata.org.nz/news/revealing-poll-shows-people-see-te-tiriti-o-waitangi-as-partnership (accessed May 22 2025).
- Te Tari Whakatau The Office of Treaty Settlements and Takutai Moana. Te Tira Kurapounamu – Treaty Settlements. 2024. https://whakatau.govt.nz/ (accessed May 15 2025).
- Schulze H, Reid A, Dixon H, McIndoe C, Wiradika S. Te Ōhanga The Māori Economy 2023. Wellington, 2025.
- Schulze H, Reid A, Dixon H, McIndoe C, Wiradika S. Aotearoa New Zealand The Value of Māori Tourism, 2025.
- Ministry of Education Te Tāhuhu o Te Mātauranga. Education Counts - Educational Attainment in the Population. July 2024 2024. https://www.educationcounts.govt.nz/statistics/achievement-and-attainment (accessed May 14 2025).
- Inland Revenue Policy and Regulatory Stewardship. High-wealth individuals research project. Wellingon, 2023.
- Navarro V. Neoliberalism, “Globalization,” Unemployment, Inequalities, and the Welfare State. International Journal of Health Services 1998; 28(4): 607-82.
- Ministry of Business Innovation and Employment Hīkina Whakatutuki. Housing Affordability in New Zealand: Results. Wellington, 2017.
- Crampton P. The persistent relationships between ethnicity and socioeconomic deprivation in Aotearoa (NZDep) 1991 and 2023. Personal communication; 2025.
- Reid P, Robson B, Jones CP. Disparities in health: common myths and uncommon truths. Pac Health Dialog 2000; 7(1): 38-47.
- Environmental Health Intelligence New Zealand Massey University. Socioeconomic deprivation profile. 2024. https://www.ehinz.ac.nz/indicators/population-vulnerability/socioeconomic-deprivation-profile/ (accessed May 30 2025).
- Chambers T, Douwes J, Mannetje A, et al. Nitrate in drinking water and cancer risk: the biological mechanism, epidemiological evidence and future research. Australian and New Zealand Journal of Public Health 2022; 46(2): 105-8.
- Ministry for the Environment Manatū mō Te Taiao. Addressing risks associated with nitrates in drinking water. Wellington, 2023.
- Health New Zealand Te Whatu Ora. Health Status Report. 20 December 2024. URL: https://www.tewhatuora.govt.nz/publications/health-status-report (accessed February 26 2025).
- Mitchell EA, Thompson JM, Zuccollo J, et al. The combination of bed sharing and maternal smoking leads to a greatly increased risk of sudden unexpected death in infancy: the New Zealand SUDI Nationwide Case Control Study. N Z Med J 2017; 130(1456): 52-64.
- Rutter C, Walker S. Infant mortality inequities for Māori in New Zealand: a tale of three policies. International Journal for Equity in Health 2021; 20(1): 10.
- Tipene-Leach D, Abel S. Innovation to prevent sudden infant death: the wahakura as an Indigenous vision for a safe sleep environment. Aust J Prim Health 2019; 25(5): 406-9.
- Smokefree Aotearoa 2025. Smoking rates and figures. 2025. https://www.smokefree.org.nz/facts/law-policy-and-research/smoking-rates-and-figures (accessed May 4 2025).
- Health New Zealand Te Whatu Ora. Insights into Māori women smoking. 10 January 2024 2024. https://www.tewhatuora.govt.nz/health-services-and-programmes/vaping-and-smokeless-tobacco-products/insights-into-maori-women-smoking (accessed May 21 2025).
- Ministry of Health Manatū Hauora. Annual Update of Key Results 2023/24: New Zealand Health Survey. 2024. https://www.health.govt.nz/publications/annual-update-of-key-results-202324-new-zealand-health-survey (accessed 22 March 2025).
- UNICEF Innocenti – Global Office of Research and Foresight. Child Well-Being in an Unpredictable World. Florence, Italy, 2024.
- Beeston C, McCartney G, Ford J, et al. Health Inequalities Policy Review for the Scottish Ministerial Task Force on Health Inequalities. Edinburgh, 2014.
- Baker M, Kvalsvig A, Plank M, et al. Continued mitigation needed to minimise the high health burden from COVID-19 in Aotearoa New Zealand. N Z Med J 2023; 136(1583).
- World Health Organization. Role of social protection in reducing the burden of public health and social measures during the COVID-19 pandemic: evidence review, 2024.
- Hale T, Angrist N, Goldszmidt R, Kira B, et al. A global panel database of pandemic policies (Oxford COVID-19 Government Response Tracker). 2023. https://www.bsg.ox.ac.uk/research/covid-19-government-response-tracker (accessed April 5 2025).
- The Whānau Ora Primary Health Research Project. Te Piringa: Insights into ensuring effective whānau-centred, primary health care services and support. Wellington, 2020.
- Wehipeihana N, Were L, Akroyd S, Lanumata T. Formative evaluation of the Whānau Ora commissioning agency model An independent evaluation report. 2016. https://www.tpk.govt.nz/en/o-matou-mohiotanga/whanau-ora/formative-evaluation-of-the-whanau-ora-model (accessed May 1 2025).
- Independent Whānau Ora Review Panel. Whānau Ora Review Report - Tipu Mātoro ki te Ao. 2019. https://www.tpk.govt.nz/en/o-matou-mohiotanga/whanau-ora/whanau-ora-review-report-tipu-matoro-ki-te-ao (accessed April 10 2025).
- Curtis E, Loring B, Jones R, et al. Refining the definitions of cultural safety, cultural competency and Indigenous health: lessons from Aotearoa New Zealand. International Journal for Equity in Health 2025; 24(1): 130.
- Ministry of Health Manatū Hauora. Ao Mai te Rā: The Anti-Racism Kaupapa. 12 February 2024 2024. https://www.health.govt.nz/maori-health/ao-mai-te-ra-the-anti-racism-kaupapa (accessed April 5 2025).
- Enabling Good Lives. About Enabling Good Lives. 2025. https://www.enablinggoodlives.co.nz/about-egl/ (accessed 23 May 2025).
- Marmot M, Wilkinson R. Social Determinants of Health, 2nd Edition. Oxford: Oxford University Press; 2006.
- Toleikyte L, Salway, S. Local action on health inequalities. Understanding and reducing ethnic inequalities in health. London, 2018.
- Baker P, Friel S, Kay A, Baum F, Strazdins L, Mackean T. What Enables and Constrains the Inclusion of the Social Determinants of Health Inequities in Government Policy Agendas? A Narrative Review. Int J Health Policy Manag 2018; 7(2): 101-11.
- Lee J, Schram A, Riley E, et al. Addressing Health Equity Through Action on the Social Determinants of Health: A Global Review of Policy Outcome Evaluation Methods. Int J Health Policy Manag 2018; 7(7): 581-92.
- Mosquera I, González-Rábago Y, Bacigalupe A, Suhrcke M. The Impact of Fiscal Policies on the Socioeconomic Determinants of Health:A Structured Review. International Journal of Health Services 2017; 47(2): 189-206.
- World Health Organization. The economics of the social determinants of health and health inequalities: a resource book. Luxembourg: World Health Organization; 2013.
- Garzón-Orjuela N, Samacá-Samacá DF, Luque Angulo SC, Mendes Abdala CV, Reveiz L, Eslava-Schmalbach J. An overview of reviews on strategies to reduce health inequalities. International Journal for Equity in Health 2020; 19(1): 192.
- Thornton RL, Glover CM, Cené CW, Glik DC, Henderson JA, Williams DR. Evaluating Strategies For Reducing Health Disparities By Addressing The Social Determinants Of Health. Health Aff (Millwood) 2016; 35(8): 1416-23.
- Walsh D, McCartney G. Social Murder? Austerity and Life Expectancy in the UK. First ed. Bristol, UK. Policy Press; 2025.
- Thomson H, Thomas S, Sellstrom E, Petticrew M. Housing improvements for health and associated socio‐economic outcomes. Cochrane Database of Systematic Reviews 2013; (2).
- McGowan VJ, Buckner S, Mead R, et al. Examining the effectiveness of place-based interventions to improve public health and reduce health inequalities: an umbrella review. BMC Public Health 2021; 21(1): 1888.
- Jindal M, Barnert E, Chomilo N, et al. Policy solutions to eliminate racial and ethnic child health disparities in the USA. The Lancet Child & Adolescent Health 2024; 8(2): 159-74.
- Morgan T, Anne K, Stella B, et al. How socially cohesive was New Zealand’s first lockdown period from the perspective of culturally diverse older New Zealanders? Kōtuitui: New Zealand Journal of Social Sciences Online 2022; 17(4): 518-37.
- Gordeev VS, Egan M. Social cohesion, neighbourhood resilience, and health: evidence from New Deal for Communities programme. The Lancet 2015; 386: S39.
- Mana Mokopuna Children & Young People's Commission. "You need to get in early, as soon as you see people struggling" Understanding the life-course journey Mokopuna voices to inform the Child and Youth Wellbeing Strategy Review 2024. Wellington, 2024.
- Schulz LC. The Dutch Hunger Winter and the developmental origins of health and disease. Proceedings of the National Academy of Sciences 2010; 107(39): 16757-8.
- Wallack L, Thornburg K. Developmental Origins, Epigenetics, and Equity: Moving Upstream. Maternal and Child Health Journal 2016; 20(5): 935-40.
- Goel N, Hernandez A, Cole SW. Social Genomic Determinants of Health: Understanding the Molecular Pathways by Which Neighborhood Disadvantage Affects Cancer Outcomes. Journal of Clinical Oncology 2024; 42(30): 3618-27.
- Mancilla VJ, Peeri NC, Silzer T, et al. Understanding the Interplay Between Health Disparities and Epigenomics. Front Genet 2020; 11: 903.
- Dunedin Multidisciplinary Health & Development Research Unit, University of Otago. The Dunedin Multidisciplinary Health and Development Study. 2025. https://dunedinstudy.otago.ac.nz/studies/assessment-phases (accessed May 3 2025).
- Growing Up in New Zealand. Welcome to Growing Up in New Zealand. 2024. https://www.growingup.co.nz/ (accessed 23 March 2025).
- Braveman P. Health Disparities and Health Equity: Concepts and Measurement. Annual Review of Public Health 2006; 27(Volume 27, 2006): 167-94.
- Morreau J, Low F. Early investment: A key to reversing intergenerational disadvantage and inequity in Aotearoa New Zealand, 2023.
- Jones CP. Levels of racism: a theoretic framework and a gardener's tale. Am J Public Health 2000; 90(8): 1212-5.
- Oranga Tamariki Ministry for Children. Colonisation context and impact. 7 August 2023. https://practice.orangatamariki.govt.nz/practice-approach/our-practice-approach/colonisation-context-and-impact (accessed May 20 2025).
- Devakumar D, Selvarajah S, Abubakar I, et al. Racism, xenophobia, discrimination, and the determination of health. The Lancet 2022; 400(10368): 2097-108.
- Selvarajah S, Corona Maioli S, Deivanayagam TA, et al. Racism, xenophobia, and discrimination: mapping pathways to health outcomes. The Lancet 2022; 400(10368): 2109-24.
- Reid P, Cormack D, Paine SJ. Colonial histories, racism and health—The experience of Māori and Indigenous peoples. Public Health 2019; 172: 119-24.
- Moewaka Barnes H, McCreanor T. Colonisation, hauora and whenua in Aotearoa. Journal of the Royal Society of New Zealand 2019; 49(sup1): 19-33.
- Mutu M. ‘To honour the treaty, we must first settle colonisation’ (Moana Jackson 2015): the long road from colonial devastation to balance, peace and harmony. Journal of the Royal Society of New Zealand 2019; 49(sup1): 4-18.
- Scobie M, Sturman, A. The Economic Possibilities of Decolonisation. Wellington: BWB Books; 2024.
- BERL. Inequality and New Zealand. December 15, 2020. https://berl.co.nz/our-mahi/inequality-and-new-zealand (accessed April 16 2025).
- Royal Society Te Apārangi. Spotlight on Housing. Wellington, 2021.
- Elkins C. Legacy of Violence A history of the British Empire. United States: Knopf Doubleday Publishing Group; 2022.
- Ngata T. Tina Ngata: Colonial racism and us. 2024. https://e-tangata.co.nz/comment-and-analysis/tina-ngata-colonial-racism-and-us/ (accessed June 21 2025).
- Cormack D, Stanley J, Harris R. Multiple forms of discrimination and relationships with health and wellbeing: findings from national cross-sectional surveys in Aotearoa/New Zealand. Int J Equity Health 2018; 17(1): 26.
- Salesa D. Island Time New Zealand's Pacific Futures. Wellington: BWB Books; 2017.
- Abuse in Care Royal Commission of Inquiry. Pacific survivors’ experiences of abuse and neglect in care Summary and key messages. 2025. https://www.abuseincare.org.nz/__data/assets/pdf_file/0022/22837/summary-pacific.pdf (accessed May 24 2025).
- Salesa D. An Indigenous Ocean: Pacific Essays. Wellington: Bridget Williams Books; 2023.
- Ministry of Health Manatū Hauora. Tupa Ola Moui: Pacific Health Chart Book 2025: Volume 1: Pacific Population in New Zealand. 2025. https://www.health.govt.nz/publications/tupu-ola-moui-volume-1-pacific-population-in-new-zealand (accessed June 1 2025).
- Integrity Professional (IPRO). The New Zealand Pacific Economy. Wellington, 2018.
- Ministry of Health Manatū Hauora. Te Mana Ola: The Pacific Health Strategy. 2023. https://www.health.govt.nz/strategies-initiatives/health-strategies/te-mana-ola-the-pacific-health-strategy (accessed May 23 2025).
- Te Kāhui Tika Tangata Human Rights Commission. Te Ōritenga me te Whakawāteatanga | Equality and Freedom from Discrimination. Undated. https://tikatangata.org.nz/human-rights-in-aotearoa/equality-and-freedom-from-discrimination (accessed April 26 2025).
- Smith C, Tinirau R, Rattray Te Mana H, et al. Whakatika: Māori experiences of racism. Whanganui, 2021.
- Gulliford M. Discrimination and public health. The Lancet Public Health 2019; 4(4): e173-e4.
- Mana Mokopuna Children & Young People's Commission. Ki te kore te kaikiri ki roto o Aotearoa, kātahi te wāhi pai rawa atu."Without racism Aotearoa would be better": Mokopuna share their experiences of racism and solutions to end it. 2024. https://www.manamokopuna.org.nz/publications/reports/without-racism-aotearoa-would-be-better-mokopuna-share-their-experiences-of-racism-and-solutions-to-end-it/ (accessed May 2 2025).
- Williams DR, Lawrence JA, Davis BA, Vu C. Understanding how discrimination can affect health. Health Serv Res 2019; 54 Suppl 2(Suppl 2): 1374-88.
- Ahuriri-Driscoll A, Williams M, Vakalalabure-Wragg U, Black E, et al. Evolution of Racism and Anti-Racism Lessons for the Aotearoa New Zealand Health System Stage One Literature Review. Wellington, 2022.
- Gracey M, King M. Indigenous health part 1: determinants and disease patterns. The Lancet 2009; 374(9683): 65-75.
- Harris R, Cormack D, Tobias M, et al. The pervasive effects of racism: experiences of racial discrimination in New Zealand over time and associations with multiple health domains. Soc Sci Med 2012; 74(3): 408-15.
- Harris R, Li C, Stanley J, et al. Racism and Health Among Aotearoa New Zealand Young People Aged 15–24 years: Analysis of Multiple National Surveys. Journal of Adolescent Health 2024; 75(3): 416-25.
- Crengle S, Robinson E, Ameratunga S, Clark T, Raphael D. Ethnic discrimination prevalence and associations with health outcomes: data from a nationally representative cross-sectional survey of secondary school students in New Zealand. BMC Public Health 2012; 12(1): 45.
- Ministry of Health Manatū Hauora. Te Mana Ola Engagement Report: What we heard from Pacific peoples. Wellington, 2023.
- Stopforth S, Kapadia D, Nazroo J, Bécares L. The enduring effects of racism on health: Understanding direct and indirect effects over time. SSM Popul Health 2022; 19: 101217.
- Stats NZ Tatauranga Aotearoa. Disability Statistics 2023. 31 March 2025. https://www.stats.govt.nz/information-releases/disability-statistics-2023/ (accessed June 9 2025).
- InsideOUT Kōaro. Rainbow Terminology. 2023. https://insideout.org.nz/wp-content/uploads/2024/08/InsideOUT-rainbow-terminology-2023.pdf (accessed April 12 2025).
- Stats NZ Tatauranga Aotearoa. Aotearoa Data Explorer. 2025. https://explore.data.stats.govt.nz/ (accessed June 4 2025).
- Office for Disability Issues. New Zealand Disability Strategy 2016–2026. 2016. https://www.disabilitysupport.govt.nz/disabled-people/resources-for-people-new-to-the-disability-community/new-zealand-disability-strategy-2016-2026 (accessed May 13 2025).
- Disability Support Services. Definitions, concepts and approaches A quick course on disability concepts and approaches. 24 October 2024. https://www.disabilitysupport.govt.nz/disabled-people/resources-for-people-new-to-the-disability-community/definitions-concepts-and-approaches (accessed May 1 2025).
- King P. Māori With Lived Experience of Disability Part I. Report commissioned by the Waitangi Tribunal for Stage Two of the Wai 2575 Health Services and Outcomes Kaupapa Inquiry.
- Jun H. Disablism/Ableism. In: Jun H, ed. Social Justice, Multicultural Counseling, and Practice: Beyond a Conventional Approach. Cham: Springer Nature Switzerland; 2024: 271-302.
- Iezzoni LI. Disability Disparities and Ableism in Medicine. In: Imtiaz-Umer S, Frain, J., ed. ABC of Equality, Diversity and Inclusion in Healthcare: Wiley Blackwell; 2023.
- I.Lead YES Disability Centre. Mental Health Report Card. 2024. https://www.ilead.org.nz/mental-health-report-card/ (accessed May 28 2025).
- United Nations Human Rights Office of the High Commissioner. Convention on the Rights of Persons with Disabilities (CRPD). 2006. https://social.desa.un.org/issues/disability/crpd/convention-on-the-rights-of-persons-with-disabilities-crpd (accessed May 1 2025).
- Jones B, King PT, Baker G, et al. Karanga rua, karanga maha: Māori with lived experience of disability self-determining their own identities. Kōtuitui: New Zealand Journal of Social Sciences Online 2024; 19(1): 45-64.
- Ministry for Women Manatū Wāhine. Our history. 2023. https://www.women.govt.nz/about-us/our-history (accessed May 3 2025).
- Ministry for Women Manatū Wāhine. Pay Equity and Equal Pay. 2023. https://www.women.govt.nz/women-and-work/pay-equity-and-equal-pay (accessed April 23 2025).
- National Council of Women of New Zealand. Aotearoa New Zealand Gender Attitudes Survey 2023. 2023. https://genderequal.nz/wp-content/uploads/2023/09/NCWNZ_Gender-Attitudes-23-Final-Report_29-08-23.pdf (accessed March 24 2025).
- Deloitte. Westpac New Zealand. Sharing the Load Report. 2021. https://assets.dam.westpac.co.nz/is/content/wnzl/dist/all-of-bank/sustainability/Sustainability_Sharing-the-Load_report.pdf (accessed May 3 2025).
- Stats NZ Tatauranga Aotearoa. Wellbeing outcomes worse for sole parents. 2020. https://www.stats.govt.nz/news/wellbeing-outcomes-worse-for-sole-parents/ (accessed May 4 2025).
- Morrissey S. What does retirement look like for women? Wellington, 2022.
- Domett T, Coker J, Meyer A, Jackson E. Mako Mama - Mangopare Single Parents Project Final Report. 2023. https://www.makomamamangopare.nz/ (accessed May 21 2025).
- Ministry for Women Manatū Wāhine. Women's Safety | He āhuru mōwai Data and research. 2023. https://www.women.govt.nz/womens-safety/data-and-research (accessed May 28 2025).
- Fanslow J, Malihi Z, Hashemi L, Gulliver P, McIntosh T. Prevalence of interpersonal violence against women and men in New Zealand: results of a cross-sectional study. Aust N Z J Public Health 2022; 46(2): 117-26.
- de Bres J, Morrison-Young i. To Be Ourselves: Trans and Non-Binary Disabled People in Aotearoa Research report, 2025.
- Stats NZ Tatauranga Aotearoa. 2023 Census shows 1 in 20 adults belong to Aotearoa New Zealand’s LGBTIQ+ population (corrected). 4 October 2024. https://www.stats.govt.nz/news/2023-census-shows-1-in-20-adults-belong-to-aotearoa-new-zealands-lgbtiq-population/ (accessed March 30 2025).
- Yee A, Bentham R, Byrne J, et al. Counting Ourselves Findings from the 2022 Aotearoa New Zealand Trans & Non-binary Health Survey. Hamilton, 2025.
- Bowleg L. The Problem With the Phrase Women and Minorities: Intersectionality—an Important Theoretical Framework for Public Health. American Journal of Public Health 2012; 102(7): 1267-73.
- Malihi Z, Fanslow J, Hashemi L, Gulliver P, McIntosh T. Prevalence of Nonpartner Physical and Sexual Violence Against People With Disabilities. Am J Prev Med 2021; 61(3): 329-37.
- Easton B. Not in Narrow Seas: The Economic History of Aotearoa New Zealand. Wellington: Te Herenga Waka University Press; 2020.
- Orange C. Te Tiriti o Waitangi | The Treaty of Waitangi An Illustrated History. Wellington: Bridget William Books 2021. Image taken from http://www.TeAra.govt.nz/en/map/36362/maori-land-loss-north-island (accessed June 7 2025).
- Barnett P, Bagshaw P. Neoliberalism: what it is, how it affects health and what to do about it. N Z Med J 2020; 133(1512): 76-84.
- Gilmore AB, Fabbri A, Baum F, et al. Defining and conceptualising the commercial determinants of health. The Lancet 2023; 401(10383): 1194-213.
- Blakely T, Ajwani S, Robson B, Tobias M, Bonné M. Decades of disparity: widening ethnic mortality gaps from 1980 to 1999. N Z Med J 2004; 117(1199): U995.
- Mills C. Health, employment and recession: the impact of the global crisis on health inequities in New Zealand. Policy Quarterly 2010; 6(4).
- Markham S, Özbilgin M, Robinson F. Labour Market Cycles Across Different Groups: What Does History Tell Us? Part I: Theory, Ethnicities. 2022. https://www.rbnz.govt.nz/hub/publications/analytical-note/2022/an2022-03 (accessed May 30 2025).
- Markham S, Özbilgin M, Robinson F. Labour market cycles across different groups: What does history tell us? Part III: Regions. 31 March 2022. https://www.rbnz.govt.nz/hub/publications/analytical-note/2022/an2022-05 (accessed June 5 2025).
- Ching B, Forward T, Parkyn O. Estimating the Distribution of Wealth in New Zealand. Wellington, 2023.
- Commerce Commission of New Zealand Te Komihana Tauhokohoko. Market Study into the Grocery Sector. 2022, updated 2024. https://comcom.govt.nz/about-us/our-role/competition-studies/market-study-into-retail-grocery-sector (accessed June 2 2025).
- New Zealand Infrastructure Commission Te Waihanga. The decline of housing supply in New Zealand: Why it happened and how to reverse it, 2022.
- Stats NZ Tatauranga Aotearoa. Wellbeing statistics: 2023 (updated). 25 September 2024, 2024. https://www.stats.govt.nz/information-releases/wellbeing-statistics-2023/#everyday-costs (accessed May 3 2025).
- Eaqub S, Collins R. Social Cohesion in New Zealand, 2025.
- Collins C, McCartney G, Garnham L. Neoliberalism and health inequalities. In: Smith KE, Bambra C, Hill SE, eds. Health Inequalities: Critical Perspectives. Oxford: Oxford University Press; 2015.
- Crawford R. Healthism and the medicalization of everyday life. International Journal of Health Services 1980; 10(3): 365-88.
- Johnson K. Healthism: When a focus on healthy living becomes problematic. 19 July 2024 2024. https://withinhealth.com/learn/articles/healthism-when-a-focus-on-healthy-living-becomes-problematic (accessed June 3 2025).
- Kawachi I, Berkman LF. Social Capital, Social Cohesion, and Health. In: Berkman LF, Kawachi I, Glymour MM, eds. Social Epidemiology: Oxford University Press; 2014: 0.
- Pérez E, Braën C, Boyer G, et al. Neighbourhood community life and health: A systematic review of reviews. Health Place 2020; 61: 102238.
- CDC. US Centers for Disease Control and Prevention. Epigenetics, Health, and Disease. January 31, 2025. https://www.cdc.gov/genomics-and-health/epigenetics/index.html (accessed May 1 2025).
- Monaghan P. The Flexible Phenotype: A Body-Centred Integration of Ecology, Physiology and Behaviour. The Auk 2012; 129(1): 180-1.
- Capps B, Chadwick R, Lederman Z, et al. The Human Genome Organisation (HUGO) and a vision for Ecogenomics: the Ecological Genome Project. Human Genomics 2023; 17(1): 115.
- Low FM, Gluckman PD, Hanson MA. Chapter 14 - Epigenetic and Developmental Basis of Risk of Obesity and Metabolic Disease. In: Ulloa-Aguirre A, Tao Y-X, eds. Cellular Endocrinology in Health and Disease (Second Edition). Boston: Academic Press; 2021: 289-313.
- Bucci M, Marques SS, Oh D, Harris NB. Toxic Stress in Children and Adolescents. Advances in Pediatrics 2016; 63(1): 403-28.
- Hashemi L, Fanslow J, Gulliver P, McIntosh T. Exploring the health burden of cumulative and specific adverse childhood experiences in New Zealand: Results from a population-based study. Child Abuse & Neglect 2021; 122: 105372.
- Low F, Gluckman P, Poulton R. Executive Functions: A crucial but overlooked factor for lifelong wellbeing. Auckland, 2021.
- Pearson A, Telfar Barnard L, Pearce J, Kingham S, Howden-Chapman P. Housing quality and resilience in New Zealand. Building Research & Information 2014; 42(2): 182-90.
- Waterman I, Marek L, Ahuriri-Driscoll A, Mohammed J, Epton M, Hobbs M. Investigating the spatial and temporal variation of vape retailer provision in New Zealand: A cross-sectional and nationwide study. Social Science & Medicine 2024; 349: 116848.
- Connor JL, Kypri K, Bell ML, Cousins K. Alcohol outlet density, levels of drinking and alcohol-related harm in New Zealand: a national study. Journal of Epidemiology and Community Health 2011; 65(10): 841-6.
- Wheeler BW, Rigby JE, Huriwai T. Pokies and poverty: problem gambling risk factor geography in New Zealand. Health & Place 2006; 12(1): 86-96.
- Vandevijvere S, Sushil Z, Exeter DJ, Swinburn B. Obesogenic Retail Food Environments Around New Zealand Schools: A National Study. American Journal of Preventive Medicine 2016; 51(3): e57-e66.
- Sushil Z, Vandevijvere S, Exeter DJ, Swinburn B. Food swamps by area socioeconomic deprivation in New Zealand: a national study. International Journal of Public Health 2017; 62(8): 869-77.
- Pearce J, Kingham S. Environmental inequalities in New Zealand: A national study of air pollution and environmental justice. Geoforum 2008; 39(2): 980-93.
- Zhang Y, Zhao J, Mavoa S, Smith M. Inequalities in urban green space distribution across priority population groups: Evidence from Tāmaki Makaurau Auckland, Aotearoa New Zealand. Cities 2024; 149: 104972.
- The Geospatial Research Institute Toi Hangarau. Healthy Location Index. 2024. https://geospatial.ac.nz/research/projects/health-location-index/ (accessed June 3 2025).
- Kennedy B, Kawachi I, Brainerd E. The role of social capital in the Russian mortality crisis. World Development 1998; 26(11): 2029-43.
- Brainerd E. Mortality in Russia Since the Fall of the Soviet Union. Comp Econ Stud 2021; 63(4): 557-76.
- de Haro Moro MT, Schofield L, Munoz-Arroyo R, McCartney G, Walsh D. A new era of inequality: profound changes to mortality in England, Scotland, and 10 major British cities. European Journal of Public Health 2025; 35(2): 235-41.
- Steel N, Bauer-Staeb CMM, Ford JA, et al. Changing life expectancy in European countries 1990-2021: a subanalysis of causes and risk factors from the Global Burden of Disease Study 2021. The Lancet Public Health 2025; 10(3): e172-e88.
- Ajwani S, Blakely T, Robson B, Tobias M, Bonne M. Decades of Disparity: Ethnic mortality trends in New Zealand 1980-1999. Welllington: Ministry of Health and University of Otago, 2003.
- Disney G, Teng A, Atkinson J, Wilson N, Blakely T. Changing ethnic inequalities in mortality in New Zealand over 30 years: linked cohort studies with 68.9 million person-years of follow-up. Population Health Metrics 2017; 15(1): 15.
- Stats NZ Tatauranga Aotearoa. Wellbeing Data for New Zealanders. 2025. https://statisticsnz.shinyapps.io/wellbeingindicators/ (accessed April 15 2025).
- The Treasury TeTai Ōhanga. Our Living Standards Framework. 12 April 2022 2022. https://www.treasury.govt.nz/information-and-services/nz-economy/higher-living-standards/our-living-standards-framework (accessed May 4 2025).
- World Health Organization. Operational framework for monitoring social determinants of health equity. 2024. https://www.who.int/publications/i/item/9789240088320 (accessed Feburary 26 2025).
- The Lancet Public Health. Income, health, and social welfare policies. The Lancet Public Health 2020; 5(3): e127.
- Marmot M, Bell R. Social inequalities in health: a proper concern of epidemiology. Annals of Epidemiology 2016; 26(4): 238-40.
- Monk J, Prickett K, Grimes A, Morrison S. The effect of income on New Zealand children's behaviour: The influence of maternal stress and children's screen use. Wellington, 2024.
- Ministry of Social Development Te Manatū Whakahiato Ora. Rapid Evidence Review: The impact of poverty on life course outcomes for children, and the likely effect of increasing the adequacy of welfare benefits. Wellington, 2018.
- Stats NZ Tatauranga Aotearoa. Labour market statistics (income): June 2024 quarter. 2024. https://www.stats.govt.nz/information-releases/labour-market-statistics-income-june-2024-quarter/ (accessed June 11 2025).
- Ministry for Women Manatū Wāhine. Report: Ethnicity and the Gender Pay Gap. 2024. https://www.women.govt.nz/gender-pay-gaps/new-zealands-gender-pay-gap/ethnicity/report-ethnicity-and-gender-pay-gap (accessed May 12 2025).
- Ministry for Women Manatū Wāhine. Disability. 2024. https://www.women.govt.nz/gender-pay-gaps/new-zealands-gender-pay-gap/disability (accessed June 11 2025).
- Stephens M. Trends in the household income distribution: 2007-2021. Wellington, 2023.
- Stats NZ Tatauranga Aotearoa. Household income and housing-cost statistics: Year ended June 2024. 2025. https://www.stats.govt.nz/information-releases/household-income-and-housing-cost-statistics-year-ended-june-2024/ (accessed June 19 2025).
- Ministry of Social Development Te Manatū Whakahiato Ora. Child Poverty in New Zealand. 2024. https://www.msd.govt.nz/about-msd-and-our-work/publications-resources/research/child-poverty-in-nz/index.html (accessed May 1 2025).
- McCartney G, Hearty W, Arnot J, Popham F, Cumbers A, McMaster R. Impact of Political Economy on Population Health: A Systematic Review of Reviews. Am J Public Health 2019; 109(6): e1-e12.
- Pickett KE, Wilkinson RG. Income inequality and health: A causal review. Social Science & Medicine 2015; 128: 316-26.
- Buttrick N, Heintzelman, S., Oishi, S. Inequality and well-being. Curr Opin Psychol 2017; 18: 15-20.
- Barone G, Mocetti S. Inequality and Trust: New Evidence from Panel Data. Economic Inquiry 2016; 54(2): 794-809.
- Perry B. Household incomes in New Zealand: Trends in indicators of inequality and hardship 1982 to 2018. Wellington, 2019.
- Rashbrooke ME. Inequality: A New Zealand crisis. Wellington, New Zealand: Bridget William Books; 2013.
- Stats NZ Tatauranga Aotearoa. Child poverty statistics: Year ended June 2024. 2025. https://www.stats.govt.nz/information-releases/child-poverty-statistics-year-ended-june-2024/ (accessed June 7 2025).
- Ministry of Health Manatū Hauora. Annual Data Explorer - New Zealand Health Survey [Internet]. 2024. https://minhealthnz.shinyapps.io/nz-health-survey-2023-24-annual-data-explorer/_w_798a4c28/#!/home (accessed May 29 2025).
- Frank J, Mustard C, Smith P, et al. Work as a social determinant of health in high-income countries: past, present, and future. The Lancet 2023; 402(10410): 1357-67.
- Gedikli C, Mariella M, Sara C, Mark B, and Watson D. The relationship between unemployment and wellbeing: an updated meta-analysis of longitudinal evidence. European Journal of Work and Organizational Psychology 2023; 32(1): 128-44.
- Stats NZ Tatauranga Aotearoa. Main activity of people not in the labour force. 2016. https://www.stats.govt.nz/reports/main-activity-of-people-not-in-the-labour-force/ (accessed June 6 2025).
- Stats NZ Tatauranga Aotearoa. Infoshare. 2025. https://infoshare.stats.govt.nz/infoshare/Default.aspx (accessed June 6 2025).
- Stats NZ Tatauranga Aotearoa. Underutilisation rate. May 7 2025 2025. https://www.stats.govt.nz/indicators/underutilisation-rate/ (accessed June 6 2025).
- Pacheco G, Morrison P, Cochrane B, Blumenfeld S, Rosenberg B. Understanding insecure work. Auckland, 2016.
- Stats NZ Tatauranga Aotearoa. Unemployment rate. May 7 2025 2025. https://www.stats.govt.nz/indicators/unemployment-rate/ (accessed June 7 2025).
- Whaikaha Ministry of Disabled People. Labour market statistics for disabled people - June 2024 quarter. 2024. https://www.whaikaha.govt.nz/news/news/labour-market-statistics-for-disabled-people-june-2024-quarter (accessed June 3 2025).
- Stats NZ Tatauranga Aotearoa. Introducing the youth not in employment, education, or training indicator. 1 December 2011. https://www.stats.govt.nz/methods/introducing-the-youth-not-in-employment-education-or-training-indicator/ (accessed June 12 2025).
- Tuatagaloa P, Wilson R. Youth not in employment, education or training (NEET) in Auckland. Auckland, 2018.
- The Lancet Public Health. Education: a neglected social determinant of health. The Lancet Public Health 2020; 5(7): e361.
- Office of the Controller and Auditor-General Tumuaki o Te Mana Arotake. Education for Māori. Part 3: Historical and current context for Māori education. Wellington, 2012.
- Tait J, Grant M, Meissel K, et al. Now We Are 12: School Engagement of the Growing Up in New Zealand cohort. Snapshot 5. Auckland, 2023.
- Te Ihuwaka Education Evaluation Centre. Missing Out: Why Aren’t Our Children Going to School? Wellington, 2022.
- Ministry of Education Te Tāhuhu o Te Mātauranga. Early learning participation. 2024. https://www.educationcounts.govt.nz/statistics/participation (accessed June 1 2025).
- Webber A. What is the relationship between attendance and attainment? 2020. https://www.educationcounts.govt.nz/publications/series/he-whakaaro (accessed May 2 2025).
- McGregor A, Webber, A. H. School attendance and student wellbeing. 2020. https://www.educationcounts.govt.nz/publications/schooling/he-whakaaro-school-attendance-and-student-wellbeing (accessed June 8 2025).
- Ministry of Education Te Tāhuhu o Te Mātauranga. Attendance. 2024. https://www.educationcounts.govt.nz/statistics/attendance (accessed June 10 2025).
- Ministry of Education Te Tāhuhu o Te Mātauranga. Schooling Equity Index. 2025. https://www.educationcounts.govt.nz/data-services/code-sets-and-classifications/the-equity-index (accessed June 11 2025).
- New Zealand Parliament Education and Workforce Committee. Inquiry into school attendance. Report of the Education and Workforce Committee. 2022. https://selectcommittees.parliament.nz/v/2/5e1472a2-cfbc-4e15-9f8d-9787cb26f357 (accessed June 11 2025).
- Ministry of Education Te Tāhuhu o Te Mātauranga. Education Counts. School leavers attainment. 2024. https://www.educationcounts.govt.nz/statistics/school-leavers (accessed June 10 2025).
- Ministry of Education Te Tāhuhu o Te Mātauranga. School leavers with NCEA Level 2 or above. August 2024. https://www.educationcounts.govt.nz/__data/assets/pdf_file/0018/208071/Indicator-NCEA-Level-2-or-above-2023-v2.pdf (accessed June 11 2025).
- Ministry of Education Te Tāhuhu o Te Mātauranga. Retention of students in senior secondary schools. August 2024. https://www.educationcounts.govt.nz/__data/assets/pdf_file/0004/208093/Indicator-Student-retention-2023-v2.pdf (accessed June 6 2025).
- Ministry of Education Te Tāhuhu o Te Mātauranga. Māori language in schooling. 2024. https://www.educationcounts.govt.nz/statistics/maori-language-in-schooling (accessed June 5 2025).
- Howden-Chapman P, Pierse N. Commentary on Housing, Health, and Well-Being in Aotearoa/New Zealand. Health Educ Behav 2020; 47(6): 802-4.
- Crawford G, Connor E, McCausland K, Reeves K, Blackford K. Public Health Interventions to Address Housing and Mental Health amongst Migrants from Culturally and Linguistically Diverse Backgrounds Living in High-Income Countries: A Scoping Review. Int J Environ Res Public Health 2022; 19(24).
- Fraser B, Chun S, Pehi T, et al. Post-housing first outcomes amongst a cohort of formerly homeless youth in Aotearoa New Zealand. Journal of the Royal Society of New Zealand 2023; 53(5): 656-72.
- Ombler J, Jiang T, Fraser B, et al. Five-year post-housing outcomes for a Housing First cohort in Aotearoa New Zealand. International Journal of Homelessness 2024; 4(2): 109-25.
- Telfar Barnard L, Howden-Chapman P, Pierse N. Renting Poorer Housing: Ecological Relationships Between Tenure, Dwelling Condition, and Income and Housing-Sensitive Hospitalizations in a Developed Country. Health Education & Behavior 2020; 47(6): 816-24.
- Baker M, McNicholas A, Garrett N, et al. Household crowding a major risk factor for epidemic meningococcal disease in Auckland children. Pediatr Infect Dis J 2000; 19(10): 983-90.
- Howden-Chapman P, Pierse N, Nicholls S, et al. Effects of improved home heating on asthma in community dwelling children: randomised controlled trial. BMJ 2008; 337: a1411.
- Howden-Chapman P, Julian C, Michael K, et al. He Kāinga Oranga: reflections on 25 years of measuring the improved health, wellbeing and sustainability of healthier housing. Journal of the Royal Society of New Zealand 2024; 54(3): 290-315.
- Ministry of Housing and Urban Development Te Tūāpapa Kura Kāinga. Change in Housing Affordability Indicators. 2025. https://www.hud.govt.nz/stats-and-insights/change-in-housing-affordability-indicators/affordability-indicators#tabset (accessed June 12 2025).
- Stats NZ Tatauranga Aotearoa. Housing in Aotearoa: 2020. 2020. https://www.stats.govt.nz/reports/housing-in-aotearoa-2020/ (accessed June 1 2025).
- Stats NZ Tatauranga Aotearoa. Home ownership increases and housing quality improves. November 2024. https://www.stats.govt.nz/news/home-ownership-increases-and-housing-quality-improves/ (accessed June 1 2025).
- Stats NZ Tatauranga Aotearoa. Household crowding index – 2023 Census. 2024. https://datainfoplus.stats.govt.nz/item/nz.govt.stats/0f29c8da-1285-4264-9b9e-4af68f5d033f/ (accessed June 13 2025).
- Stats NZ Tatauranga Aotearoa. More than 100,000 crowded households in New Zealand. Novermber 7, 2024 2024. https://www.stats.govt.nz/news/more-than-100000-crowded-households-in-new-zealand/ (accessed June 6 2025).
- Roth G. Improving the health and wellness of Indigenous Peoples globally: operationalization of Indigenous determinants of health: United Nations Economic and Social Council, 2024.
- Curtis E, Loring B, Harris R, et al. Māori Health Priorities: A report commissioned by the interim Māori Health Authority (iMHA) to inform development of the interim New Zealand Health Plan (iNZHP). Wellington, 2022.
- The Lancet. Loneliness as a health issue. The Lancet 2023; 402(10396): 79.
- Public Service Commission Te Kawa Mataaho. Rangahau Kiwis Count. 24 April 2025. https://www.publicservice.govt.nz/research-and-data/kiwis-count (accessed June 4 2025).
- Ministry of Health Manatū Hauora. Health National Adaptation Plan 2024 - 2027. 22 October 2024 2024. https://www.health.govt.nz/publications/health-national-adaptation-plan-2024-2027 (accessed April 27 2025).
- Ministry for the Environment & Stats NZ. Our atmosphere and climate 2023. Wellington, 2023.
- Intergovernmental Panel on Climate Change. Summary for Policymakers. In: Climate Change 2023: Synthesis Report. Contribution of Working Groups I, II and III to the Sixth Assessment Report of the Intergovernmental Panel on Climate Change. Geneva, 2023.
- Stats NZ Tatauranga Aotearoa. Annual glacier ice volumes: Data to 2023. April 11, 2025. https://www.stats.govt.nz/indicators/annual-glacier-ice-volumes-data-to-2023/ (accessed June 5 2025).
- Ministry for the Environment Manatū mo Te Taiao. New Zealand’s Greenhouse Gas Inventory 1990–2023. Wellington, 2025.
- Environmental Health Intelligence New Zealand Massey University. Number of motor vehicles [Surveillance Report]. Wellington, 2024.
- Environmental Health Intelligence New Zealand Massey University. Average age of motor vehicles [Surveillance Report]. Wellington, 2024.
- Beltran-Castillon L, McLeod K. From Data to Dignity: Health and Wellbeing Indicators for New Zealanders with Intellectual Disability | Mai i te Raraunga ki te Rangatiratanga o te Noho: Ngā Tūtohu Hauora, Toiora Hoki mō te Hunga Whai Kaha o Aotearoa. Wellington, 2023.
- Health New Zealand | Te Whatu Ora. 2025. Aotearoa New Zealand International Comparison Report: Health Status and Health System Performance. Wellington: Health New Zealand | Te Whatu Ora.
- Adams J, Duncanson M, Oben G, et al. Indicators of child and youth health status in Aotearoa 2021. Dunedin, 2022.
- Perinatal and Maternal Mortality Review Committee. Sixteenth Annual Report of the Perinatal and Maternal Mortality Review Committee | Te Pūrongo ā-Tau Tekau mā Ono o te Komiti Arotake Mate Pēpi, Mate Whaea Hoki: Reporting Mortality and Morbidity 2021 | Te Tuku Pūrongo mō te Mate me te Whakamate 2021. Wellington: Perinatal and Maternal Mortality Review Committee, 2024.
- Office of the Surgeon General Office on Smoking Health. Reports of the Surgeon General. The Health Consequences of Smoking: A Report of the Surgeon General. Atlanta (GA): Centers for Disease Control and Prevention (US); 2004.
- Health New Zealand Te Whatu Ora. Virtual Diabetes Register and web tool. [Internet]. 2024. https://www.tewhatuora.govt.nz/for-health-professionals/data-and-statistics/diabetes/virtual-diabetes-register-web-tool (accessed May 29 2025).
- International Diabetes Federation. Facts and Figures 2025. https://idf.org/about-diabetes/diabetes-facts-figures/ (accessed June 3 2025).
- Ministry of Health Manatū Hauora. Obesity Te Mate Momona. 12 Feburary 2025. https://www.health.govt.nz/strategies-initiatives/programmes-and-initiatives/obesity (accessed May 30 2025).
- Walsh M, Brenton-Peters J, Perelini O, Bartholomew K. Cancers potentially attributable to excess body weight in Aotearoa New Zealand from 2019 to 2023. N Z Med J 2025; 138(1614): 91-109.
- Russell D, Parnell W, Wilson N, et al. NZ Food: NZ People. Key results of the 1997 National Nutrition Survey. Wellington, 1999.
- Masarik AS, Conger RD. Stress and child development: a review of the Family Stress Model. Current Opinion in Psychology 2017; 13: 85-90.
- World Economic Forum. The Economic Rationale for a Global Commitment to Invest in Oral Health. [Internet]. Geneva, 2024.
- Graham D. Potentially preventable admissions to New Zealand public hospitals for treatment of dental disease. [Master of Medical Science]. Dunedin: University of Otago:; 2025.
- Frank Group Frank Advice. The social, economic, and fiscal costs of the current settings for adult oral health. [Internet]. Wellington, 2024.
- Tustin K AJ, McAnally H, Duncanson M, Wicken A, Taylor B, Turnbull F. Oral health of children and young people in Aotearoa 2023. Dunedin, 2024.
- Ministry of Health Manatū Hauora. Community Water Fluoridation: An evidence review. 4 December 2024 2024. https://www.health.govt.nz/publications/community-water-fluoridation-an-evidence-review (accessed May 29 2025).
- Nip J, Edwards R, Hoek J, Waa A. Smoking prevalence and trends. Wellington: Public Health Communications Centre, 2024.
- Boulton A. New Zealand’s decision to scrap anti-smoking legislation will do immeasurable harm. BMJ 2023; 383: p2956.
- Hoek J, Edwards R, Ball J, et al. The Smokefree legislation is evidence-based, removing it is not. [Internet]. Wellington: Public Health Communications Centre, 2023.
- Health New Zealand Te Whatu Ora. Getting to Smokefree 2025: The final push to achieving the Smokefree 2025 goal. [Internet]. 2024. https://www.tewhatuora.govt.nz/publications/getting-to-smokefree-2025-the-final-push-to-achieving-the-smokefree-2025-goal (accessed May 29 2025).
- Edwards R, Hoek J, Waa A, Wilson N. Risk proportionate regulation of nicotine and tobacco products: More rhetoric than reality. Wellington: Public Health Communication Centre, 2024.
- Action for Smokefree 2025 (ASH). ASH Year 10 Snapshot Survey 2024: Topline – Youth smoking and vaping. 2024. https://www.ash.org.nz/ash_year_10 (accessed May 29 2025).
- Erhabor J, Yao Z, Tasdighi E, Benjamin EJ, Bhatnagar A, Blaha MJ. E-cigarette Use and Incident Cardiometabolic Conditions in the All of Us Research Program. Nicotine & Tobacco Research 2025.
- Friel S, Collin J, Daube M, et al. Commercial determinants of health: future directions. The Lancet 2023; 401(10383): 1229-40.
- PwC. Megatrends Five global shifts reshaping the world we live in: Price Waterhouse Cooper, 2022.
- The Lancet. A Commission on climate change. The Lancet 2009; 373(9676): 1659.
- Bennett H, Jones R, Keating G, Woodward A, Hales S, Metcalfe S. Health and equity impacts of climate change in Aotearoa-New Zealand, and health gains from climate action. N Z Med J 2014; 127(1406): 16-31.
- Royal Society Te Apārangi. Human Health Impacts of Climate Change for New Zealand Evidence Summary. Wellington, 2017.
- Lacy-Nichols J, Nandi S, Mialon M, et al. Conceptualising commercial entities in public health: beyond unhealthy commodities and transnational corporations. The Lancet 2023; 401(10383): 1214-28.
- The Lancet. Unravelling the commercial determinants of health. The Lancet 2023; 401(10383): 1131.
- Sustainable Business Network. Revolutionising work together. 2025. Welcome to Sustainable Business Network - SBN (accessed May 4 2025).
- Macmillan A, Cresswell Riol K, Wild K. Stuck With the Car and All its Harms? A Public Health Approach to the Political Economy of the Status Quo. Active Travel Studies 2021; 1(1).
- Freudenberg N. Legal but Lethal: Corporations, Consumption and Protecting Public Health. Oxford and New York: Oxford University Press; 2014.
- Trucost PLC. Natural capital at risk: The top 100 externalities of business. Geneva, 2013.
- Morrice E, Colagiuri R. Coal mining, social injustice and health: a universal conflict of power and priorities. Health Place 2013; 19: 74-9.
- Ozarka E, Hoek J. A narrative analysis of a tobacco industry campaign to disrupt Aotearoa New Zealand's endgame policies. Tob Control 2024.
- Parliamentary Counsel Office Te Tari Tohurohu Pāremata. Smokefree Environments and Regulated Products Amendment Bill (enacted). 2024. https://www.legislation.govt.nz/bill/government/2024/0022/latest/whole.html (accessed June 15 2025).
- Hoek J, Ball J, Waa A, Graham-DeMello A, Edwards R, Gregan M. Mind the gap: Associate Health Minister’s actions conflict with Ministry advice, align with tobacco industry lobbying. 2024. https://www.phcc.org.nz/briefing/mind-gap-associate-health-ministers-actions-conflict-ministry-advice-align-tobacco (accessed May 25 2025).
- Graham-DeMello A, Gregan M, Waa A, Gallopel-Morvan K, Hoek J. Aotearoa New Zealand's 'endgame' legislation: a critical analysis of the parliamentary repeal debate using an adapted policy dystopia model approach. Tob Control 2025.
- Randerson S, Wright, K., Connor, J. Local alcohol policies: What’s the opportunity to reduce harm? 2024. https://www.phcc.org.nz/briefing/local-alcohol-policies-whats-opportunity-reduce-harm (accessed May 2 2025).
- Chambers T, Mizdrak A, Jones A, Davies A, Sherk A. Estimated alcohol-attributable health burden in Aotearoa New Zealand. Wellington, 2024.
- Ministry of Health Manatū Hauora. Annual Data Explorer Key Indicators. 2024. https://minhealthnz.shinyapps.io/nz-health-survey-2023-24-annual-data-explorer/_w_f69e09b189c642d0af09e5ebf6eb8850/#!/key-indicators (accessed May 2 2025).
- Burke S, Roseveare, C. Alcohol-related harms now available on demand. 15 August 2024 (accessed May 6 2025).
- McCreanor T, Moewaka Barnes A, Goodwin I, et al. Alcohol marketing on social media: young people’s exposure, engagement and alcohol-related behaviors. Addiction Research & Theory 2025; 33(3): 161-71.
- Sneyd S, Richardson M. Online alcohol deliveries: age verification processes of online alcohol delivery companies in Auckland, New Zealand. N Z Med J 2024; 137(1606): 13-21.
- Randerson S, Casswell S, Borell B, et al. Systemic inequities in alcohol licensing: Case studies in eight Aotearoa New Zealand communities. Drug and Alcohol Review 2025; 44(2): 459-70.
- Ministry for the Environment Manatū mo Te Taiao. Adapting to climate change. National Adaptation Plan. 2022. https://environment.govt.nz/what-government-is-doing/areas-of-work/climate-change/adapting-to-climate-change/national-adaptation-plan/ (accessed May 1 2025).
- Te Puni Kōkiri. Understanding Climate Hazards for Hapori Māori Insights for Policy Makers. Wellington, 2023.
- Pourzand F, Bolton A, Salter C, Hales S, Woodward A. Health and climate change: adaptation policy in Aotearoa New Zealand. The Lancet Regional Health - Western Pacific 2023; 40: 100954.
- Ministry for the Environment Manatū mo Te Taiao. Ngā mahi āhuarangi mō ngāi Māori | Climate action for Māori Te mahere urutaunga ā-motu | The national adaptation plan. Wellington, 2022.
- Ministry for the Environment Manatū mo Te Taiao. Adapting to sea-level rise. 17 June 2022 2022. https://environment.govt.nz/what-government-is-doing/areas-of-work/climate-change/adapting-to-climate-change/adapting-to-sea-level-rise/ (accessed May 30 2025).
- Li A, Leppold C. Long-term mental health trajectories across multiple exposures to climate disasters in Australia: a population-based cohort study. The Lancet Public Health 2025; 10(5): e391-e400.
- Laking G, Caddie M, Thorpe H, McClutchie J, et al. Te Weu me Te Wai Research into health and wellbeing impacts of adverse weather conditions. Report for Ministry of Health | Manatū Hauora. Auckland: Waipapa Taumata Rau | the University of Auckland, Te Weu Tairāwhiti, and Sustainable Hawkes Bay, 2024.
- Environmental Health Intelligence New Zealand Massey University. Social vulnerability to the impacts of climate-related hazards in Aotearoa New Zealand. Wellington, 2024.
- Government Inquiry into Havelock North Drinking Water. Report of the Havelock North Drinking Water Inquiry: Stage 1. 2017. https://www.dia.govt.nz/Stage-1-of-the-Water-Inquiry#Report-1 (accessed June 3 2025).
- Health New Zealand Te Whatu Ora. Boil water notice remains in place as investigations identify water contamination as likely source of crypto outbreak. 6 October 2023 2023. https://www.tewhatuora.govt.nz/corporate-information/news-and-updates/boil-water-notice-remains-in-place-as-investigations-identify-water-contamination-as-likely-source-of-crypto-outbreak (accessed May 20 2025).
- Noy I. The Costs and Consequences of Sudden-Onset Disasters: What We Do Know and What We Don’t. Wellington: Te Āwhionukurangi Chair In The Economics Of Disasters And Climate Change Victoria University Of Wellington | Te Herenga Waka; 2025.
- Wilson N, Broadbent A, Kerr J. The long shadow of Cyclone Gabrielle: Brief review at 12 months. Wellington, 2024.
- Peart R, Boston S, Maher S, Konlechner T. Aotearoa New Zealand’s Climate Change Adaptation Act: Building a Durable Future, Principles and Funding for Managed Retreat. Auckland, 2023.
- Storey B, Owen S, Zammit C, Noy I. Insurance retreat in residential properties from future sea level rise in Aotearoa New Zealand. Climatic Change 2024; 177(3): 44.
- Mayes J, Wall, G. Climate Anxiety and Young People Supporting coping and resilience, 2023.
- Redstall S. Tangoio Marae 'weeping' as graves restored from Cyclone Gabrielle devastation. Stuff. 2023 February 19, 2023.
- World Meteorological Organization (WMO). State of the Climate in South-West Pacific 2023. Geneva, 2024.
- Newport C, Tiatia-Siau J, Aimiti Ma'ia'i K, Underhill-Sem Y, Woodward A. Anchored in pacific protocols – climate change, mental health and wellbeing. Climate and Development 2024; 16(6): 540-50.
- Bowen K, Ebi KL, Woodward A, McIver L, Tukuitonga C, Nayna Schwerdtle P. Human health and climate change in the Pacific: a review of current knowledge. Climate and Development 2024; 16(2): 119-33.
- New Zealand Foreign Affairs and Trade Manatū Aorere. Pacific Peoples and Climate-related (Im)mobility: A Synthesis Report on Scale, Pattern and Impact, Now and in the Future. Wellington, 2024.
- United Nations Development Programme (UNDP). What is climate change mitigation and why is it urgent? Explainers. February 29, 2024 2024. https://climatepromise.undp.org/news-and-stories/what-climate-change-mitigation-and-why-it-urgent (accessed May 3 2025).
- United Nations Development Programme (UNDP). What is climate change adaptation and why is it crucial? Explainers. January 30, 2024 2024. https://climatepromise.undp.org/news-and-stories/what-climate-change-adaptation-and-why-it-crucial (accessed May 3 2025).
- Binder JF, Kenyon J. Terrorism and the internet: How dangerous is online radicalization? Front Psychol 2022; 13: 997390.
- Holt T, Chermak S, Freilich J. An Assessment of Extremist Groups Use of Web Forums, Social Media, and Technology to Enculturate and Radicalize Individuals to Violence. Final report to the National Institute of Justice, 2021.
- Marsh S, Bullen C, Chu J, Einstein D, Reid C. Social media and youth wellbeing: The need for a multi-layered public health approach. Wellington, 2025.
- Tuesday R, Taufa, T., Gentles, D., Fa'alili-Fidow, J. The impacts of social media on the wellbeing of Pacific youth in New Zealand- A literature review: Social Media impacts on Pacific youth. Pacific Health Dialog 2024; 21(11).
- Wu Y, Kemps E, Prichard I. Digging into digital buffets: A systematic review of eating-related social media content and its relationship with body image and eating behaviours. Body Image 2024; 48: 101650.
- Jesse L, Isabel H, Cervantée W. The impact of the social media industry as a commercial determinant of health on the digital food environment for children and adolescents: a scoping review. BMJ Global Health 2025; 10(2): e014667.
- Neely SR, Eldredge C, Ersing R, Remington C. Vaccine Hesitancy and Exposure to Misinformation: a Survey Analysis. J Gen Intern Med 2022; 37(1): 179-87.
- Te Tira Ārai Urutā New Zealand Royal Commission COVID-19 Lessons Learned. Whītiki Aotearoa: Lessons from COVID-19 to prepare Aotearoa New Zealand for a future pandemic. Summary report Pūrongo Whakarāpopoto Phase 1. Wellington, 2024.
- United Nations Environment Programme. Artificial Intelligence (AI) end-to-end: The Environmental Impact of the Full AI Lifecycle Needs to be Comprehensively Assessed - Issue Note. Nairobi, 2024.
- Office of the Prime Minister’s Chief Science Advisor. Capturing the benefits of AI in healthcare for Aotearoa New Zealand. Wellington, 2023.
- Georgieva K. AI will transform the global economy. Let’s Make Sure It Benefits Humanity. January 14, 2024 2024. https://www.imf.org/en/Blogs/Articles/2024/01/14/ai-will-transform-the-global-economy-lets-make-sure-it-benefits-humanity (accessed April 20 2025).
- Katz A. How could generative AI transform our economy? Part 1: Economic theories and emerging evidence. Wellington: NZIER, 2024.
- Henderson P. At the cutting edge: How Artificial Intelligence will change our primary sector forever. Auckland, 2023.
- AI Forum New Zealand. AI IN ACTION Exploring the Impact of Artificial Intelligence on New Zealand's Productivity. Wellington, 2025.
- HRD Human Resources Director. As AI usage climbs in New Zealand, survey finds governance, training 'stubbornly low'. 2025. As AI usage climbs in New Zealand, survey finds governance, training 'stubbornly low' | HRD New Zealand. (accessed April 15 2025).
- Katz A. How could generative AI transform our economy? Part 2: Future developments and policy responses. Wellington: NZIER, 2024.
- Pacific Data Sovereignty network. Preserving our heritage in the light of innovation. Pacific data sovereignty and AI, 2025.
- IBM. What are AI hallucinations? 20 April 2024. https://www.ibm.com/think/topics/ai-hallucinations (accessed May 12 2025).
- Benjamin R. The New Artificial Intelligentsia. October 19, 2024. https://lareviewofbooks.org/article/the-new-artificial-intelligentsia/ (accessed June 2 2025).
- Nicolls H, Mukherjee, U. The impact of artificial intelligence – an economic analysis. Wellington, 2024.
- Department of the Prime Minister and Cabinet (DPMC) Te Tari o Te Pirimia me te Komiti Matua. Public Research and Insights into Disinformation. 2023. https://www.dpmc.govt.nz/our-programmes/national-security/strengthening-resilience-disinformation/public-research-and-insights-disinformation (accessed May 30 2025).
- Privacy Commissioner Te Mata Mātāpono Matatapu. Artificial Intelligence and Information Privacy Principles. Wellington, 2023.
- Appel G, Neelbauer J, Schweidel D. Generative AI has an intellectual property problem. April 8, 2023 2023. https://hbr.org/2023/04/generative-ai-has-an-intellectual-property-problem (accessed May 24 2025).
- Department for Science Innovation and Technology UK Government. Cybersecurity risks to artificial intelligence. 2024. https://www.gov.uk/government/publications/research-on-the-cyber-security-of-ai/cyber-security-risks-to-artificial-intelligence (accessed April 6 2025).
- De Freitas J, Cohen IG. The health risks of generative AI-based wellness apps. Nat Med 2024; 30(5): 1269-75.
- BERL. The AI energy paradox: Balancing consumption and efficiency. 2025. The AI energy paradox: Balancing consumption and efficiency | BERL (accessed June 2 2025).
- Vector Limited. Electricity Asset Management Plan Update 2025-2035, 2025.
- Digital.govt.nz. Responsible AI Guidance for the Public Service GenAI. 2025. https://www.digital.govt.nz/standards-and-guidance/technology-and-architecture/artificial-intelligence/responsible-ai-guidance-for-the-public-service-genai (accessed June 3 2025).
- Frog Recruitment. AI in NZ’s Public Sector: Opportunities, Challenges, and Ethical Concerns. 2025. https://www.frogrecruitment.co.nz/blog/ai-in-new-zealands-public-sector-a-smart-move-or-a-risky-bet (accessed June 3 2025).
- Digital.govt.nz. Public Service AI Framework. 2024. https://www.digital.govt.nz/standards-and-guidance/technology-and-architecture/artificial-intelligence/public-service-artificial-intelligence-framework (accessed June 2 2025).
- World Economic Forum. Advancing Data Equity: An Action-Oriented Framework. 11 September 2024. https://www.weforum.org/publications/advancing-data-equity-an-action-oriented-framework/ (accessed June 10 2025).
- Cancela-Outeda C. The EU's AI act: A framework for collaborative governance. Internet of Things 2024; 27: 101291.
- Waitangi Tribunal. The Report on the Comperhensive and Progressive Agreement for Trans-Pacific Partnership, 2023.
- Kukutai T, Campbell-Kamariera K, Mead A, et al. Māori Data Governance Model, 2023.
- Kukutai T, Clark V, Culnane C, Teague V. Māori data sovereignty and offshoring Māori data. Rotorua, 2022.
- Te Mana Raraunga Māori Data Sovereignty Network. Our Data, Our Sovereignty, Our Future. 2025. https://www.temanararaunga.maori.nz/ (accessed June 5 2025).
- Taiuru & Associates. Māori Voices in the Artificial Intelligence (AI) Landscape of Aotearoa New Zealand. 2024. https://www.taiuru.co.nz/maori-voices-in-the-artificial-intelligence-ai-landscape-new-zealand/ (accessed June 3 2025).
- Natanahira T. Te reo Māori needs to go digital to survive - innovator. 18 September 2024 2024. https://www.rnz.co.nz/news/national/528365/te-reo-maori-needs-to-go-digital-to-survive-innovator (accessed June 3 2025).
- Ministry of Justice Te Tāhū o te Ture. Key Initiatives Reduced violent crime. 2025. https://www.justice.govt.nz/justice-sector-policy/key-initiatives/reduced-violent-crime/ (accessed May 3 2025).
- Parliamentary Counsel Office Te Tari Tohurohu Pāremata. Local Government (Community Well-being) Amendment Act 2019. 2019. https://www.legislation.govt.nz/act/public/2019/0017/latest/whole.html (accessed June 4 2025).
- Parliamentary Counsel Office Te Tari Tohurohu Pāremata. Public Finance (Wellbeing) Amendment Act 2020. 2020. https://www.legislation.govt.nz/act/public/2020/0029/latest/whole.html (accessed June 14 2025).
- New Zealand Government. Public Finance Amendment Bill. 2025. https://bills.parliament.nz/v/6/b168a8b7-bd0e-466b-fedf-08dd98c831fd?Tab=history (accessed June 2 2025).
- Healthy Families New Zealand He Oranga Whānau. Healthy Families NZ Evaluations. 2024. https://www.healthyfamiliesnz.org/evaluations (accessed May 2 2025).
- Te Puni Kōkiri. Next steps for Whānau Ora. 28 March 2025. https://www.tpk.govt.nz/en/nga-putea-me-nga-ratonga/whanau-ora/next-steps-for-whanau-ora (accessed June 3 2025).
- Te Puni Kōkiri. Ngā Tini Whetū. 8 May 2025 2025. https://www.tpk.govt.nz/en/nga-putea-me-nga-ratonga/whanau-ora/nga-tini-whetu-is-a-whanaucentred-early-support-pr (accessed June 2 2025).
- Matheson A, Wehipeihana N, Gray R, et al. Building a systems-thinking community workforce to scale action on determinants of health in New Zealand. Health & Place 2024; 87: 103255.
- AIKO. Ngā Tini Whetū Prototype Evaluation. Wellington, 2023.
- Whānau Ora Commissioning Agency. E Tipu E Rea. Ngā Tini Whetū: The Collateral Change for Reducing Child Poverty Report, 2022.
- The King's Fund. Equity and endurance: how can we tackle health inequalities this time? 16 March 2022 2022. https://www.kingsfund.org.uk/insight-and-analysis/long-reads/how-can-we-tackle-health-inequalities (accessed May 1 2025).
- Chin M, King P, Jones R, et al. Lessons for achieving health equity comparing Aotearoa/New Zealand and the United States. Health Policy 2018; 122(8): 837-53.
- Parsell C, Juha K, Suzanne F, and Kuskoff E. What does it take to end homelessness? Tweaking or transforming systems. Housing Studies 2024: 1-19.
- Saunders M, Barr B, McHale P, Hamelmann C. Key policies for addressing the social determinants of health and health inequities. Copenhagen, 2017.
- Cavalcanti DM, Ordoñez JA, da Silva AF, et al. Health effects of the Brazilian Conditional Cash Transfer programme over 20 years and projections to 2030: a retrospective analysis and modelling study. The Lancet Public Health 2025; 10(7): e548-e58.
- Holdroyd I, Vodden A, Srinivasan A, Kuhn I, Bambra C, Ford JA. Systematic review of the effectiveness of the health inequalities strategy in England between 1999 and 2010. BMJ Open 2022; 12(9): e063137.
- Cancer Control Agency Te Aho o Te Kahu. Lung Cancer 1995-2019. 2025. Lung Cancer :: Te Aho o Te Kahu - Cancer Control Agency. URL: https://teaho.govt.nz/index.php/reports-and-numbers/what-happening-over-time/lung-cancer (accessed June 2 2025).
- Wang TKM, Grey C, Jiang Y, et al. Trends in cardiovascular outcomes after acute coronary syndrome in New Zealand 2006-2016. Heart 2020.
- The Codrington Reparations Project. Reparations and Reparative Justice. 2024. https://www.codringtonproject.org/about/reparations-reparative-justice/ (accessed May 2 2025).
- New Zealand Law Society Te Kāhui Ture o Aotearoa. The Principles of The Treaty | te Tiriti - kōrero with the experts. 17 January 2025. https://www.lawsociety.org.nz/news/publications/lawtalk/lawtalk-issue-960/the-principles-of-the-treaty-te-tiriti-korero-with-the-experts/ (accessed April 20 2025).
- Ruru J. Tūhoe-Crown settlement – Te Urewera Act 2014. October 2014. https://maorilawreview.co.nz/2014/10/tuhoe-crown-settlement-te-urewera-act-2014/ (accessed June 3 2025).
- Ministry of Social Development Te Manatū Whakahiato Ora. He Tapuae – Tūhoe Service Management Plan Giving effect to the shared commitment as outlined in He Tapuae – Tūhoe Service Management Plan. 2022. https://www.msd.govt.nz/about-msd-and-our-work/newsroom/budget/2022/factsheets/he-tapuae-tuhoe-service-management-plan.html (accessed June 4 2025).
- Whitehead J, Paterson R, English B. Tuhoe Service Management Plan Review. July 20 2020 2020. https://issuu.com/teurutaumatua/docs/tuhoe_service_management_plan_6201_ (accessed April 14 2025).
- Te Pou Tupua. Te Awa Tupua. 2023. https://www.tepoutupua.nz/teawatupua (accessed April 2 2025).
- Parliamentary Counsel Office Te Tari Tohurohu Pāremata. Te Awa Tupua (Whanganui River Claims Settlement) Act 2017 Version as at 24 December 2024. Wellington: New Zealand Government; 2024.
- Parliamentary Counsel Office Te Tari Tohurohu Pāremata. New Zealand Bill of Rights Act 1990. 1990. https://legislation.govt.nz/act/public/1990/0109/latest/DLM224792.html (accessed June 3 2025).
- Parliamentary Counsel Office Te Tari Tohurohu Pāremata. Human Rights Act 1993 Version as at 1 July 2024. 1993. https://www.legislation.govt.nz/act/public/1993/0082/latest/DLM304212.html (accessed June 3 2025).
- Parliamentary Counsel Office Te Tari Tohurohu Pāremata. Homosexual Law Reform Act 1986. 1986. https://legislation.govt.nz/act/public/1986/0033/latest/whole.html (accessed June 3 2025).
- Parliamentary Counsel Office Te Tari Tohurohu Pāremata. Civil Union Act 2004. 2004. https://www.legislation.govt.nz/act/public/2004/0102/latest/DLM323385.html (accessed June 1 2025).
- Parliamentary Counsel Office Te Tari Tohurohu Pāremata. Marriage (Definition of Marriage) Amendment Act 2013. 2013. https://www.legislation.govt.nz/act/public/2013/0020/latest/whole.html (accessed June 1 2025).
- Parliamentary Counsel Office Te Tari Tohurohu Pāremata. Conversion Practices Prohibition Legislation Act 2022. 2022. https://www.legislation.govt.nz/act/public/2022/0001/latest/whole.html (accessed June 3 2025).
- Te Kāhui Tika Tangata Human Rights Commission. Monitoring the Declaration on the Rights of Indigenous Peoples. 27 April 2023. https://tikatangata.org.nz/our-work/monitoring-the-declaration-on-the-rights-of-indigenous-peoples-2 (accessed June 1 2025).
- Te Kāhui Tika Tangata Human Rights Commission. Rights of children and young people. 2025. https://tikatangata.org.nz/human-rights-in-aotearoa/rights-of-children-and-young-people-2 (accessed June 8 2025).
- Cleveland F, Stephens M. Exploring trends in income inequality in New Zealand (2007–2023). Wellington, 2024.
- Duncanson M, Roy M, van Asten H, et al. Child Poverty Monitor 2022 Technical Report. 2022. https://nzchildren.co.nz/ (accessed April 3 2025).
- UNICEF Innocenti – Global Office of Research and Foresight. Innocenti Report Card 18: Child poverty in the midst of wealth. Florence, Italy, 2023.
- Inland Revenue Te Tari Taake. WhakapikiWhānau | FamilyBoost. 5 June 2024, updated 7 July, 2025 2025. https://www.ird.govt.nz/familyboost (accessed July 10, 2025).
- Te Kōhanga Reo. Te Orokohanganga History. 2025. https://www.kohanga.ac.nz/kaupapa/te-oorokohanganga (accessed March 24 2025).
- Te Rito Maioha Early Childhood New Zealand. Deep Dive: Replace the ECE funding model. 2025. https://www.ecnz.ac.nz/articles/news/replace%20the%20ece%20funding%20model (accessed May 24 2025).
- Office of the Controller and Auditor-General Tumuaki o Te Mana Arotake. Education for Māori: Context for our proposed audit work until 2017 Part 3: Historical and current context for Māori education. Wellington, 2012.
- New Zealand Qualifications Authority Mana Tohu Matauranga o Aotearoa. Aide-Memoire: NCEA in Kaupapa Maori senior secondary settings. Wellington, 2024.
- Chapman R, Howden-Chapman P, Viggers H, O'Dea D, Kennedy M. Retrofitting houses with insulation: a cost-benefit analysis of a randomised community trial. J Epidemiol Community Health 2009; 63(4): 271-7.
- Nathan K, Robertson O, Atatoa Carr P, Howden-Chapman P, Pierse N. Residential mobility and potentially avoidable hospitalisations in a population-based cohort of New Zealand children. J Epidemiol Community Health 2022; 76(6): 606-12.
- Ministry of Housing and Urban Development Te Tūāpapa Kura Kāinga. Home Building Dashboard. 2025. https://www.hud.govt.nz/stats-and-insights/the-government-housing-dashboard/home-building#tabset (accessed June 15 2025).
- Pierse N, Johnson E, Guha Thakurta A, Chisholm E. Healthy Homes Initiative Five year outcomes evaluation. Wellington, 2024.
- The Salvation Army Social Policy and Parliamentary Unit. State of the Nation 2025 Kai, Kāinga, Whānau | The Basics—Food, a Home, Family. February 2025 2025. https://www.salvationarmy.org.nz/research-policy/social-policy-parliamentary-unit/state-nation-2025/ (accessed May 30 2025).
- Kia Piki Ake Welfare Expert Advisory Group. Whakamana Tāngata Restoring Dignity to Social Security in New Zealand. Wellington, 2019.
- Ministry of Justice Te Tāhū o te Ture. New Zealand Crime and Victims Survey. Key Results- Cycle 6. Results drawn from Cycle 6 (2023) of the New Zealand Crime and Victims Survey. Wellington, 2024.
- Cook L. Examining the over-representation of Māori in prisons: 1910 to 2020. Wellington, 2021.
- Ministry of Justice Te Tāhū o te Ture. Justice Sector. Long Term Insights Briefing. Focus on Imprisonment in New Zealand. Long-term Insights on Imprisonment, 1960-2050. Wellington, 2022.
- Ministry of Justice Te Tāhū o te Ture. Alcohol and Other Drug Treatment Court. 2025. https://www.justice.govt.nz/courts/criminal/specialist-courts/alcohol-and-other-drug-treatment-court/ (accessed June 15 2025).
- Walker J. Taking lessons from the Rangatahi Courts. 2018. https://www.districtcourts.govt.nz/youth-court/publications/taking-lessons-from-the-rangatahi-courts (accessed June 1 2025).
- Walker J. When the Vulnerable offend — whose fault is it? 2017. https://www.districtcourts.govt.nz/youth-court/publications/when-the-vulnerable-offend-whose-fault-is-it (accessed June 15 2025).
- Abuse in Care Royal Commission of Inquiry. Survivors. 2025. https://www.abuseincare.org.nz/for-survivors (accessed June 1 2025).
- Borell B, Romeo J. 24 years of life lost: people placed in state care have died earlier, more violent deaths – new study. The Conversation. 2025 February 5 2025.
- Leung-Wai J. Economic Cost of Abuse in Care Final Report Scoping of approach and high-level estimate 29 September 2020. Wellington, 2020.
- Abuse in Care Royal Commission of Inquiry. Whanaketia in brief. 2025. https://www.abuseincare.org.nz/about-us/panui/whanake (accessed June 1 2025).
- Aroturuki Tamariki Independent Children's Monitor. Experiences of Care in Aotearoa Agency Compliance with the National Care Standards and Related Matters Regulations Reporting Period 1 July 2023 – 30 June 2024. 2025. https://aroturuki.govt.nz/assets/Reports/EOCR2324/Experiences-of-Care-2023-24.pdf (accessed June 1 2025).
- Oranga Tamariki Ministry for Children. Disparity and Disproportionality in the Care and Protection System to June 2023. 2023. https://www.orangatamariki.govt.nz/assets/Uploads/About-us/Research/Latest-research/Report-on-disparities-and-disproportionality-experienced-by-tamariki-Maori/A3-disparities-and-disproportionality-measurement-2023.pdf (accessed May 4 2025).
- Oranga Tamariki Ministry for Children. Strategic partnerships with Māori. August 1, 2023 2023. https://www.orangatamariki.govt.nz/about-us/our-work/strategic-partnerships-with-maori/ (accessed May 10 2025).
- Shields E, Wright K, Borland A, Connor J, Randerson S, Maynard K. New Zealanders strongly support policies to curb alcohol harm – will government listen? Wellington: Public Health Communication Centre, 2025.
- Pearce J, Blakely T, Witten K, Bartie P. Neighborhood Deprivation and Access to Fast-Food Retailing: A National Study. American Journal of Preventive Medicine 2007; 32(5): 375-82.
- Social Investment Agency Toi Hau Tāngata. What is social investment? 2025. https://www.sia.govt.nz/social-investment/what-is-social-investment (accessed June 4 2025).
- Strengthening Families Te Huarahi ki te Whakapiri i Ngā Whānau. Get the best support so your whānau or family can thrive. June 30, 2022 2022. https://www.strengtheningfamilies.govt.nz/ (accessed May 2 2025).
- Oranga Tamariki Evidence Centre. Strengthening Families: Research on how the programme operates, 2020.
- Leonard C, Bidois T, Goldsmith L, et al. Evaluation of Wave 17 for Te Pūtahitanga o Te Waipounamu. Ten years of commissioning for whānau wellbeing. Christchurch, 2024.
- Lakhotia S, E M, Mentink C. Whakainea te Whakaaweawetia o te Whānau Ora Measuring Impact for Whānau wellbeing. Auckland, 2019.
- ImpactLab. Do Good Better. Turn data into action. 2025. https://www.impactlab.co.nz/ (accessed May 1 2025).
- Boston J, Gill D, (ed). Social Investment: A New Zealand Policy Experiment. In: Boston J, Gill D, editors. Wellington: BWB Bridget Williams Books; 2017.
- South Auckland Social Wellbeing Board. Capturing Learning for Collective Impact. Learnings through action. February 2023 2023. https://saswb.com/learnings2023 (accessed June 6 2025).
- Manaaki Tairāwhiti. Manaaki Tairāwhiti. Who we are. 2025. https://www.mt.org.nz/who-we-are/ (accessed June 4 2025).
- Social Investment Agency Toi Hau Tāngata. Fact Sheet Demonstration Initiatives. 2025. https://www.sia.govt.nz/assets/Publications/fact-sheets/Factsheet-Demonstration-initiatives.pdf.
- The Southern Initiative. The Southern Initiative. 2025. https://www.tsi.nz/ (accessed June 6 2025).
- Tāmaki Regeneration Company. Tāmaki is People. Tāmaki is Place. Tāmaki is Possibilities. 2021. https://tamakiregeneration.co.nz/ (accessed May 3 2025).
- Rosenberg B. New Zealand’s low value economy. Auckland, 2016.
- New Zealand Productivity Commission. Productivity by the numbers. Wellington, 2023.
- New Zealand Infrastructure Commission Te Waihanga. The decline of housing supply in New Zealand. 2024. https://tewaihanga.govt.nz/our-work/research-insights/the-decline-of-housing-supply-in-new-zealand.
- Child Poverty Action Group. Submission: Social Security Act Ammendment Bill (Benefit Sanctions). January 10, 2025. https://static1.squarespace.com/static/60189fe639b6d67b861cf5c4/t/67843d77bedb5a66eefef860/1736719737267/Social+Security+Act+Ammendment+Bill+Submission+CPAG+10+Jan+2025.pdf (accessed April 23 2025).
- Te Mana Whakaatu Classification Office. What We’re Watching: New Zealanders’ views about what we see on screen and online. Wellington, 2022.
- Stats NZ Tatauranga Aotearoa. New Zealanders’ trust in key institutions declines. 25 September 2024. New Zealanders’ trust in key institutions declines | Stats NZ (accessed April 20 2025).
- Monks J, Webster-Brown J, Godfrey S, et al. Open letter to the Coalition Government from scientific societies in New Zealand. 2024. https://freshwater.science.org.nz/news-publications-jobs/news/open-letter-to-the-coalition-government-from-scientific-societies-in-new-zealand/ (accessed May 3 2025).
- Stubbing J, Gibson K, Bardsley A, Gluckman P. “We’re living in a world that wasn’t built for us”: A qualitative exploration of young New Zealander’s perspectives on socio-ecological determinants of declining youth mental health. BMC Public Health 2025; 25(1): 1648.
- Ngāti Rangi. Ngāti Rangi Strategic Plan 2020-2025 - Summary. 2025. https://ngatirangi.com/mo-wai/strategy-or-te-ara-ki-te-moungaroa (accessed June 3 2025).
- Te Rūnanga o Ngāi Tahu. Te Rūnanga o Ngāi Tahu. Mō tātou, ā, mō kā uri ā muri ake nei. 2025. https://ngaitahu.iwi.nz/te-runanga-o-ngai-tahu/ (accessed June 3 2025).
- Work and Income Te Hiringa Tangata. Changes announced in Budget 2025. 22 May 2025 2025. https://www.workandincome.govt.nz/about-work-and-income/news/2025/changes-announced-in-budget-2025.html (accessed June 5 2025).
- Tertiary Education Commission Te Amorangi Mātauranga Matua. Apprenticeship Boost. 23 April 2025. https://www.tec.govt.nz/funding/funding-and-performance/funding/fund-finder/apprenticeship-boost (accessed June 1 2025).
- Parliamentary Counsel Office Te Tari Tohurohu Pāremata. Public Service Act 2020 Version as at 14 May 2025. 2025. https://www.legislation.govt.nz/act/public/2020/0040/latest/LMS106159.html (accessed June 7 2025).
- Curtis E, Loring B, Latham K, et al. An innovative Indigenous-led model for integrated COVID-19 case management in Auckland, New Zealand: lessons from implementation. Frontiers Public Health 2024; 12(1324239).
- WAI 262 Kia Whakapūmau. Ko Aotearoa Tēnei. 2025. https://www.wai262.nz/ko-aotearoa-tenei (accessed June 7 2025).
- Office of the Controller and Auditor-General Tumuaki o Te Mana Arotake. How public organisations are fulfilling Treaty settlements. 10 April 2025. https://www.oag.parliament.nz/2025/treaty-settlements/overview.htm (accessed June 1 2025).
- Jackson M. The connection between white supremacy and colonisation. March 24, 2019. https://e-tangata.co.nz/comment-and-analysis/the-connection-between-white-supremacy/ (accessed June 1 2025).
- Working Group on Constitutional Transformation. The Report of Matike Mai Aotearoa – The Independent Working Group on Constitutional Transformation, 2016.
- Matike Mai Aotearoa. Matike Mai Aotearoa,. 2025. https://matikemai.maori.nz/matike-mai-aotearoa/ (accessed June 8 2025).
- Parliament of Canada. Bill C-14 Statutes of Canada 2021 Chapter 14. June 21, 2021 2021. https://www.parl.ca/DocumentViewer/en/43-2/bill/C-15/royal-assent (accessed May 14 2025).
- BC Treaty Commission. Treaties and Agreements. 2023. https://bctreaty.ca/treaties-and-agreements/ (accessed May 4 2025).
- World Economic Forum. The Future of Growth Report 2024 Insight Report January 2024. Geneva, 2024.
- Office of the Controller and Auditor-General Tumuaki o Te Mana Arotake. Commentary on Te Tai Waiora: Wellbeing in Aotearoa New Zealand. 29 August 2023. https://www.oag.parliament.nz/2023/te-tai-waiora-commentary (accessed June 13 2025).
- The Treasury Te Tai Ōhanga. He Ara Waiora. 2 September 2024 2021. https://www.treasury.govt.nz/information-and-services/nz-economy/higher-living-standards/he-ara-waiora (accessed June 5 2025).
- Welsh Government Llywodraeth Cymru. Well-being of Future Generations (Wales) Act 2015: the essentials. 7 January 2025 2025. https://www.gov.wales/well-being-future-generations-act-essentials-html (accessed June 13 2025).
- Foundations for Tomorrow. Foundations for Tomorrow is a youth-driven non-profit committed to renewing Australia’s leadership, decision-making and governance approaches. 2025. https://www.foundationsfortomorrow.org/ (accessed June 14 2025).
- Wellbeing Economy Alliance (WEAll). For an economy in service of life. 2025. https://weall.org/ (accessed June 4 2025).
- WEAll Aotearoa Wellbeing Economic Alliance. Join the movement for an economy in service of life. 2025. https://www.weall.org.nz/ (accessed June 16 2025).
- Raworth K. Meet the doughnut: the new economic model that could help end inequality. April 28, 2017. https://www.weforum.org/stories/2017/04/the-new-economic-model-that-could-end-inequality-doughnut/ (accessed May 1 2025).
- Ellen MacArthur Foundation. What is a circular economy? 2025. https://www.ellenmacarthurfoundation.org/topics/circular-economy-introduction/overview (accessed June 16 2025).
- Raworth K. Doughnut Economics: Seven Ways to Think Like a 21st-Century Economist. UK: Random House Business Books; 2017.
- Yussof S, Faiesall S. Doughnut economics: the sweet centre at the heart of a Malaysian's city regeneration. January 9, 2025. https://www.weforum.org/stories/2025/01/doughnut-economics-ipoh-malaysia/ (accessed May 3 2025).
- Shareef J, Boasa-Dean T. An Indigenous Māori View of Doughnut Economics. 27 September 2020 2020. https://doughnuteconomics.org/stories/an-indigenous-maori-view-of-doughnut-economics (accessed May 1 2025).
- Kiingitanga. Honouring our Past - Resetting our Future. Facebook; 2025.
- Inland Revenue Te Tari Taake. Long Term Insight Briefing Our Tax System: Bases and Regimes – A Summary. 2025.
- Parliamentary Counsel Office Te Tari Tohurohu Pāremata. Equal Pay Amendment Bill Government Bill 147-1. 2025. https://www.legislation.govt.nz/bill/government/2025/0147/latest/whole.html (accessed June 10 2025).
- Moana Connect. Tamaiti ole Moana 2033.Towards 2033 – a 10-year action plan. Auckland, 2023.
- New Zealand Productivity Commission. A fair chance for all: Breaking the cycle of persistent disadvantage. Wellington, 2023.
- Retirement Commission Te Ara Ahunga Ora. 2022 Review of Retirement Income Policies: Housing. 2022. https://retirement.govt.nz/policy-and-research/retirement-income-policy-review/2022-review-of-retirement-income-policies/housing (accessed June 8 2025).
- Chambers T, Hales S, Shaw C, et al. New Zealand's Climate Change Commission report: the critical need to address the missing health co-benefits of reducing emissions. N Z Med J 2021; 134(1542): 109-18.
- Shaw C, Randal E, Macmillan A, et al. Improving health and preventing cancer through a better transport system in Aotearoa/New Zealand. Journal of the Royal Society of New Zealand 2024: 1-17.
- Climate Change Commission He Pou a Rangi. Review of the 2050 target and of international shipping and aviation emissions. Wellington, 2024.
- Rodin J, Bratburd JR, Duff N, et al. Charting a path to health for all at net-zero emissions. The Lancet, 2025.
- Climate and Health Alliance. Clearing the air. Transport decarbonisation and our health. Canberra, 2023.
- Metcalfe J, Kuschel G. Estimating the impacts of introducing Euro 6/VI vehicle emission standards for New Zealand. Report prepared by Emission Impossible Ltd for Te Manatū Waka Ministry of Transport. Wellington, 2022.
- New Zealand Transport Agency Waka Kotahi. E-bike support schemes and transport equity. 2025. https://www.nzta.govt.nz/assets/resources/research/reports/732/732-e-bike-support-schemes-and-transport-equity-summary.pdf (accessed May 3 2025).
- Randal E, Shaw C, McLeod M, Keall M, Woodward A, Mizdrak A. The Impact of Transport on Population Health and Health Equity for Māori in Aotearoa New Zealand: A Prospective Burden of Disease Study. Int J Environ Res Public Health 2022; 19(4).
- Melbourne Climate Futures. Multiple health benefits of climate mitigation measures by sector. 2025. https://www.unimelb.edu.au/climate/collaboration/research-themes/health,-wellbeing-and-climate-justice/multiple-health-benefits-of-climate-mitigation-measures (accessed April 25 2025).
- Bradbury KE, Murphy N, Key TJ. Diet and colorectal cancer in UK Biobank: a prospective study. Int J Epidemiol 2020; 49(1): 246-58.
- Kingham S. The role of wellbeing in intelligent transport decisions. T-Tech Transport Innovation Conference. Auckland; 2018.
- Chevance G, Bourne J, Foley L, et al. E-bikes and travel behaviour change: systematic review of experimental studies with meta-analyses. Transport Reviews 2025; 45(3): 433-54.
- Karlsson M, Eva A, and Westling N. Climate policy co-benefits: a review. Climate Policy 2020; 20(3): 292-316.
- Lindsay G, Macmillan A, Woodward A. Moving urban trips from cars to bicycles: impact on health and emissions. Australian and New Zealand Journal of Public Health 2011; 35(1): 54-60.
- Shanahan D, Bush R, Gaston K, et al. Health Benefits from Nature Experiences Depend on Dose. Scientific Reports 2016; 6(1): 28551.
- Raja A, Opit, S., Mackie, H., Witten, K. Māngere E-Bike Trial Stage 2: Integrating an e-bike in daily life. Auckland, 2023.
- Witten K, Opit S, Mackie H, Raja A. Challenging the inequities of ebike access: An investigation of a community-led intervention in a lower-income neighbourhood in Aotearoa - New Zealand. Journal of Transport & Health 2024; 39: 101891.
- Kondo MC, Mueller N, Locke DH, et al. Health impact assessment of Philadelphia's 2025 tree canopy cover goals. The Lancet Planetary Health 2020; 4(4): e149-e57.
- Bealing M. Accelerating business investment in climate change mitigation and adaptation. Wellington, 2024.
- Public Health Advisory Committee. Rebalancing our food system. Wellington, 2024.
- New Zealand Farm Assured. New Zealand Farm Assured New Zealand's trusted red meat and wool farm assurance programmes. 2025. https://www.nzfap.com/ (accessed June 4 2025).
- Bord Bia Irish Food Board. Origin Green Your Path To Sustainable Food Production. 2025. https://www.bordbia.ie/industry/origin-green/ (accessed June 1 2025).
- Association of Salaried Medical Specialists (ASMS). Creating Solutions Te Ara Whai Tika A roadmap to health equity 2040. Wellington, 2021.
- McLeod M, Harris R. Action plan for achieving high quality ethnicity data in the health and disability sector. Wellington, 2023.
- AI Forum New Zealand. AI Governance. 2025. https://aigovernance.nz/ (accessed June 5 2025).
- World Economic Forum. Sovereign AI: What it is, and 6 strategic pillars for achieving it. April 25, 2024. https://www.weforum.org/stories/2024/04/sovereign-ai-what-is-ways-states-building/ (accessed June 1 2025).
- O'Riley B. NZ is ‘the best kept secret in the third world’. AI can change that. Newsroom. 2025 23 January 2025. NZ is 'the best kept secret in the third world'. AI can change that. (accessed May 30, 2025)
- Centre of Digital Enterprise. Harnessing AI for a Sustainable Energy Future in New Zealand. 2024. https://www.auckland.ac.nz/en/business/our-research/research-institutes-centres/centre-digital-enterprise/news-and-events/tech-talk/december-20240/harnessing-ai-for-a-sustainable-energy-future-in-new-zealand.html (accessed June 1 2025).
- Ministry of Education Te Tāhuhu o Te Mātauranga. Te Hōtaka Ka Ora, Ka Ako Healthy School Lunches Programme. 28 May 2025 2025. https://www.education.govt.nz/our-work/overall-strategies-and-policies/wellbeing-in-education/free-and-healthy-school-lunches (accessed June 1 2025).
- Ng M, Gakidou E, Lo J, et al. Global, regional, and national prevalence of adult overweight and obesity, 1990 2021, with forecasts to 2050: a forecasting study for the Global Burden of Disease Study 2021. The Lancet 2025; 405(10481): 813-38.
- Theodore R, McLean R, TeMorenga L. Challenges to addressing obesity for Māori in Aotearoa/New Zealand. Australian and New Zealand Journal of Public Health 2015; 39(6): 509-12.
- McKerchar C, Barthow C, Huria T, et al. Enablers and barriers to dietary change for Māori with nutrition-related conditions in Aotearoa New Zealand: a scoping review. Public Health Nutr 2024; 27(1): e245.
- McLennan AK, Ulijaszek SJ. Obesity emergence in the Pacific islands: why understanding colonial history and social change is important. Public Health Nutr 2015; 18(8): 1499-505.
- Barton B, Love T, Peck C, Watt D. Economic impact of excess weight in Aotearoa: Collating, evaluating, and updating the evidence. Auckland, 2021.
- Roberto CA, Swinburn B, Hawkes C, et al. Patchy progress on obesity prevention: emerging examples, entrenched barriers, and new thinking. Lancet 2015; 385(9985): 2400-9.
- Obesity Evidence Hub. Prevention. 2025. https://www.obesityevidencehub.org.au/collections/prevention (accessed June 10 2025).
- Beech J, Cooper E, Holmes J, McKenna H. What role do taxes and regulation play in promoting better health? UK, 2020.
- World Obesity Global Observatory. New Zealand Policies, Interventions and Actions. 2025. https://data.worldobesity.org/country/new-zealand-155/#data_policies (accessed June 10 2025).
- Healthy Families New Zealand He Oranga Whānau. National Kai Impact Report Food System Transformation in Aotearoa. Wellington, 2022.
- Vos T, Carter R, Barendregt J, et al. Assessing Cost-Effectiveness in Prevention (ACE–Prevention): Final Report. Brisbane, 2010.
- World Health Organization. Tackling NCDs: best buys and other recommended interventions for the prevention and control of noncommunicable diseases, second edition. 2024.
- Mackay S, Percival H, Te Morenga L, Swinburn B. Benchmarking Food Environments 2023: Progress by the New Zealand Government on implementing recommended food environment policies & priority recommendations. Auckland, 2023.
- Dry T, Baker P. Generating Political Commitment for Regulatory Interventions Targeting Dietary Harms and Poor Nutrition: A Case Study on Sugar-Sweetened Beverage Taxation in Australia. International Journal of Health Policy and Management 2022; 11(11): 2489-501.
- Food Industry Taskforce on Addressing Factors Contributing to Obesity. Food Industry Taskforce on Addressing Factors Contributing to Obesity Final Report to Ministers of Health and Food Safety. Wellington, 2018.
- Obesity Evidence Hub. Countries and jurisdictions that have taxes on sugar-sweetened beverages (SSBs). 2025. https://www.obesityevidencehub.org.au/collections/prevention/countries-that-have-implemented-taxes-on-sugar-sweetened-beverages-ssbs#cite2008 (accessed June 4 2025).
- Shaw C, Randal E, Keall M, Woodward A. Health consequences of transport patterns in New Zealand's largest cities. N Z Med J 2018; 131(1472): 64-72.
- Chapman R, Keall M, Howden-Chapman P, et al. A Cost Benefit Analysis of an Active Travel Intervention with Health and Carbon Emission Reduction Benefits. International Journal of Environmental Research and Public Health 2018; 15(5): 962.
- Sassi F. Obesity and the Economics of Prevention. OECD, 2010.
- OECD Health Policy Studies. The Heavy Burden of Obesity: The Economics of Prevention. Paris, 2019.
- Healthy Families Waitakere. Kai Villages. A showcase of community-led food sovereignty in West Auckland. 2024. https://healthyfamilieswaitakere.org.nz/https-healthyfamilieswaitakere-org-nz-wp-content-uploads-2024-12-kai-villages-showcase-final-pdf/ (accessed June 12 2025).
- Weave Ltd. Papatoetoe Food Hub. Transforming local food systems. Auckland, 2021.
- Kai Rotorua Inc. Kai Rotorua Home. 2025. https://kairotorua.nz/ (accessed June 3 2025).
- Rush E, Curran-Cournane F, McDowell R. Feeding Aotearoa New Zealand people better: from farm to fork. Journal of the Royal Society of New Zealand 2025: 1-7.
- Smith J, Hutchings J. Feeding Indigenous Aotearoa better. Journal of the Royal Society of New Zealand 2024: 1-19.
- Pouono T. Big is beautiful: Health and well-being in Pacific communities. Dialog 2024; 63(4): 191-7.
- Tapsell P. Kāinga People, Land and Belonging. Wellington: BWB Texts Bridget Williams Books Ltd; 2021.
- Boulton A, Allport T, Kaiwai H, Harker R, Potaka Osborne G. Māori perceptions of ‘home’: Māori housing needs, wellbeing and policy. Kōtuitui: New Zealand Journal of Social Sciences Online 2022; 17(1): 44-55.
- Malungahu GM. Too little space! Experiences and perspectives of housing and housing policy. Tongan families with rheumatic fever in South Auckland and key housing informants. Auckland: University of Auckland; 2020.
- Office of the United Nations High Commissioner for Human Rights & UN Habitat. The Right to Adequate Housing Fact Sheet. Geneva: United Nations; 2010.
- CoreLogic Limited. NZ housing not cheap, but affordability shows signs of improving. 2025. https://www.corelogic.co.nz/news-research/news/2025/nz-housing-not-cheap,-but-affordability-shows-signs-of-improving (accessed June 14 2025).
- Ministry of Social Development Te Manatū Whakahiato Ora. Housing Register. March 2025. https://www.msd.govt.nz/about-msd-and-our-work/publications-resources/statistics/housing/housing-register.html#LatestresultsMarch20251 (accessed June 13 2025).
- Lai H, Prickett K, Renker‑Darby A, Paine S, Atatoa Carr P. Housing and homelessness, 2023.
- Howden-Chapman P, McKee M, Davies M, Mberu B, et al. Policies to improve housing, health and wellbeing. submitted to the Lancet Public Health; 2025.
- Ministry for the Environment Manatū mo Te Taiao. Kia tū pakari a Aotearoa i ngā huringaāhuarangi | Adapt and thrive: Building a climate-resilient New Zealand. Chapter 4: Driving climate-resilient development in the right locations. 2022. https://environment.govt.nz/publications/aotearoa-new-zealands-first-national-adaptation-plan/driving-climate-resilient-development-in-the-right-locations/ (accessed June 2 2025).
- New Zealand Green Building Council Te Kaunihera Hanganga Tautaiao. Closing the gap Hidden emissions and untapped potential of buildings to reduce costs and deliver for carbon budgets. Wellington, 2024.
- OECD Directorate of Employment Labour and Social Affairs Social Policy Division. OECD Affordable Housing Database - indicator PH4.2. Social rental housing stock, https://oe.cd/ahd.PH4.2., 2024.
- Waitangi Tribunal. Kāinga Kore: The Stage One Report of the Housing Policy and Services Kaupapa Inquiry on Māori Homelessness. Wellington, 2023.
- Ministry of Housing and Urban Development Te Tūāpapa Kura Kāinga. MAIHI Ka Ora – the National Māori Housing Strategy. 22 December 2022. https://www.hud.govt.nz/our-work/maihi-ka-ora-the-national-maori-housing-strategy (accessed June 1 2025).
- Ministry of Housing and Urban Development Te Tūāpapa Kura Kāinga. Whai Kāinga Whai Oranga. 22 May 2025. https://www.hud.govt.nz/our-work/whai-kainga-whai-oranga (accessed June 13 2025).
- Ministry of Housing and Urban Development Te Tūāpapa Kura Kāinga. Toitū Tairāwhiti partnership. 2 June 2022. https://www.hud.govt.nz/news/toitu-tairawhiti-partnership (accessed June 14 2025).
- Te Pouahi o Te Taitokerau. Tradition and innovation: new papakāinga homes open in Rāwhiti. In: te_pouahi-o_te_taitokerau, editor: Facebook; 2025.
- Ka Ururoa. Te Urunga Kāinga. 2025. https://kauruora.nz/housing-2/ (accessed June 13 2025).
- Johnson A. How many state houses do we need? CPAG 2023 Policy Brief on social housing. Auckland, 2023.
- Yao Q, Li X, Luo F, Yang L, Liu C, Sun J. The historical roots and seminal research on health equity: a referenced publication year spectroscopy (RPYS) analysis. Int J Equity Health 2019; 18(1): 152.
- Taylor R, Rieger A. Medicine as Social Science: Rudolf Virchow on the Typhus Epidemic in Upper Silesia. International Journal of Health Services 1985; 15(4): 547-59.
- Marmot MG, Shipley MJ, Rose G. Inequalities in death--specific explanations of a general pattern? Lancet 1984; 1(8384): 1003-6.
- Gray AM. Inequalities in health. The Black Report: a summary and comment. Int J Health Serv 1982; 12(3): 349-80.
- Robson B, Harris, R. (eds). Hauora: Māori Standards of Health IV: A study of the years 2000-2005. 2007. https://www.otago.ac.nz/wellington/research/groups/research-groups-in-the-department-of-public-health/erupomare/research/hauora-maori-standards-of-health-iv-a-study-of-the-years-2000-2005 (accessed June 2 2025).
- Marmot MG, Smith GD, Stansfeld S, et al. Health inequalities among British civil servants: the Whitehall II study. Lancet 1991; 337(8754): 1387-93.
- United Nations Department of Economic and Social Affairs. The 17 goals. https://sdgs.un.org/goals (accessed June 13 2025).
- Loring B, Reid P, Curtis E, McLeod M, Harris R, Jones R. Ethnicity is an evidence-based marker of need (and targeting services is good medical practice). N Z Med J 2024; 137(1603): 9-13.
- Crengle S, Davie G, Whitehead J, de Graaf B, Lawrenson R, Nixon G. Mortality outcomes and inequities experienced by rural Māori in Aotearoa New Zealand. Lancet Reg Health West Pac 2022; 28: 100570.
- Baker MG, Barnard LT, Kvalsvig A, et al. Increasing incidence of serious infectious diseases and inequalities in New Zealand: a national epidemiological study. Lancet 2012; 379(9821): 1112-9.
- Oben G, Crengle S, Kokaua J, Duncanson M. Trends in deprivation in hospitalisations of Indigenous children and young people in Aotearoa New Zealand. J Paediatr Child Health 2022; 58(8): 1345-51.
- Ministry of Health Manatū Hauora. HISO 10001:2017 Ethnicity Data Protocols. 2017. https://www.tewhatuora.govt.nz/assets/Our-health-system/Digital-health/Health-information-standards/HISO-10001-2017-Ethnicity-Data-Protocols.pdf (accessed June 17 2025).
- McLeod M, Harris R, Curtis E, Loring B. Considerations for Māori Data Analyses: A report for Te Aka Whai Ora. Wellington, 2023.
- Cormack D, Robson C. Classification and output of multiple ethnicities: issues for monitoring Māori health. Wellington, 2010.
- Stats NZ Tatauranga Aotearoa. Census counts nearly 99 percent of the population. 2023. https://www.stats.govt.nz/news/2023-census-counts-nearly-99-percent-of-the-population/ (accessed June 5 2025).
- Sonder G, Grey C, Ryan D, Cumming J, Sporle A, Hill P. Selective under-representation of Pacific peoples in population estimates for health indicator measurements in Aotearoa New Zealand misinforms policy making. BMC Public Health 2024; 24(1): 564.
- Harris R, Paine SJ, Atkinson J, et al. We still don't count: the under-counting and under-representation of Māori in health and disability sector data. N Z Med J 2022; 135(1567): 54-78.
- Worksafe Mahi Haumaru Aotearoa. Report - Work health and safety: an overview of work-related harm and risk in Aotearoa New Zealand. Wellington, 2024.
- Business Leaders’ Health and Safety Forum. State of a Thriving Nation 2024: health safety and wellbeing in New Zealand. Wellington, 2024.
- Worksafe Mahi Haumaru Aotearoa. Dashboard - Work health and safety: An overview of harm and risk in Aotearoa New Zealand. Wellington, 2024.
- Worksafe Mahi Haumaru Aotearoa. Work-related health estimates and burden of harm. 2019. https://www.worksafe.govt.nz/topic-and-industry/work-related-health/work-related-health-estimates-and-burden-of-harm/ (accessed July 3 2025).
- Butchard M. Work-related Health Estimates: Work-related Health Deaths and Hospitalisations Estimates, and Update of the ACC Work-related Health Claims Figure. Wellington: WorkSafe New Zealand Mahi Haumaru Aotearoa, 2019.
- Stats NZ Tatauranga Aotearoa. New Zealand definition of homelessness: 2015 update. 2015. https://www.stats.govt.nz/methods/new-zealand-definition-of-homelessness-2015-update/ (accessed July 31 2025).
- Stats NZ Tatauranga Aotearoa. Severe housing deprivation (homelessness) estimates – updated methodology: 2023 Census. Wellington: Stats NZ Tatauranga Aotearoa, 2024.
- Stats NZ Tatauranga Aotearoa. 2023 Census severe housing deprivation (homelessness) estimate. 2024. https://www.stats.govt.nz/information-releases/2023-census-severe-housing-deprivation-homelessness-estimates/ (accessed July 31 2025).
- Atmore K, Viggers H, Howden Chapman P. Severe housing deprivation in Aotearoa New Zealand, 2018: He Kāinga Oranga / Housing & Health Research Programme, University of Otago, Wellington, 2021.
- Amore K. Severe housing deprivation in Aotearoa/New Zealand: 2001-2013: He Kainga Oranga/Housing & Health Research Programme, University of Otago, Wellington, 2016.
- Harris RB, Stanley J, Cormack DM. Racism and health in New Zealand: Prevalence over time and associations between recent experience of racism and health and wellbeing measures using national survey data. PLoS one 2018; 3(13(5)): e0196476.
- Ministry of Health Manatū Hauora. Racial Discrimination 2011/12, 2016/17 and 2020/21: New Zealand Health Survey. Wellington: Ministry of Health, 2023.
- Digital.govt.nz. Digital inclusion and wellbeing in New Zealand. 8 February 2022. 2022. https://www.digital.govt.nz/dmsdocument/161~digital-inclusion-and-wellbeing-in-new-zealand/html (accessed July 31 2025).
- Digital Equity Coalition Aotearoa. Affordable connectivity in Aotearoa: Digital Equity Coalition Aotearoa, 2023.
- Ministry of Social Development Te Manatū Whakahiato Ora. The Social Report: Te pūrongo oranga tangata. Wellington: Ministry of Social Development, 2016.
- Lowe BM, Smith M, Jaine R, Stanley J, Gage R, Signal L. Watching the watchers: assessing the nature and extent of children's screen time using wearable cameras. The New Zealand Medical Journal (Online) 2023; 136(1578): 12-31.
- Organization for Economic Cooperation and Development. 21st-century readers: Developing literacy skills in a digital world. Paris: PISA, OECD Publishing, 2021.
- Valkenburg PM, Meier A, Beyens I. Social media use and its impact on adolescent mental health: An umbrella review of the evidence. Current Opinion in Psychology 2022; 44: 58-68.
- Sense Partners. Cyberbullying in New Zealand. Wellington: Sense Partners, 2023.
- Netsafe. Annual report: Year in review July 2023-June 2024: Netsafe, 2024.
- National Health Committee. Health in Justice: Kia Piki te Ora, Kia Tika! – Improving the health of prisoners and their families and whānau: He whakapiki i te ora o ngā mauhere me ō rātou whānau. Wellington: Ministry of Health, 2010.
- Indig D, Gear C, Wilhelm K. Comorbid substance use disorders and mental health disorders among New Zealand prisoners: New Zealand Department of Corrections Wellington; 2016.
- Cunningham R, King PT, Telfer K, et al. Mortality after release from incarceration in New Zealand by gender: A national record linkage study. SSM - Population Health 2022; 20: 101274.
- Independent Panel. Understanding Policing Delivery: Report 1. Wellington: New Zealand Police Ngā Pirihimana o Aotearoa, 2024.
- Department of Corrections Ara Poutama Aotearoa. Prison facts and statistics - March 2025. 2025. https://www.corrections.govt.nz/resources/statistics/quarterly_prison_statistics/prison_facts_and_statistics_-_march_2025 (accessed July 21 2025).
- Ministry of Justice Te Tāhū o te Ture. Justice Sector Projections 2025-2035. Wellington: Ministry of Justice Te Tāhū o te Ture, 2025.
- Cook L. Examining the over-representation of Māori in prisons: 1910 to 2020. Welington: Victoria University of Wellington Te Herenga Waka, 2021.
- PHF Science. Health Effects of Air Pollution. 2022. https://www.phfscience.nz/digital-library/factsheet-on-who-aqg-health-effects-of-air-pollution/ (accessed August 4th 2025).
- Kuschel G, Metcalf J, Berentson-Shaw J, Hales S, Atkinson J, Woodward A. Health and air pollution in New Zealand 2016 (HAPINZ 3.0): Volume 1–Finding and implications. 2022.
- Environmental Health Intelligence New Zealand Massey University. Key findings from HAPINZ 3.0. No date. https://www.ehinz.ac.nz/projects/hapinz3/key-findings-from-hapinz/ (accessed August 4 2025).
- Metcalfe J, Kuschel G. Public Health Risks associated with Transport Emissions in NZ: Part 2 Road Transport Emission Trends. Wellington: The Institute of Environmental Science and Research, 2023.
- Stats NZ Tatauranga Aotearoa. PM₂.₅ concentrations (air quality): Data to 2023. 2024. https://www.stats.govt.nz/indicators/pm2-5-concentrations-air-quality-data-to-2023/ (accessed August 4 2025).
- Stats NZ Tatauranga Aotearoa. Nitrogen dioxide concentrations: Data to 2023. 2024. https://www.stats.govt.nz/indicators/nitrogen-dioxide-concentrations-data-to-2023/ (accessed August 8 2025).
- Taranaki Regional Council. Māori freshwater values. No date. https://trc.govt.nz/assets/Documents/Environment/SOE2022/TRC_State-Of-Environment_A4_Web-Spreads-Maori-Freshwater-Values.pdf (accessed August 7 2025).
- Ministry for the Environment Manatū mo Te Taiao. Essential Freshwater: Te Mana o te Wai factsheet. 2020. https://environment.govt.nz/publications/essential-freshwater-te-mana-o-te-wai-factsheet/ (accessed August 7 2025).
- Office of the Prime Minister’s Chief Science Advisor Kaitohutohu Mātanga Pūtaiao Matua ki te Pirimia. Nitrates in drinking-water. 2022. https://www.pmcsa.ac.nz/topics/nitrates/ (accessed August 7 2025).
- Stats NZ Tatauranga Aotearoa. Groundwater quality: Data to 2024. 2025. https://www.stats.govt.nz/indicators/groundwater-quality-data-to-2024/ (accessed August 7 2025).
- Public Health Communication Centre. Regulator failure on nitrate in drinking water dumps escalating costs on those downstream. 2024. https://www.phcc.org.nz/briefing/regulator-failure-nitrate-drinking-water-dumps-escalating-costs-those-downstream (accessed August 7 2025).
- Stats NZ Tatauranga Aotearoa. River water quality: Escherichia coli. 2022. https://www.stats.govt.nz/indicators/river-water-quality-escherichia-coli/ (accessed August 4 2025).
- Taumata Arowai. Drinking Water Regulation Report 2023. Wellington: Taumata Arowai, 2024.
- Chen J. A comparative analysis of lung cancer incidence and tobacco consumption in Canada, Norway and Sweden: a population-based study. International Journal of Environmental Research and Public Health 2023; 20(20): 6930.
- Parker K, Bartholomew K, Sandiford P, Crengle S. Te Oranga Pūkahukahu research programme: intentional steps towards a national equity-focused lung cancer screening programme in Aotearoa New Zealand. Journal of the Royal Society of New Zealand 2025: 1-16.
- Health New Zealand Te Whatu Ora. Amohia te waiora - Wellbeing. No date. https://www.alcohol.org.nz/wellbeing (accessed July 18 2025).
- Healthify He Puna Waiora. What harm can alcohol cause? 7 May 2025. 2025. https://healthify.nz/hauora-wellbeing/a/alcohol-and-harmful-drinking (accessed July 18 2025).
- Alcohol Healthwatch. Evidence-based alcohol policies: Building a fairer and healthier future for Aotearoa New Zealand. Auckland: Alcohol Healthwatch, 2020.
- NZIER. Costs of alcohol harms in New Zealand: Updating the evidence with recent research. A report for the Ministry of Health: NZIER, 2024.
- Australasian College for Emergency Medicine. Alcohol and methamphetamine harm in NZ EDs. 2020. https://acem.org.au/News/November-2020/Alcohol-and-methamphetamine-harm-in-NZ-EDs (accessed July 25 2025).
- Joyce LR, Cleland L, Forman E, Hlavac A, Foulds J, Crossin R. Changes in alcohol-related emergency department presentations-a comparison of three waves in 2013, 2017 and 2022. The New Zealand Medical Journal (Online) 2024; 137(1593): 56-67.
- Stats NZ Tatauranga Aotearoa. Alcohol available for consumption: Year ended December 2024. 26 February 2025. 2025. https://www.stats.govt.nz/information-releases/alcohol-available-for-consumption-year-ended-december-2024/ (accessed July 16 2025).
- Stats NZ Tatauranga Aotearoa. Alcohol available for consumption: Year ended December 2021. 2022. https://www.stats.govt.nz/information-releases/alcohol-available-for-consumption-year-ended-december-2021/ (accessed July 29 2025).
- Fairweather SM, Chang CL, Mansell CJ, Shafuddin E, Hancox RJ. Impact of COVID-19 pandemic restrictions on the cardio-respiratory health of New Zealanders. Respirology 2021; 26(11): 1041-8.
- Huang QS, Wood T, Jelley L, et al. Impact of the COVID-19 nonpharmaceutical interventions on influenza and other respiratory viral infections in New Zealand. Nature communications 2021; 12(1): 1001.
- Ministry of Health Manatū Hauora. Indicator of potentially avoidable hospitalisations for the Child and Youth Wellbeing Strategy: A brief report on methodology. Wellington: Ministry of Health Manatū Hauora, 2020.
- Ministry of Social Development Te Manatū Whakahiato Ora. Reporting on child and youth wellbeing and child poverty. 2025. https://www.msd.govt.nz/about-msd-and-our-work/child-wellbeing-and-poverty-reduction/reporting.html (accessed July 18 2025).
- Ministry of Health Manatū Hauora. Potentially avoidable hospitaliations by financial year 2020-2024. (Unpublished data)
- Child Poverty Action Group. Free GP visits. No date. https://www.cpag.org.nz/our-campaigns/free-gp-visits (accessed July 18 2025).
- Stacey T, Thompson JM, Mitchell EA, Zuccollo JM, Ekeroma AJ, McCowan LM. Antenatal care, identification of suboptimal fetal growth and risk of late stillbirth: findings from the Auckland Stillbirth Study. Aust N Z J Obstet Gynaecol 2012; 52(3): 242-7.
- Gilmour LS, Best EJ, Duncanson MJ, et al. High Incidence of Congenital Syphilis in New Zealand: A New Zealand Pediatric Surveillance Unit Study. The Pediatric Infectious Disease Journal 2022; 41(1): 66-71.
- Dawson P, Jaye C, Gauld R, Hay-Smith J. Barriers to equitable maternal health in Aotearoa New Zealand: an integrative review. International Journal for Equity in Health 2019; 18(1): 168.
- Sinclair O, Grant C. New Zealand's immunisation policy fails again and entrenches ethnic disparities. The New Zealand Medical Journal (Online) 2021; 134(1542): 92-5.
- Health New Zealand Te Whatu Ora. National Immunisation Schedule. 15 October 2025 2024. https://www.tewhatuora.govt.nz/for-health-professionals/clinical-guidance/immunisation-handbook/national-immunisation-schedule (accessed July 30 2025).
- Health New Zealand Te Whatu Ora. Immunisation coverage. 2025. https://www.tewhatuora.govt.nz/health-services-and-programmes/vaccine-information/immunisation-coverage (accessed July 18 2025).
Lists of figures and tables
Note: If you are in paged view, the links below will take you to the section the figure or table is in, rather than directly to the figure or table.
List of figures
- Figure 1: Tōtara in the forest of Tane
- Figure 2. Tōtara in the forest of Tane
- Figure 3. The persistent relationships between ethnicity and socioeconomic deprivation (NZDep) in Aotearoa New Zealand, 1991-2023
- Figure 4. Māori land loss between 1860 and 1939
- Figure 5. Individual weekly median income from wages and salary by total response ethnicity, 2008 to 2024
- Figure 6. Gini coefficient before and after housing costs for Aotearoa New Zealand, 1982 to 2024
- Figure 7. Material hardship rates for children by total response ethnicity, for year ended June 2007 to June 2024, in three-year groupings to 2018
- Figure 8. Annual unemployment rate by total response ethnicity, 2008 to 2024
- Figure 9. Young people aged 15-24 years who are not in employment, education or training (NEET) by total response ethnicity, 2008 to 2024
- Figure 10. Proportion of children attending Early Childhood Education for the 6 months prior to starting school by total response ethnicity, 2000 to 2024
- Figure 11. a) Proportion of students attending school 90% or more of the time by total response ethnicity in term 2, 2011 to 2024. b) School leavers with Level 2 NCEA or higher by total response ethnicity, 2009 to 2023
- Figure 12. Māori attending Māori-medium education out of all Māori attending education, 2004 to 2024
- Figure 13. Number of people living in crowded households, by total response ethnicity, 2006 to 2023
- Figure 14. Number of Māori affiliated to the ten largest Iwi, 2013 and 2023
- Figure 15. Number and proportion of Māori who speak te reo Māori, 2001 to 2023
- Figure 16. Lonely some, most, or all of the time by age group, 2016/17 and 2020/21 to 2023/24
- Figure 17. Proportion of people with high (7 to 10 out of 10) levels of trust in a) Parliament and b) Health institutions, by total response ethnicity, 2014 to 2023
- Figure 18. Proportion of the population with high (7 to 10 out of 10) levels of trust for other people by total response ethnicity, 2014 to 2023
- Figure 19. Aotearoa New Zealand’s annual average temperature anomaly, 1909 to 2022
- Figure 20. New Zealand’s gross and net emissions from 1990 to 2023
- Figure 21. Socioeconomic deprivation and Healthy Location Index map, Kerikeri
- Figure 22. Longitudinal trends in life expectancy by prioritised ethnicity, 2001 to 2022, three-year aggregated estimate
- Figure 23. Life expectancy by New Zealand Index of Deprivation (NZDep) quintile, by prioritised ethnicity Māori and non-Māori/non-Pacific, 2018-2022
- Figure 24. Infant mortality rates by prioritised ethnicity, 1999-2022
- Figure 25. Mortality rates related to diseases of the circulatory system* by prioritised ethnicity, WHO age standardised, 2000-2020
- Figure 26. Estimated prevalence of diabetes (type 1 and type 2) by prioritised ethnicity, WHO age standardised, 2013 to 2023
- Figure 27. Experienced high or very high psychological distress* in the past 4 weeks by age group, 2011/12-2023/24
- Figure 28. Adults experiencing high or very high psychological distress* in the past 4 weeks by gender 2011/12-2023/24
- Figure 29. Experienced high or very high psychological distress* in the past 4 weeks by disability, 2018/19-2023/24
- Figure 30. Children aged 5 years with dental decay (caries) at examination with the Community Oral Health Service, by prioritised ethnicity, 2002–2022
- Figure 31. Daily smokers (have smoked more than 100 cigarettes in lifetime and currently smoke at least once a day) by total response ethnicity, 2006/07 and 2011/12-2023/24
- Figure 32. Adults who vape daily by total response ethnicity, 2017/18-2023/24
- Figure 33. The impact of climate change on health
- Figure 34. Health co-benefits of climate mitigation measures by sector in Aotearoa New Zealand
- Figure 35. Work-related acute fatalities, number and age-standardised rate, 2002-2021
- Figure 36. Work-related serious non-fatal injuries, age-standardised rate for Māori and non-Māori, 2002-04 to 2019-21
- Figure 37. Severe housing deprivation by total response ethnicity, 2001-2023
- Figure 38. Experience of racial discrimination in the past 12 months by ethnic group*, 2011/12, 2016/17 and 2020/21
- Figure 39. Access to the internet at a household level, by total response ethnicity, 2001-2023
- Figure 40. Comparisons of European and Māori trends in imprisonment rates for males under 30 years
- Figure 41. E.Coli trend direction 2001-2020
- Figure 42. Mortality rates of children aged 1-14 years by New Zealand Index of Deprivation (NZDep) quintile, 1990 to 2018
- Figure 43. Mortality rates related to malignant cancers of the trachea, bronchus and lung*, by prioritised ethnicity, WHO age-standardised, 2000-2020
- Figure 44. Estimated prevalence of diabetes (type 1 and type 2) by New Zealand Index of Deprivation (NZDep), WHO age-standardised, 2013 to 2023
- Figure 45. Population with BMI 25 or over by total response ethnicity, 2006/07 and 2011/12 to 2023/24
- Figure 46. People who drank 6 or more alcoholic drinks on one occasion at least weekly by total response ethnicity, 2016/17-2023/24
- Figure 47. Ambulatory sensitive hospitalisation rate for people aged 45-64 years (WHO age-standardised) by prioritised ethnicity, 2001-2024.
- Figure 48. Potentially avoidable hospitalisations in children aged 0-14 years by prioritised ethnicity 2000-2020
- Figure 49. Potentially avoidable hospitalisations in children aged 0-14 years by prioritised ethnicity, year ended June 2020-June 2024
- Figure 50. Unmet need for a GP in the past 12 months due to cost by age group, 2011/12-2023/24
- Figure 51. Unmet need for a GP in the past 12 months due to cost for adults 15 years and older by disability, 2018/19-2023/24
- Figure 52. Unmet need for GP in the past 12 months due to cost for children aged 0 to 14 years by age group, 2011/12-2023/24
- Figure 53. Registration with a Lead Maternity Carer in the third trimester by prioritised ethnicity 2016, 2019 and 2023
- Figure 54. Registration with a Lead Maternity Carer after giving birth, by prioritised ethnicity 2016, 2019 and 2023
- Figure 55. Infants who were fully immunised at 6 months^ by prioritised ethnicity, 2009 to 2024
- Figure 56. Children who were fully immunised at 24 months^ by prioritised ethnicity, 2009 to 2024
List of tables
Publishing information
- Copyright status
-
Owned by the Ministry of Health and licensed for reuse under a Creative Commons Attribution 4.0 International Licence.