

The New Zealand Health Survey is a key tool for monitoring smoking and vaping among people aged 15 years and older. Questions on smoking have been included annually since 2011/12. Questions on vaping were first asked in 2015/16 as part of a tobacco use module and became part of the annual survey in 2017/18. Please refer to the latest Questionnaire and Content Guide for the questions on smoking and vaping.
The Annual Data Explorer includes data for several smoking and vaping indicators, with results available by various population groups (gender, age, ethnic group, neighbourhood deprivation, disability status, health region) and over time.
Here we present data on smoking and vaping in a series of graphs to help visualise trends. The focus is on daily smoking and daily vaping because daily use is more likely to indicate dependence.
Things to consider when interpreting these results:
- The New Zealand Health Survey provides a snapshot at one point in time. It can highlight associations between indicators, but it cannot show cause and effect. For example, the survey can show that increases in vaping mirror decreases in smoking in some groups, but it does not mean the increase in vaping caused the decrease in smoking or vice versa.
- Survey results can fluctuate from year to year, so it is important to focus on long-term trends, especially for smaller population groups. We use 95% confidence intervals to indicate the uncertainty in an estimate, which are shown as shaded areas on the graphs. For more information about confidence intervals see the Methodology Report.
- New Zealand’s goal is to be smokefree by 2025, with smokefree meaning that daily smoking prevalence is less than 5 percent for all population groups. Data for the 2024/25 survey were collected from July 2024 to July 2025, so they do not cover all of 2025.
Total population
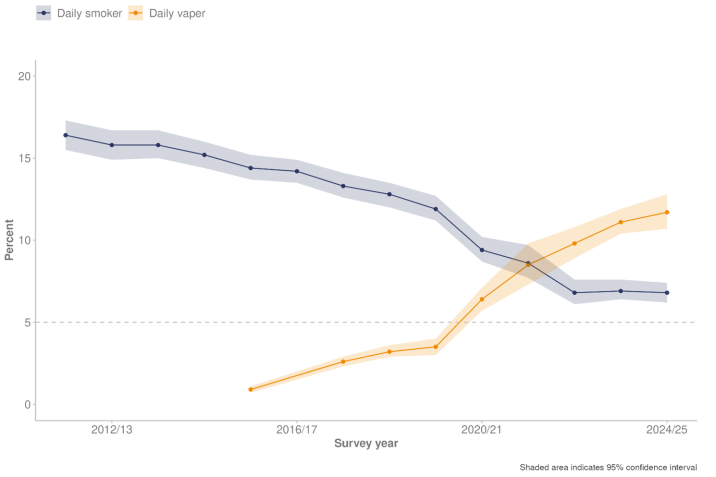
Trends for the total population (aged 15 years and over):
- In 2024/25, the prevalence of daily smoking was 6.8%. This is similar to the previous year (6.9%), but down from 16.4% in 2011/12.
- The estimated number of daily smokers nearly halved between 2011/12 and 2024/25, decreasing from 572,000 to 294,000.
- In 2024/25, the prevalence of daily vaping was 11.7%. This is similar to the previous year (11.1%), but up from 0.9% when first measured in 2015/16.
- The estimated number of daily vapers was 509,000 in 2024/25, up from 33,000 in 2015/16.
Figure 1: Prevalence of daily smoking and daily vaping, total population aged 15 years and over, 2011/12 to 2024/25
Trends by gender
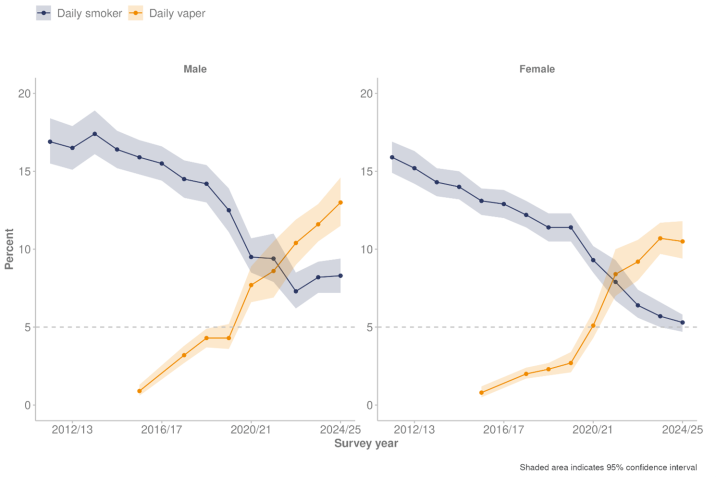
Trends for the total population mask differences by gender.
- Daily smoking has declined in both men and women since 2011/12, although the decline in men has stalled over the last few years and the gender gap has widened. In 2024/25, the prevalence of daily smoking was 8.3% in men and 5.3% in women.
- Daily vaping continues to increase in men, but the rate of increase in women has slowed in the last few years. In 2024/25, the prevalence of daily vaping was 13.0% in men and 10.5% in women.
Figure 2: Prevalence of daily smoking and daily vaping, by gender, 2011/12 to 2024/25
Trends by age group
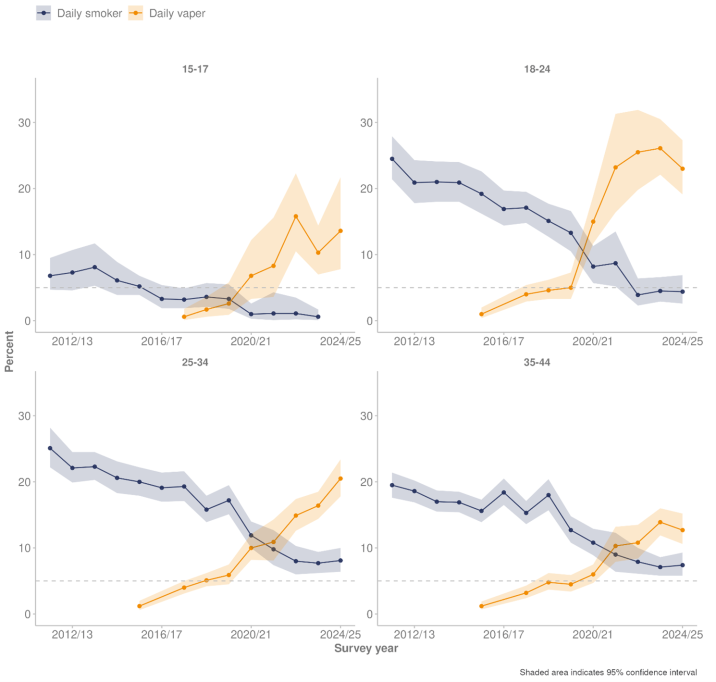
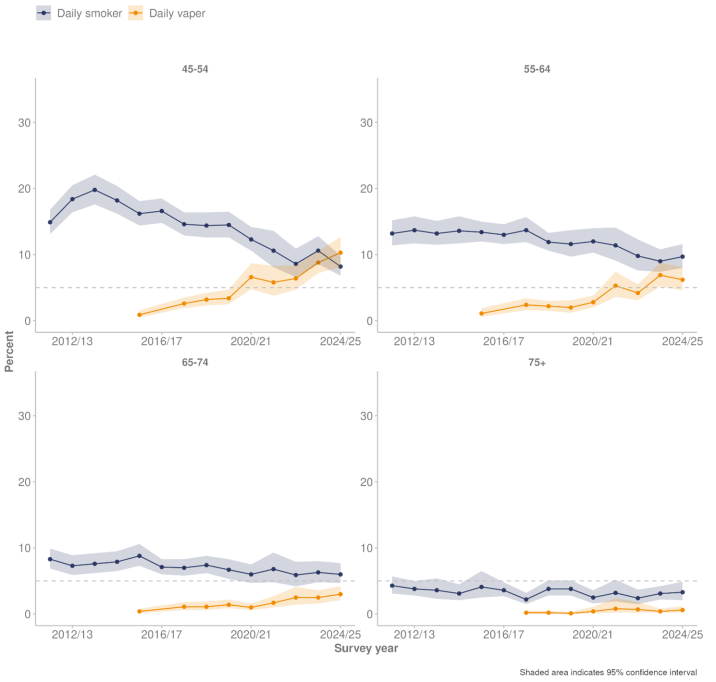
Trends in daily smoking and daily vaping vary by age group.
- Since 2011/12, the prevalence of daily smoking has decreased in all age groups (with the exception of those aged 75+), with the largest decreases in people aged under 45 years.
- Daily vaping has increased more quickly in younger adults, especially those aged 15–17 and 18–24 years. Increases in daily vaping in these age groups exceed decreases in daily smoking.
Figure 3: Prevalence of daily smoking and daily vaping, by age group, 2011/12 to 2024/25
Trends by neighbourhood deprivation
Trends in daily smoking and daily vaping vary by neighbourhood deprivation, as measured by the New Zealand Deprivation Index.
- Daily smoking has decreased, and daily vaping has increased, in all quintiles of neighbourhood deprivation (including quintiles 2 and 4, which are not shown on Figure 4) but inequities remain.
- In 2024/25, the prevalence of daily smoking in the most deprived neighbourhoods (quintile 5) was 12.9%, compared with 2.4% in the least deprived neighbourhoods (quintile 1).
- In 2024/25, the prevalence of daily vaping in the most deprived neighbourhoods was 21.1%, compared to 7.2% in the least deprived neighbourhoods.
Figure 4: Prevalence of daily smoking and daily vaping, by NZDep quintile, 2011/12 to 2024/25

Trends by ethnic group
Trends in daily smoking and daily vaping vary by ethnic group.
- The prevalence of daily smoking has declined in all ethnic groups since 2011/12, although inequities remain in 2024/25: Māori (15.0%), Pacific peoples (10.3%), European/Other (5.7%) and Asian (4.5%).
- In 2024/25, the prevalence of daily vaping was 27.5% in Māori, 20.0% in Pacific peoples, 11.5% in European/Other, and 5.6% in Asian adults.
Figure 5: Prevalence of daily smoking and daily vaping, by ethnic group, 2011/12 to 2024/25