
Contents
Summary
These tables present data about suicide deaths in New Zealand over the 20-year period from 1996 to 2015. The tables include numbers and rates by common demographic breakdowns, such as age, sex, ethnicity, district health board (DHB) of residence, neighbourhood deprivation. High level key findings describe statistics and time trends.
Understanding numbers and rates
It is important to note the difference between rates and numbers shown in these tables. Numbers refer to the actual number of people who have died by suicide. Rates account for differences in populations, which make them useful when comparing suicide deaths between population groups of different sizes. A rate measures how often a suicide occurs relative the number of people in the population. Rates, rather than numbers, are more meaningful when comparing suicide data over time and between different populations (eg, between Māori and non-Māori, between males and females).
Key findings
Overview about suicide in New Zealand 1996−2015
- Over the 20-year period (1996–2015), there was a statistically significant decrease in the rate of suicide (22.3% decrease, from 14.2 per 100,000 in 1996 to 11.0 per 100,000 in 2015). The peak rate during this period was in 1998 (15.1 per 100,000 population) and the lowest rate was in 2014 (10.8 per 100,000).
- In 2015, there were 525 suicide deaths; a rate of 11.0 per 100,000
Sex
- The rate of suicide for males decreased significantly (28.8%), from 22.9 per 100,000 males in 1996 to 16.3 per 100,000 males in 2015. During the same time period the rate for females did not change markedly.
- Male suicide rates were at least 2.5 times the rate of female suicides.
Age
- The rates of suicide for youth tended to be higher than other life stage groups, but the rate for youth decreased significantly over the 20-year period.
- The youth rate for males also decreased significantly, however for most of the 20-year period the rate for youth-aged males remained at least twice as high as the rate for youth-aged females.
- Over the 20-year time period the rate for adults aged 25–44 years decreased significantly, while the rate for those aged 45-64 years increased slightly.
- Adults aged 65+ years generally had the lowest rates of suicide.
Deprivation (2006−2015)
- For the majority of the 10-year period 2006−2015, the rate of suicide for those living in the most deprived areas was significantly higher (around twice as high) than for those living in the least deprived areas.
- The highest rates of suicide during this period were for youth (15−24 years) and middle aged adults (25−44 years) living in the most deprived areas.
Ethnicity
Māori/Non-Māori
- Over the 20-year period, suicide rates for Māori fluctuated, but were significantly higher than for non-Māori for the majority of the period.
- For the majority of the 20-year period, suicide rates for Māori tended to be highest for males, those aged 15–44 years and those living in more deprived areas.
Because of small numbers in some ethnic groups data used to compare ethnic groups has been aggregated for the five-year period (2011–2015)
- For Māori, rates of suicide (for the five-year period, 2011–2015) were higher than for other ethnic groups:
- Māori, 16.5 per 100,000 Māori
- Pacific, 8.5 per 100,000 Pacific
- Asian, 4.6 per 100,000 Asian
- Other, 11.2 per 100,000 Other.
- For Pacific, the highest rates of suicide were for male youth (29.8 per 100,000) and males aged 25–44 years (15.5 per 100,000).
Methods
- The most common methods of suicide used were hanging, strangulation and suffocation, particularly in those aged 15−44 years.
- The proportion of suicides using these methods increased from about 40% to 60% from 1996–2015. In the same period the use of poisoning by gases and vapours decreased from about 30% to 9%. Use of other methods did not change much over time.
Urban/Rural profile
- Differences in the rates of suicide between those living in rural and urban areas have decreased over time, most markedly among male youth.
- For male youth, the rate of rural suicides decreased significantly from a peak of 54.4 per 100,000 in 2009 to 15.0 per 100,000 in 2015.
Reporting of suicide data
In New Zealand, suicide data is reported by both the Ministry of Health and by the Chief Coroner, Ministry of Justice. The coronial statistics are published as provisional and are a count of self-inflicted deaths released before coroners have investigated the circumstances surrounding death. The Ministry of Health publishes the number of suicides that have been confirmed by the coroner and also those provisionally coded as suicide where there is enough information to suggest the coroner will find the cause of death to be suicide. Consequently, the Chief Coroner’s statistics are published more quickly than the Ministry of Health’s statistics and there are differences between the numbers reported.
Comparison of deaths coded as suicides (Ministry of Health) and provisional suicides (Ministry of Justice) by quarter, between July 2007–Dec 2015
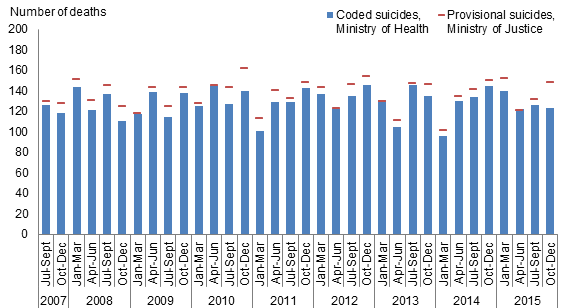
Confirmed suicides - New Zealand Mortality Collection
Provisional suicides - Coronial Services of New Zealand, Ministry of Justice