
This annual statistical publication presents suicide information received from the New Zealand Mortality Collection, and admissions to hospital for intentional self-harm sourced from the New Zealand National Minimum Dataset.

Contents
Summary
This publication and accompanying tables presents data about suicide deaths and intentional self-harm hospitalisations for the year 2013 and highlights notable trends over time. The publication includes numbers and rates by common demographic breakdowns, such as age, sex, ethnicity, district health board (DHB) of residence and neighbourhood deprivation. The online tables that accompany this report provide the underlying data for graphs presented in the report as well as time-series data. An overview of key findings can be found below.
Key findings
Suicide 2013
Overview
- A total of 508 people died by suicide in New Zealand in 2013, accounting for 1.7% of all deaths.
- In 2013, the highest rates of suicide were for males, Māori (especially Māori youth), youth aged 15–24 years and those living in the most deprived areas.
- The age-standardised suicide rate has decreased by 27.4% from the peak rate of 15.1 deaths per 100,000 population in 1998 to 11.0 deaths per 100,000 population in 2013.
Sex
- There were 365 male suicides (16.0 per 100,000 males) and 143 female suicides (6.3 per 100,000 females) in 2013.
- For every female suicide, there were 2.5 male suicides.
- Over time, the suicide rate for females has remained relatively stable while the male suicide rate has fluctuated. In 2013, the male rate was 33.2% lower than its highest rate in 1995.
Age
- The highest rate of suicide in 2013 was in the youth age group (15–24 years), and the lowest rate was in adults aged 65 years and over.
- Over recent years, the suicide rate for adults aged 45–64 years has increased, while the rate for adults aged 25–44 years has decreased, closing the gap between these two age groups.
Youth (15–24 years)
- In 2013, the youth suicide rate was 18.0 deaths per 100,000.
- There were twice as many male youth suicides as female youth suicides in 2013.
- Suicide rates in 2013 showed a marked difference between Māori and non-Māori youth, a trend consistent with previous years.
- Over time, youth suicide rates for males and females of Māori ethnicity, have been consistently higher than rates for their non-Māori counterparts.
Ethnicity
- For the period 2009–2013 (aggregated), the highest rate of suicide was in the Māori ethnic group (16.0 per 100,000 Māori), followed by European and Other (11.5 per 100,000 Europeans and Others).
- Among males, the Māori suicide rate was nearly twice that for Pacific and more than three times that for the Asian ethnic group.
- From 2004 to 2013, Māori suicide rates were consistently higher (at least 1.2 times) than non-Māori rates each year.
Deprivation
- In 2013, the suicide rate increased with each level of neighbourhood deprivation; the rate of suicide in the most deprived areas (quintile 5) was twice the rate in the least deprived areas (quintile 1).
- For youth aged 15–24 years, the number of suicides was four times as high in the most deprived areas compared with the rate in the least deprived areas.
Urban/rural profile
- The suicide rate was slightly higher in the rural areas (12.5 per 100,000 rural population) than in the urban areas (10.8 per 100,000 urban population).
District health board (DHB) region
- During the period 2009–2013 (aggregated), Lakes, Bay of Plenty, MidCentral and South Canterbury DHBs had significantly higher suicide rates than the national rate.
- For youth aged 15–24 years, Bay of Plenty and South Canterbury DHBs had significantly higher rates than the national average, while Waitemata and Auckland DHBs had significantly lower rates.
Intentional self-harm hospitalisations 2013
2013 (including short-stay ED events)
- There were 7267 intentional self-harm hospitalisations in New Zealand in 2013, equating to a rate of 176.7 per 100,000 population.
- The female rate of intentional self-harm hospitalisation was more than twice the male rate (246.9 per 100,000 females compared with 107.1 per 100,000 males).
- The highest rate of intentional self-harm hospitalisations for females was in the 15–19 years age group (912.6 per 100,000), and for males, the highest rate was in the 20–24 years age group (229.8 per 100,000).
- There were 2866 hospitalisations for youth (15–24 years) in 2013 (456.0 per 100,000). Three-quarters of youth hospitalisations were female.
- The highest rates of intentional self-harm hospitalisations were in the European and Other ethnic group followed by Māori.
- The age-standardised rate for Māori was 197.7 per 100,000 Māori compared with 172.2 per 100,000 non-Māori.
- Intentional self-harm hospitalisation rates were highest in more deprived areas; the highest rate was for those residing in deprivation quintile 4 (226.3 per 100,000) and the lowest in quintile 1 (128.0 per 100,000).
Trends over time, 2004–2013 (excluding short-stay ED events)
- The rate of intentional self-harm hospitalisations rose by 4.6% in the period 2004–2013 (75.5 per 100,000 population in 2004 to 78.9 per 100,000 in 2013).
- The rate of intentional self-harm hospitalisation for females was at least 1.7 times the male rate each year in this 10-year period.
- Approximately one in three intentional self-harm hospitalisations were in the youth age group (15–24 years). Youth rates for females were consistently higher than for males during this 10-year period.
- The rates for all ethnic groups increased over this period.
- Since 2004, rates of intentional self-harm hospitalisations for Māori have been generally higher than rates for non-Māori over this period.
Reporting of suicide data
In New Zealand, suicide data is reported by both the Ministry of Health and by the Chief Coroner, Ministry of Justice. The coronial statistics are published as provisional and are a count of self-inflicted deaths released before coroners have investigated the circumstances surrounding death. The Ministry of Health publishes the number of suicides that have been confirmed by the coroner and also those provisionally coded as suicide where there is enough information to suggest the coroner will find the cause of death to be suicide. Consequently, the Chief Coroner’s statistics are published more quickly than the Ministry of Health’s statistics and there are differences between the numbers reported.
Comparison of deaths coded as suicides (Ministry of Health) and provisional suicides (Ministry of Justice) by quarter, July 2007 – June 2013
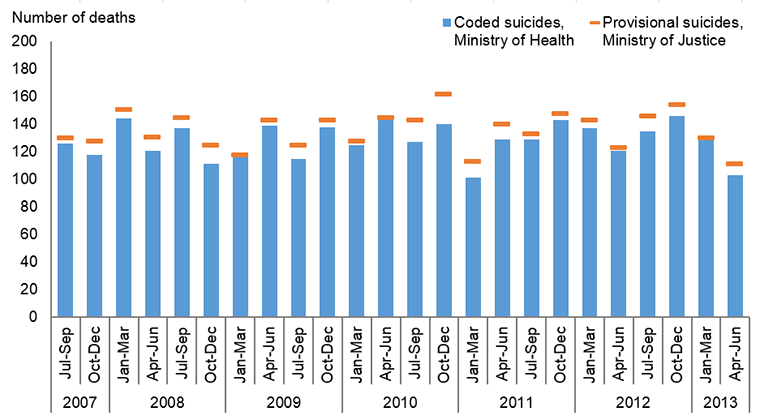
Sources:
Confirmed suicides - New Zealand Mortality dataset
Provisional suicides - Coronial Services of New Zealand, Ministry of Justice
Information about suicide was audited in 2015
In 2015, the Office of the Auditor General (OAG) undertook an audit of the ways in which information about suicide is collected, analysed and used. Among the range of information used to inform the audit, Suicide Facts publications were reviewed. In general, the OAG has commented positively on the ways in which the Ministry of Health presents suicide data, but has made some suggestions to improve the way data is presented and about how information can be released in a more timely and accessible format. Discussions are already underway between the Ministry of Health and Coronial Services of New Zealand, Ministry of Justice, to consider how suicide data can be reported more consistently. While some minor changes have been in made to the 2013 publication, further consideration will be given to suggestions from the audit for future publications in the Suicide Facts series.