
Summary
These tables provide information on mental health and addiction service use for the 2017/18 financial year (1 July 2017 to 30 June 2018) and highlight notable trends between 2008/09 and 2017/18.
The tables include information on mental health and addiction care (services) provided by secondary organisations funded by the Ministry of Health. Specifically, these tables cover: demographic and geographic information, client referral pathways, the types of services provided, the outcome of the services and legal status and diagnosis information.
The tables do not include information on:
- the provision of primary mental health care, such as care provided by general practitioners
- secondary mental health services funded by other government departments e.g. funded by the Ministry of Social Development
- problem gambling
- people with a mental illness who do not access services.
The information was sourced from the Programme for the Integration of Mental Health Data (PRIMHD pronounced ‘primed’). The data was collected by district health boards (DHBs) and non-governmental organisations (NGOs).
Data quality and interpretation notes
The Ministry of Health, DHBs and NGOs are actively engaged in reviewing and improving the quality of PRIMHD data, but because there are some known issues yet to be addressed, numbers should be interpreted and reused with due consideration and care. Although it is not practical to record all known data quality issues, the most important considerations have been detailed below. If you need further detail please contact: [email protected]
Under-reporting of data
Some organisations had breaks in reporting and/or incomplete data in PRIMHD in the 2017/18 year. A few NGOs started and/or stopped reporting during 2017/18 so not all organisations have data for the whole time period.
It is known that Waitematā District Health Board's PRIMHD data is under-reported for the 2017/18 year, so figures may be low in these data tables. For this reason please use Waitematā's data with caution. It is known that some of Hawke's Bay District Health Board's PRIMHD data is over-reported (duplicated) for the 2017/18 year, so figures may be high in these data tables. For this reason please use Hawke's Bay data with caution. Several DHBs had patient management system upgrades in the 2017/18 year which led to some changes in data reporting patterns. The DHBs are MidCentral, Whanganui and Nelson Marlborough.
Coding changes may cause artificial variance and trends
Observed variance and trends may be a result of differences in coding practices across service providers and time, for example, coding changes have influenced the number of crisis contact services reported by some DHBs.
To assist with activity (a synonym for services and care) coding in particular, the Ministry of Health has published ‘Guide to PRIMHD Activity Collection and Use’. We suggest you consult this guide to aid interpretation. A high level description of each of the activity types can also be found within the PRIMHD Codeset. The Guide for Use and the PRIMHD Codeset can be found in the following locations:
Increased NGO reporting will influence trends
In 2008, DHBs began reporting to PRIMHD. In addition, from this date an increasing number of NGOs began reporting to the PRIMHD database. Shifts or patterns in the data after 2008 may reflect the gradual adaptation of non-governmental organisations into the PRIMHD collection in addition to, or instead of, any trend in mental health and addiction service use or outcomes. This point is illustrated by the artificial trend within the chart below in which the crude rate of clients seen by NGOs in 2017/18 was nine times that reported in 2008/09. Although NGO data is still incomplete, the Ministry of Health considers it complete enough for comparison across time from 1 July 2012 onwards.
Number and crude rate of clients seen by NGOs, 2008/09 to 2017/18
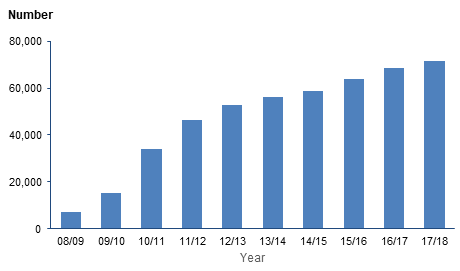
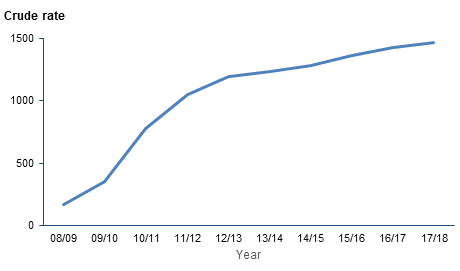
Notes:
- Crude rate is per 100,000 population.
- All organisation types apart from district health boards have been included in the non-governmental organisation category. This includes charitable trusts and a very small number of private hospitals.
Completeness of data for older people
Mental health and addiction services for older people are funded as mental health and addiction services in the Northern and Midland regions. In the Southern and Central regions they are funded as disability support services. PRIMHD mainly captures mental health and addiction services, and occasionally captures data on disability support services. This means data on health care users aged over 65 (including psychogeriatric services) is incomplete.
Data in these tables is not directly comparable to data in other reports
For several reasons the numbers in these tables are not directly comparable with the numbers in the Office of the Director of Mental Health (ODMH) Annual Reports, amongst other reports. The ODMH reports are published for a different purpose and use a slightly different method to identify the report subject matter. Further to this the OMDH reports are for a different time period and occasionally include manual data submitted by DHBs.
Data is continually updated and revised
The Ministry of Health is actively engaged in reviewing and improving the data quality of PRIMHD. PRIMHD is a living data collection, which continues to be revised and updated as data reporting processes are improved. For this reason, previously published data may be liable to amendments. Caveats under each table should be taken into consideration before any comparison is made. The data presented in this edition primarily pertains to information on mental health and addiction care (services) provided in the 2017/18 financial year. Data from 2008/09 to 2016/17 has been re-extracted using the same methods and criteria to provide an up-to-date time-series view.
In particular, there was notable change made to the coding of team types as part of the HISO review of the PRIMHD Codeset. Team type data, extracted before 1 July 2014, should not be compared with the data within these tables.
As noted above, data is not complete in PRIMHD for all organisations for the 2017/18 year so care needs to be taken when using this data.
To function as a national collection, PRIMHD requires integration with a wide range of patient management systems across hundreds of unique service providers. The quality and accuracy of statistical reporting relies on consistent, correct and timely data entry by the services that report to PRIMHD. As the services adjust to PRIMHD, it is expected that the quality of the data will improve.
Key findings
Demographics
In 2017/18, a total of 181,924 clients were seen by mental health and addiction services. Of these, 94,555 (52%) were male, and 87,369 (48%) were female.
Of the ethnic groups reported, Māori were the most likely to be seen by mental health and addiction services, with 7098.9 clients seen for every 100,000 Māori population, while Asian were the least likely to be seen with 1180.0 clients seen for every 100,000 Asian population (these rates have been age-standardised to the World Health Organization (WHO) standard world population).
There were 147,972 clients seen by DHBs and 71,362 clients seen by NGOs. Some of these clients were seen by both DHBs and NGOs.
Of the 181,924 clients seen in 2017/18, the majority (155,218 or 85%) were seen face-to-face. The remaining 15% received services that involved care co-ordination contacts, contact with family/whānau, written correspondence, telephone calls and text messages, social media contacts/e-therapy.
While the rate of non-Māori seen by DHBs has risen in recent years from 1931.5 per 100,000 non-Māori population in 2008/09 to 2840.5 in 2017/18 (a rise of 47%), the rate for Māori seen by DHBs has risen more slowly from 4119.7 per 100,000 Māori population in 2008/09 to 5201.2 in 2017/18 (a rise of 26%).
People living in the most deprived (quintile 5) areas were 2.4 times more likely to be seen by mental health and addiction services than people living in the least deprived (quintile 1) areas (7005.4 per 100,000 population compared to 2870.7 per 100,000 population, age-standardised to the World Health Organization (WHO) standard world population).
Services provided
The most common type of team providing services to DHB clients was community teams, who provided services to 63% of clients seen by DHBs, while the next most common team type was alcohol and drug teams who provided services to 17% of DHB clients. For NGOs, this pattern was similar; the most common team type was community teams, who provided services to 52% of clients seen by NGOs. Alcohol and drug teams were the next most common team type, providing services to 32% of NGO clients.
Activity type
The most common type of activity (or service) provided by DHBs in 2017/18 was ‘individual treatment attendances: family not present’. This activity type accounted for 43% of all DHB services provided. In contrast, the most common type of activity provided by NGOs in 2017/18 was ‘community support contacts’, which accounted for 26% of all NGO services provided.
Long term clients
As at 30 June 2018, there were 34,359 long term clients that were seen by mental health and addiction services for one year or more. Out of these clients, 21,760 were seen for two years or more.
Seclusion
In 2017/18, 947 clients were secluded for a total of 3,272 seclusion events. Seclusion is the placing of a client at any time, and for any duration, alone in a room or area from which they cannot exit.