
This page provides high level suicide information for 2015.
In New Zealand, a death is only officially classified as suicide by the coroner on completion of the coroner’s inquiry. Only those deaths determined as ‘intentionally self-inflicted’ after the inquiry will receive a final verdict of suicide.
This 2015 data is provisional. The Ministry of Health publishes the number of suicides that have been confirmed by the coroner and also those provisionally coded as suicide where there is enough information to suggest the coroner will find the cause of death to be suicide. At the time of data extraction (29 September 2017), there were 10 deaths registered in 2015 that were still subject to coroners’ findings and where the cause of death was not known. Although these deaths are not included in the following data, some may later be classified as suicide.
Key findings
The rate of suicide is highest amongst males and Māori
In 2015, 527 people died by suicide in New Zealand, which equates to an age-standardised rate of 11.1 per 100,000 (Figure 1).
There were 384 male suicides and 143 female suicides (16.4 per 100,000 and 6.1 per 100,000 respectively). For every female suicide there were 2.7 male suicides (Figure 2).
Figure 1. Suicide deaths and age-standardised suicide rates, 2006–2015
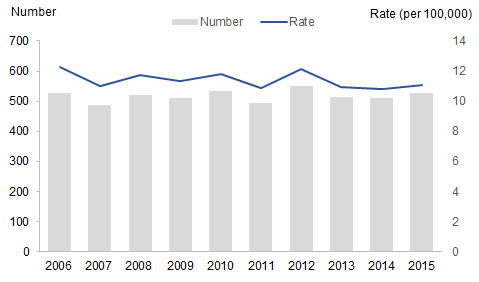
Source: New Zealand Mortality Collection
Figure 2. Age-standardised suicide rates, by sex, 2006–2015
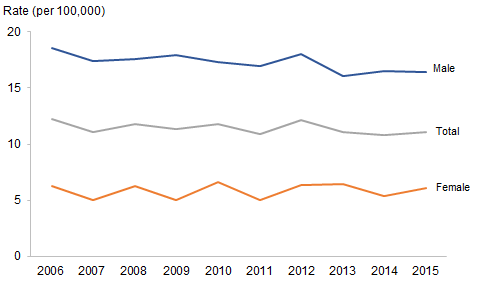
Source: New Zealand Mortality Collection
In 2015, the highest rate of suicide was among youth aged 15–24 years (16.9 per 100,000). The rate for youth suicide in 2015 is still among the lowest for this age group in the ten year period, 2006–2015. (Figure 3).
Figure 3. Suicide rates, by life-stage age group (years), 2006–2015
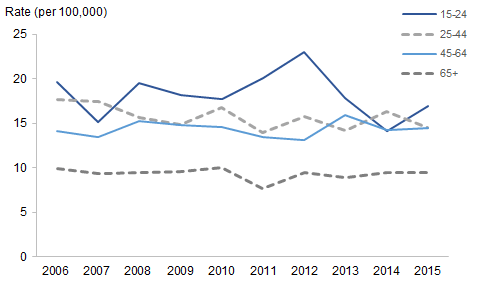
Source: New Zealand Mortality Collection
In 2015, the rate of suicide among Māori was higher than among non-Māori for both males and females.
Among Māori males the suicide rate was 25.3 per 100,000; 1.7 times that of non-Māori. For Māori females, the suicide rate was 2.4 times that of non-Māori females (Figure 4).
Figure 4. Age-standardised suicide rates, for Māori and non-Māori, by sex, 2006–2015
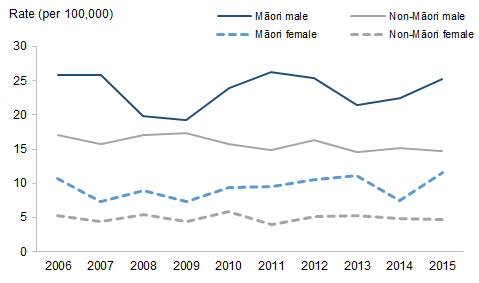
Source: New Zealand Mortality Collection
The rate of suicide has remained relatively stable in the 10-year period to 2015
Over the 10-year period 2006–2015, the rate of suicide has remained relatively stable year to year.
Overall the rate of suicide has decreased slightly from the peak for this period of 12.2 per 100,000 (526 deaths) in 2006 to 11.1 per 100,000 (527 deaths) in 2015.
Similar to the overall rate, the suicide rate for males has also generally decreased over this period. Over these 10 years, the rate for males has been at least 2.5 times that for females.
Over the last 10 years the rate of youth suicide has been variable (ranging from 14.1 per 100,000 to 23.0 per 100,000), predominantly higher than the other life-stage age groups.
A table of data containing provisional numbers and rates of suicide by sex and ethnic group (2006–2015) can be found in the downloadable file.