
Please note that the private hospital data included in this report is not complete, as not all private hospitals report their data to the Ministry of Health.
Published online:
30 June 2015
Summary
These tables contain national data detailing the number of privately funded discharges, diagnoses and numbers of procedures carried out in both private and public hospitals. An additional spreadsheet containing the same data in machine readable and pivot table formats is also provided.
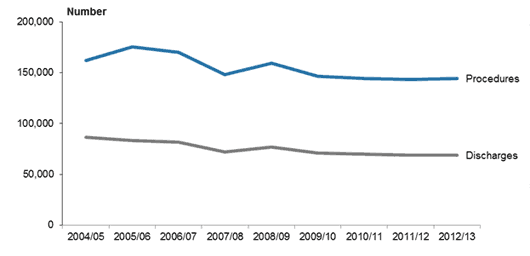
Number of privately funded discharges and procedures in New Zealand hospitals, 2004/05 to 2012/13
Privately funded hospital discharges
- Almost 70,000 privately funded discharges were made from New Zealand hospitals in 2012/13. This equates to 13.1 hospitalisations per 1000 people.
- Just over a quarter (28.2%) of hospitalisations in 2012/13 were for people aged 65 and over.
- Each year more females than males are discharged from New Zealand hospitals. For every 100 female hospitalisations there were 81 male hospitalisations in 2012/13.
- For males, the highest hospitalisation rate was for those 85 years and over. For females, the highest rate was for those aged 70–74 years. Females had higher hospitalisation rates than males over the child-bearing years, although this increase was not as pronounced compared to publicly funded hospitalisations.
- Compared with 2011/12, there were 54 fewer privately funded discharges in 2012/13.
- Between 2004/05 and 2012/13, the number of privately funded hospitalisations decreased by 20.9% - around 2000 fewer discharges every year.
Privately funded hospital procedures
- Over 144,000 privately funded procedures were performed in New Zealand hospitals in 2012/13. This equates to 27.9 procedures per 1000 people.
- A quarter (25.4%) of procedures were performed on people aged 65 and over in 2012/13.
- Each year more procedures are performed on females than males. For every 100 procedures performed on females there were 77 performed on males in 2012/13.
- Females aged 10 to 59 had higher procedure rates than males. For all other age groups males had higher procedure rates in 2012/13.
- Compared with 2011/12, there were 1149 fewer privately funded procedures in 2012/13.
- The number of privately funded hospital procedures decreased by 11.1% from 2004/05 to 2012/13 - around 2000 fewer procedures every year.