
Summary
This web page presents key findings about the employment of new graduate nurses through district health boards (DHBs). The statistics come from the Nursing Advanced Choice of Employment (ACE) system, a national system utilised by DHBs to recruit new graduate nurses into supported first year of practice programmes. These programmes are known as nurse entry to practice (NETP) and nurse entry to specialty practice (mental health) (NESP). Many DHBs partner with local primary care and aged care providers to deliver these programmes.
The nursing ACE system enables graduates to apply online to multiple district health boards (DHBs) using one application. Graduates also identify up to three preferred practice settings including those that may not be provided by DHBs such as primary care and aged residential care. DHBs use the system to review the applications of those graduates who identified them as a preferred employer. DHBs can also supply local primary care and aged care providers with the applications of graduates who preferred those settings. DHBs and potential employers in primary care and aged care conduct their own shortlisting process and then notify the nursing ACE system of their preferred candidates. The system then finds the best match between the graduates’ preference for employer and the DHBs’ preference for graduates.
The nursing ACE system was piloted for the first time with November 2012 graduates and the 20 DHBs. It has been approved by the DHBs for use for a further two years, during which time it will be evaluated further and enhanced.
The ACE system has for the first time allowed the Ministry of Health to gather national information on the recruitment of new graduates into entry to practice programmes. It is important to note this information does not cover all graduate nurses who gain employment. Graduates are also able to apply, outside the ACE system, for positions not associated with an entry to practice programme. These positions may be in areas such as private and aged care providers, and in primary health care settings.
If you have any queries about the information presented on this web page, please email: [email protected]
Overview
This section summarises key findings from the data gained from the November 2012 pilot of the nursing ACE system:
- key highlights
- analysis
- graduate nurses’ preferences work in clinical practice settings
- graduate nurses’ preferences to work by region
- positions available for graduate nurses in each district health board
- district health boards’ preferences for graduates
- graduate nurses’ success in obtaining positions by educational institute
- graduate nurses reflecting the demography of the population
- employment of November 2012 graduates
- future focus
Key highlights
- In December 2012, one month after finishing their Bachelor of Nursing degree, 723 new graduate nurses had jobs and were in NETP or NESP programmes. This compares favourably with the 637 graduates from November 2011 who had jobs and were in NETP or NESP programmes in March 2012, four months after finishing their Bachelor of Nursing degree.
- 97 percent of successful graduates obtained a position in either their first or second choice DHB: 89 percent in their first choice DHB and 8 percent in their second choice DHB.
Analysis
The information presented is based on the 1232 graduates who applied and the 686 graduates who were successful in obtaining positions in the first recruitment round. An additional 37 graduates were successful in the second round, but these were manually matched to positions, and their employment data is not included in the electronic tables used for this analysis.
Graduate nurses’ preferences to work in clinical practice settings
It is important to understand which clinical practice settings graduates want to work in compared with current and future workforce needs in those settings. Graduates applying for positions using the nursing ACE system are able to identify up to three clinical practice settings in which they would prefer to work. The table below details the preferred clinical practice settings of the new graduates.
| Preferred clinical practice settings of new graduates | |||||||
|---|---|---|---|---|---|---|---|
| Clinical Practice setting | 1st choice | 2nd choice | 3rd choice | Total who chose | % who chose as 1st choice setting | %who chose as a setting | % of RN workforce in practice setting NCNZ 2011[1] |
| Surgery | 268 | 265 | 141 | 674 | 21.75 | 18.23 | 9.48 |
| Medical | 179 | 227 | 201 | 607 | 14.52 | 16.42 | 7.49 |
| Mental Health and addictions | 142 | 33 | 51 | 226 | 11.52 | 6.11 | 7.97 |
| Paediatrics / child health /youth health | 118 | 88 | 70 | 276 | 9.57 | 7.46 | 5.07[2] |
| Emergency & trauma | 110 | 85 | 93 | 288 | 8.92 | 7.79 | 3.85 |
| Primary Health care including practice Nursing, Iwi Providers, School Nursing, Hospice | 109 | 95 | 105 | 309 | 8.84 | 8.36 | 11.46[3] |
| Perioperative care ( Theatre ) | 95 | 61 | 55 | 211 | 7.71 | 5.7 | 6.04 |
| Cardiac care includes Coronary care units, cardiothoracic | 50 | 63 | 69 | 182 | 4.05 | 4.92 | 3.92[4] |
| Intensive care-includes high dependency | 34 | 49 | 52 | 135 | 2.75 | 3.65 | |
| Neonatal | 31 | 42 | 23 | 96 | 2.59 | 2.58 | |
| Assessment, Treatment & Rehabilitation | 29 | 52 | 71 | 152 | 2.35 | 4.11 | 2.40 |
| Health of Older People within the DHB | 13 | 16 | 47 | 76 | 1.05 | 2.05 | |
| Aged residential care | 7 | 14 | 28 | 49 | 0.56 | 1.32 | 6.78[5] |
| Oncology | 18 | 29 | 34 | 81 | 1.46 | 2.19 | |
| Public Health Nursing | 16 | 32 | 43 | 91 | 1.29 | 2.46 | 1.12 |
| District nursing | 13 | 33 | 39 | 85 | 1.05 | 2.29 | 2.23 |
| Blank (did not identify a 2or 3 choice) | 48 | 110 | 158 | 4.27 | |||
| TOTAL | 1232 | 1232 | 1232 | 3696 | 99.9 | 99.91 | |
- [1] Note that where the ACE practice setting options and the Nursing Council of New Zealand (NCNZ) practice area option do not correspond exactly a footnote explains what practice areas have been used for this comparison. Where a percentage is not provided the NCNZ data does not allow for a suitable comparison.
- [2] Based on NCNZ data for registered nurses working in child health & youth health
- [3] Based on NCNZ data for registered nurses working in practice nursing, primary health care, school nursing and palliative care.
- [4] Based on NCNZ data for registered nurses working in intensive care / cardiac care
- [5] Based on NCNZ data for registered nurses working in continuing care.
Key points
- The clinical practice settings graduates most frequently identified as their first choice were:
- surgery
- medicine
- mental health and addictions.
- Government priority settings include primary care, aged care and mental health.
- The need for RNs in primary health care is expected to grow as health services move closer to home. Primary health care (including practice nursing, Iwi providers, school nursing, and hospice) was the first choice work setting of 9 percent of graduates compared with 11 percent in the current RN workforce.
- The Nursing Council of New Zealand cohort study indicates the percentage of graduates still working in surgical and medical settings after three to six years is likely to decline significantly as they move into other settings, including primary health care where there is likely to be a notable increase.
- Mental health and addictions was the third most popular preferred clinical practice setting. This is important because mental health and addictions has been viewed as hard to staff and there has been long-term concern about the number of nurses wanting to work in mental health.
- Based on the Nursing Council of NZ cohort study, it seems that if graduates start their work in mental health and addictions, they are likely to remain within those settings for at least six years.
- Aged care (incorporating aged residential care, health of older people provided by DHBs and assessment, treatment and rehabilitation) was the first choice work setting of 4 percent of graduates - currently 9 percent of the current RN workforce work in aged care.
- Numerous factors may influence graduates’ preferences for particular clinical practice settings including curriculum, clinical experience, availability of positions etc. Further exploration is needed to understand the factors influencing graduates’ preferences.
Graduate nurses’ preferences to work by region
It is important to understand how mobile the nursing graduates are and in what regions they want to work so the supply of graduate nurses can be planned to meet future workforce needs in the regions. The table below shows the number of graduates from local and non-local educational institutes who identified each DHB as their most preferred employer.
| DHB | Number of applicants from local educational institutes who identified the DHB as their first choice | Number of applicants from other educational institutes who identified the DHB as their first choice |
|---|---|---|
| Auckland | 128 | 31 |
| Bay of Plenty | 60 | 16 |
| Canterbury | 72 | 15 |
| Capital & Coast | 97 | 30 |
| Counties Manukau | 120 | 9 |
| Hawke’s Bay | 38 | 10 |
| Hutt Valley | 42 | 9 |
| Lakes | 39 | 3 |
| MidCentral | 55 | 2 |
| Nelson Marlborough | 28 | 13 |
| Northland | 39 | 2 |
| South Canterbury | 0 | 7 |
| Southern | 78 | 4 |
| Tairawhiti | 17 | 2 |
| Taranaki | 25 | 7 |
| Waikato | 92 | 19 |
| Wairarapa | 14 | 0 |
| Waitemata | 71 | 10 |
| West Coast | 0 | 5 |
| Whanganui | 19 | 4 |
Key points
- Graduate nurses preferred to work in their local region.
- 46 percent (571) of the graduates applied for positions only in district health boards (DHBs) in the region in which they trained, despite being able to apply for positions in up to four DHBs.
- This data shows graduates are mainly choosing their local DHB as their preferred employer and therefore DHBs are predominantly reliant on the tertiary educational institutes in their region to supply graduates.
Positions available for graduate nurses in each district health board
It is important for employers to plan for the succession of their aging nursing workforce and to ensure a safe balance of new and experienced staff. The mix of new graduates and experienced staff in a workforce is important for ensuring an appropriate skill mix. The table below shows the number of positions for graduate nurses in each DHB relative to the size of the DHBs existing registered nurse workforce.
| DHB | Number of positions for graduate nurses | Contracted RN FTE [6] | Ratio of graduate positions to contracted RN FTE |
|---|---|---|---|
| Tairawhiti | 14 | 227 | 16 |
| Nelson Marlborough | 27 | 496 | 18 |
| West Coast | 13 | 252 | 19 |
| Whanganui | 14 | 295 | 21 |
| Waikato | 78 | 1,860 | 24* (17) |
| Taranaki | 17 | 409 | 24 |
| South Canterbury | 10 | 244 | 24 |
| Capital & Coast | 64 | 1,563 | 24* (19) |
| Bay of Plenty | 34 | 837 | 25 |
| Southern | 50 | 1,234 | 25 |
| Waitemata | 75 | 1,867 | 25* (18) |
| Hutt Valley | 21 | 564 | 27 |
| Canterbury | 87 | 2,438 | 28* (16) |
| Lakes | 13 | 367 | 28* (22) |
| Hawke’s Bay | 22 | 639 | 29 |
| Counties Manukau | 65 | 1,992 | 31* (17) |
| MidCentral | 22 | 754 | 34 |
| Northland | 20 | 737 | 37* (19) |
| Auckland | 58 | 2,508 | 43* (19) |
| Wairarapa | 3 | 154 | 51 |
| Total/Mean | 707 | 19,437 | 27 |
- [6] RN FTE data supplied by DHB Shared Services
Key points
- Variation in the ratio of graduate positions to contracted RN FTE may be explained by differences in the type of services provided, existing skills mix and turnover in DHBs’ RN workforce.
- The ideal ratio would provide an appropriate skill mix, take account of staff turnover, patient need and the projected needs of an aging and growing population, an aging workforce and changing models of care. More work is needed to establish, however, what the ideal ratio is in various settings.
- There is variability in the number of vacancies in each DHB relative to the size of the DHB’s RN workforce. More work needs to be done on the factors influencing vacancy rates.
DHBs’ preferences for graduates
DHBs invest in supporting and mentoring local nursing students during their clinical experience.
| District Health Board | Percentage of successful applicants who trained at a local educational institute and did their final clinical placement with the DHB |
|---|---|
| MidCentral | 100% |
| Taranaki | 94% |
| Whanganui | 93% |
| Lakes | 92% |
| Northland | 89% |
| Southern | 86% |
| Hawke’s Bay | 82% |
| Counties Manukau | 82% |
| Auckland | 78% |
| Bay of Plenty | 75% |
| Canterbury | 74% |
| Hutt Valley | 71% |
| Tairawhiti | 71% |
| Nelson Marlborough | 70% |
| Capital & Coast | 69% |
| Waikato | 68% |
| Wairarapa | 67% |
| South Canterbury | 50% |
| Waitemata | 39% |
| West Coast | 0% |
Key points
-
Most DHBs tended to employ graduates who both trained at a local educational institute and undertook their final clinical placement with that DHB.
-
Notable exceptions are South Canterbury, West Coast and Waitemata DHBs. South Canterbury and West Coast draw graduates from South Island polytechnics and they had few or no graduates from those institutes doing their final clinical placement with them.
Graduate nurses’ success in obtaining positions by education institute
Understanding the factors that influence new graduates success in obtaining work as a registered nurse will help improve the employment of new graduates. The table below shows for each educational institute the percentage of graduates who obtained a position.
- Note: Where DHBs have a relatively high ratio of vacancies to applicants then graduates from the associated educational institute tend to have relatively high success rates in obtaining positions. Conversely where DHBs have a relatively low ratio of vacancies to applicants then graduates from the associated educational institute tend to have relatively low success rates in obtaining positions.
| Education Institute | Percentage of applicants who obtained positions in the first round | Ratio of vacancies to graduate applicants in DHBs linked to the educational institute |
|---|---|---|
| Christchurch Polytechnic Institute of Technology | 81% | 1.00 Canterbury |
| Nelson Marlborough Institute of Technology | 70% | 0.66 Nelson Marlborough |
| Otago Polytechnic | 65% | 0.61 Southern |
| Auckland University of Technology | 64% | 0.55 Auckland & Waitemata |
| Massey University (Wellington) | 63% | 0.47 Capital & Coast & Hutt Valley |
| Massey University (Manawatu) | 61% | 0.39 MidCentral |
| University of Auckland | 60% | 0.54 Auckland, Waitemata & Counties Manukau |
| Southern Institute of Technology | 59% | 0.66 Southern |
| Western Institute of Technology at Taranaki | 57% | 0.53 Taranaki |
| Waikato Institute of Technology | 54% | 0.70 Waikato |
| Eastern Institute of Technology | 53% | 0.54 Hawke’s Bay & Tairawhiti |
| Manukau Institute of Technology | 50% | 0.5 Counties Manukau |
| Whitireia Community Polytechnic | 47% | 0.47 Capital & Coast & Hutt Valley |
| NorthTec | 45% | 0.49 Northland |
| Waiariki Institute of Technology | 44% | 0.39 Bay of Plenty & Lakes |
| Universal College of Learning | 41% | 0.41 MidCentral, Wairarapa & Whanganui |
| Unitec Institute of Technology | 40% | 0.55 Auckland & Waitemata |
| Total Applications for first round | 56% (59% including second round) | 0.57 All |
Key points
- The availability of positions for new graduates in the regions in which graduates want to work appears to be the main influence on graduates’ success in obtaining positions.
- The percentage of graduates from each educational institute obtaining positions through the nursing ACE system ranged from 40 to 81 percent. This should not be read as a league table of educational institutes because much of the difference between educational institutes can be attributed to the availability of positions in the local DHBs for the number of graduates from the educational institute.
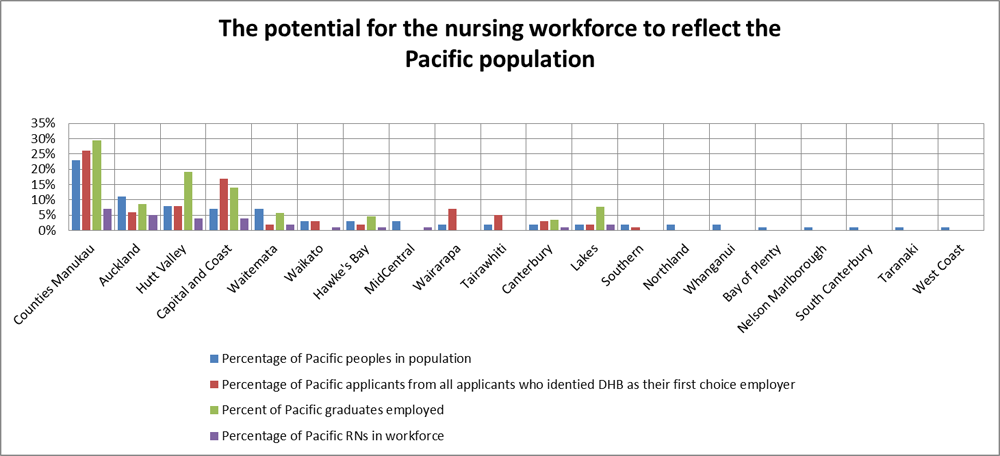
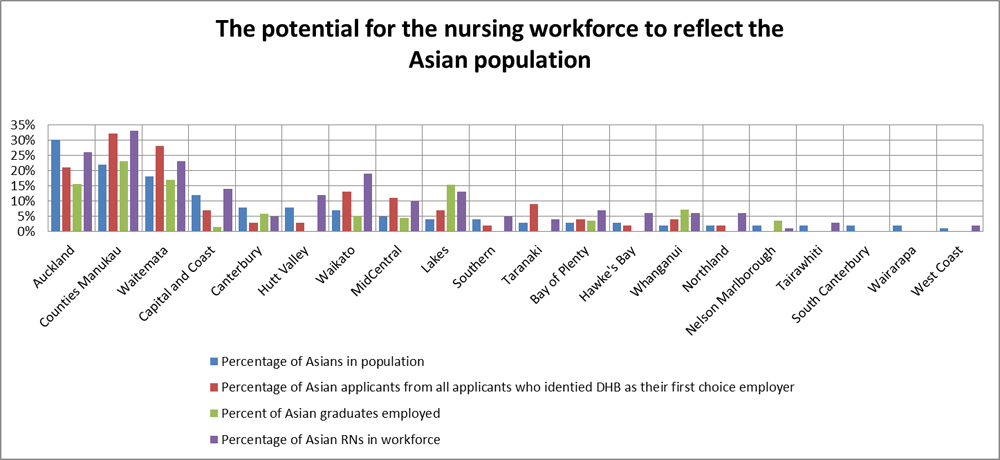
Graduate nurses reflecting the demography of the population
The information below helps us to understand how the nursing workforce reflect population demographics. The first graph below shows for each DHB the percentage of Māori in the population, the percentage of Māori graduates who identified the DHB as their first choice, the percentage of Māori graduates employed and the percentage of Māori RNs in the workforce. The next two graphs present the same information for Pacific and Asian ethnicities.
The potential for the nursing workforce to reflect the Māori population
Click image to enlarge

The potential for the nursing workforce to reflect the Pacific population
Click image to enlarge
The potential for the nursing workforce to reflect the Asian population
Click image to enlarge
Key points
- Māori and Pacific graduates identifying each DHB as their preferred employer represent an opportunity for the workforce to better reflect the demography of the population (see the blue and red bars respectively in comparison to the purple bar on the graphs above).
- The limited number of positions available for graduates who predominantly want to work in local DHBs, has resulted in Māori and Pacific graduates without jobs in DHBs who have a large gap between the demography of the Māori and Pacific population and the demography of the RN workforce.
Employment of November 2012 graduates
- 59 percent of graduates had employment in a supported first year of practice within a month of finishing their degree.
- While the ACE system currently does not allow an update on employment for graduates beyond the one month point, there is a long-standing survey of graduates which provides details of further employment. This showed that 75 percent of November 2012 Bachelor of Nursing graduates were known to be employed as registered nurses by March 2013, four months after finishing their Bachelor of Nursing degree.
- New Zealand compares favourably to other countries, including some areas of Australia and the United States, for nursing graduates finding work as RNs.
- The Australian Nursing Federation has reported that only 10 percent of graduate applicants were initially offered jobs with Queensland Health last year and only 30 percent were offered state health service jobs in Tasmania.
- In the United States, a survey by the American Society of Registered Nurses found 43 percent of Californian graduates had not found jobs 18 months after graduation.
Future focus
The ACE system has provided information that has never been able to be consistently gathered before concerning employment of graduate nurses. It is thus a valuable tool for the sector in areas such as training, and future workforce planning.
Below are some of the key focus areas informed by the first year of ACE data.
- Ensuring as many graduates as possible find placement as soon as possible.
- Improving the availability of supported positions for graduates within aged care and improving the appeal of aged care to graduates.
- Aligning the number of graduates and positions for graduates to workforce needs in each region.
- Improving the number of Māori and Pacific graduates gaining employment in regions with high Māori and Pacific populations.