Data on the number of people who have received gambling harm treatment services and have identified a primary problem gambling mode causing them harm.
The data available represents a snapshot at a point in time. The reported statistics are subject to slight variation as the Ministry updates client data elements in accordance with the data collection and submission rules required of treatment service providers.
Table 1: Total Clients Recorded (All Interventions)
Total Clients
New Clients
Existing Clients *
Increase from previous year
Percentage increase from previous year
July 2004 to June 2005
3243
2299
944
-
-
July 2005 to June 2006
3702
2558
1144
459
14.2%
July 2006 to June 2007
5295
3775
1520
1593
43.0%
July 2007 to June 2008
5710
4027
1683
415
7.8%
July 2008 to June 2009
9743
7552
2191
4033
70.6%
July 2009 to June 2010
13244
10498
2746
3501
35.9%
July 2010 to June 2011
12090
9111
2979
-1154
-8.7%
July 2011 to June 2012
11847
9003
2844
-243
-2.0%
July 2012 to June 2013
12438
9263
3175
591
5.0%
July 2013 to June 2014
12627
9235
3392
189
1.5%
July 2014 to June 2015
12741
9579
3162
114
0.9%
July 2015 to June 2016
12420
9214
3206
-321
-2.5%
July 2016 to June 2017
11609
8329
3280
-811
-6.5%
July 2017 to June 2018
10555
7440
3115
-1054
-9.1%
July 2018 to June 2019
10602
7804
2798
47
0.4%
July 2019 to June 2020
9502
6627
2875
-1100
-10.4%
July 2020 to June 2021
10946
8261
2685
1444
15.2%
July 2021 to June 2022
9683
6773
2910
-1263
-11.5%
July 2022 to June 2023
10386
7714
2672
703
7.3%
{"id":"graph-594b189a067d6","type":"c3","legend":["Total Clients","New Clients","Existing Clients *"],"rows":[["July 2004 to June 2005","3243","2299","944"],["July 2005 to June 2006","3702","2558","1144"],["July 2006 to June 2007","5295","3775","1520"],["July 2007 to June 2008","5710","4027","1683"],["July 2008 to June 2009","9743","7552","2191"],["July 2009 to June 2010","13244","10498","2746"],["July 2010 to June 2011","12090","9111","2979"],["July 2011 to June 2012","11847","9003","2844"],["July 2012 to June 2013","12438","9263","3175"],["July 2013 to June 2014","12627","9235","3392"],["July 2014 to June 2015","12741","9579","3162"],["July 2015 to June 2016","12420","9214","3206"],["July 2016 to June 2017","11609","8329","3280"],["July 2017 to June 2018","10555","7440","3115"],["July 2018 to June 2019","10602","7804","2798"],["July 2019 to June 2020","9502","6627","2875"],["July 2020 to June 2021","10946","8261","2685"],["July 2021 to June 2022","9683","6773","2910"],["July 2022 to June 2023","10386","7714","2672"]],"rows_c3":[["Total Clients","New Clients","Existing Clients *"],["3243","2299","944"],["3702","2558","1144"],["5295","3775","1520"],["5710","4027","1683"],["9743","7552","2191"],["13244","10498","2746"],["12090","9111","2979"],["11847","9003","2844"],["12438","9263","3175"],["12627","9235","3392"],["12741","9579","3162"],["12420","9214","3206"],["11609","8329","3280"],["10555","7440","3115"],["10602","7804","2798"],["9502","6627","2875"],["10946","8261","2685"],["9683","6773","2910"],["10386","7714","2672"]],"categories":["July 2004 to June 2005","July 2005 to June 2006","July 2006 to June 2007","July 2007 to June 2008","July 2008 to June 2009","July 2009 to June 2010","July 2010 to June 2011","July 2011 to June 2012","July 2012 to June 2013","July 2013 to June 2014","July 2014 to June 2015","July 2015 to June 2016","July 2016 to June 2017","July 2017 to June 2018","July 2018 to June 2019","July 2019 to June 2020","July 2020 to June 2021","July 2021 to June 2022","July 2022 to June 2023"],"attributes":{"class":"d3graph","data-graph-desc":"This graph shows the change in clients assisted over time. There is a slow increase in existing clients over time. In 2008\/09 and 2009\/10 there is a large increase in new clients, which stabilises in the following years. The data is available in the table below. ","data-graph-render":"line","data-graph-type":"c3","data-graph-xaxis-height":"90","data-graph-xaxis-label":"Year","data-graph-xaxis-rotation":"-45","data-graph-yaxis-label":"Number of clients","data-graph-yaxis-max":"20000","id":"594b189a067d6"}}
*Existing Clients - Clients who have accessed a service in a previous year.
Total Clients Recorded (Excluding Brief Interventions)
Total Clients
New Clients
Existing Clients *
Increase from previous year
Percentage increase from previous year
Table 2: Total Clients Recorded (Excluding Brief Interventions)
July 2004 to June 2005
3237
2293
944
-
-
July 2005 to June 2006
3329
2194
1135
92
2.8%
July 2006 to June 2007
4271
2786
1485
942
28.3%
July 2007 to June 2008
4441
2834
1607
170
4.0%
July 2008 to June 2009
6015
3854
2161
1574
35.4%
July 2009 to June 2010
6367
3637
2730
352
5.9%
July 2010 to June 2011
6133
3180
2953
-234
-3.7%
July 2011 to June 2012
6218
3406
2812
85
1.4%
July 2012 to June 2013
6931
3796
3135
713
11.5%
July 2013 to June 2014
7200
3883
3317
269
3.9%
July 2014 to June 2015
7211
4123
3088
11
0.2%
July 2015 to June 2016
6596
3526
3070
-615
-8.5%
July 2016 to June 2017
6271
3162
3109
-325
-4.9%
July 2017 to June 2018
5457
2526
2931
-814
-13.0%
July 2018 to June 2019
4856
2327
2529
-601
-11.0%
July 2019 to June 2020
4439
1952
2487
-417
-8.6%
July 2020 to June 2021
4762
2311
2451
323
7.3%
July 2021 to June 2022
4534
1844
2690
-228
-4.8%
July 2022 to June 2023
4411
2171
2240
-123
-2.7%
{"id":"graph-594c82b5ca3b2","type":"c3","legend":["Total Clients","New Clients","Existing Clients *"],"rows":[["July 2004 to June 2005","3237","2293","944"],["July 2005 to June 2006","3329","2194","1135"],["July 2006 to June 2007","4271","2786","1485"],["July 2007 to June 2008","4441","2834","1607"],["July 2008 to June 2009","6015","3854","2161"],["July 2009 to June 2010","6367","3637","2730"],["July 2010 to June 2011","6133","3180","2953"],["July 2011 to June 2012","6218","3406","2812"],["July 2012 to June 2013","6931","3796","3135"],["July 2013 to June 2014","7200","3883","3317"],["July 2014 to June 2015","7211","4123","3088"],["July 2015 to June 2016","6596","3526","3070"],["July 2016 to June 2017","6271","3162","3109"],["July 2017 to June 2018","5457","2526","2931"],["July 2018 to June 2019","4856","2327","2529"],["July 2019 to June 2020","4439","1952","2487"],["July 2020 to June 2021","4762","2311","2451"],["July 2021 to June 2022","4534","1844","2690"],["July 2022 to June 2023","4411","2171","2240"]],"rows_c3":[["Total Clients","New Clients","Existing Clients *"],["3237","2293","944"],["3329","2194","1135"],["4271","2786","1485"],["4441","2834","1607"],["6015","3854","2161"],["6367","3637","2730"],["6133","3180","2953"],["6218","3406","2812"],["6931","3796","3135"],["7200","3883","3317"],["7211","4123","3088"],["6596","3526","3070"],["6271","3162","3109"],["5457","2526","2931"],["4856","2327","2529"],["4439","1952","2487"],["4762","2311","2451"],["4534","1844","2690"],["4411","2171","2240"]],"categories":["July 2004 to June 2005","July 2005 to June 2006","July 2006 to June 2007","July 2007 to June 2008","July 2008 to June 2009","July 2009 to June 2010","July 2010 to June 2011","July 2011 to June 2012","July 2012 to June 2013","July 2013 to June 2014","July 2014 to June 2015","July 2015 to June 2016","July 2016 to June 2017","July 2017 to June 2018","July 2018 to June 2019","July 2019 to June 2020","July 2020 to June 2021","July 2021 to June 2022","July 2022 to June 2023"],"attributes":{"class":"d3graph","data-graph-desc":"This graph shows the change in clients assisted over time, excluding brief interventions. There is an increase in existing and new clients over time. The data is available in the table below. ","data-graph-render":"line","data-graph-type":"c3","data-graph-xaxis-height":"90","data-graph-xaxis-label":"Year","data-graph-xaxis-rotation":"-45","data-graph-yaxis-label":"Number of clients","data-graph-yaxis-max":"10000","id":"594c82b5ca3b2"}}
* Existing Clients - Clients who have accessed a service in a previous year.
Clients that received only brief intervention services are excluded from this graph. Brief Intervention services are aimed at people who are at risk of gambling harm but are not actively seeking help. Further details about intervention types are available: Preventing and Minimising Gambling Harm: Practitioner’s Guide.
Please note that a direct comparison between the July 2004–June 2008 & July 2008-present data has limitations for the following reasons:
new service specifications for problem gambling intervention service providers were implemented from January 2008
equivalent intervention services provided by the Gambling Helpline have been included in the data since November 2008.
Clients Assisted, by Ethnicity (All Interventions)
Table 3: Clients Assisted, by Ethnicity (All Interventions)
Asian**
Māori
Other*
Pacific
Total
July 2004 to June 2005
# of Clients
119
874
2029
221
3243
% of Clients
3.7%
26.9%
62.6%
6.8%
100%
July 2005 to June 2006
# of Clients
183
1153
2110
255
3702
% of Clients
4.9%
31.2%
57.0%
6.9%
100%
July 2006 to June 2007
# of Clients
275
1898
2790
332
5295
% of Clients
5.2%
35.9%
52.7%
6.3%
100%
July 2007 to June 2008
# of Clients
319
2205
2818
368
5710
% of Clients
5.6%
38.6%
49.4%
6.5%
100%
July 2008 to June 2009
# of Clients
518
3599
4891
734
9743
% of Clients
5.3%
36.9%
50.2%
7.5%
100%
July 2009 to June 2010
# of Clients
1153
3651
7251
1189
13244
% of Clients
8.7%
27.6%
54.7%
9.0%
100%
July 2010 to June 2011
# of Clients
1009
3590
5741
1749
12090
% of Clients
8.3%
29.7%
47.5%
14.5%
100%
July 2011 to June 2012
# of Clients
977
4092
4932
1846
11847
% of Clients
8.2%
34.5%
41.6%
15.6%
100%
July 2012 to June 2013
# of Clients
735
4317
5097
2289
12438
% of Clients
5.9%
34.7%
41.0%
18.4%
100%
July 2013 to June 2014
# of Clients
712
4564
4852
2499
12627
% of Clients
5.6%
36.1%
38.4%
19.8%
100%
July 2014 to June 2015
# of Clients
1005
4457
4586
2693
12741
% of Clients
7.9%
35.0%
36.0%
21.1%
100%
July 2015 to June 2016
# of Clients
1347
4246
4485
2342
12420
% of Clients
10.8%
34.2%
36.1%
18.9%
100%
July 2016 to June 2017
# of Clients
929
4273
4220
2187
11609
% of Clients
8.0%
36.8%
36.4%
18.8%
100%
July 2017 to June 2018
# of Clients
1044
3720
3779
2012
10555
% of Clients
9.9%
35.2%
35.8%
19.1%
100%
July 2018 to June 2019
# of Clients
951
3594
4134
1923
10602
% of Clients
9.0%
33.9%
39.0%
18.1%
100%
July 2019 to June 2020
# of Clients
937
3041
3627
1897
9502
% of Clients
9.9%
32.0%
38.2%
20.0%
100%
July 2020 to June 2021
# of Clients
1721
3548
3839
1838
10946
% of Clients
15.7%
32.4%
35.1%
16.8%
100%
July 2021 to June 2022
# of Clients
1535
3107
3315
1726
9683
% of Clients
15.9%
32.1%
34.2%
17.8%
100%
July 2022 to June 2023
# of Clients
1490
3390
3352
2154
10386
% of Clients
14.3%
32.6%
32.3%
20.7%
100%
{"id":"graph-594b2990bfb2f","type":"c3","legend":["Asian**","M\u0101ori","Other*","Pacific"],"rows":[["July 2004 to June 2005","# of Clients","119","874","2029","221"],[],["July 2005 to June 2006","# of Clients","183","1153","2110","255"],[],["July 2006 to June 2007","# of Clients","275","1898","2790","332"],[],["July 2007 to June 2008","# of Clients","319","2205","2818","368"],[],["July 2008 to June 2009","# of Clients","518","3599","4891","734"],[],["July 2009 to June 2010","# of Clients","1153","3651","7251","1189"],[],["July 2010 to June 2011","# of Clients","1009","3590","5741","1749"],[],["July 2011 to June 2012","# of Clients","977","4092","4932","1846"],[],["July 2012 to June 2013","# of Clients","735","4317","5097","2289"],[],["July 2013 to June 2014","# of Clients","712","4564","4852","2499"],[],["July 2014 to June 2015","# of Clients","1005","4457","4586","2693"],[],["July 2015 to June 2016","# of Clients","1347","4246","4485","2342"],[],["July 2016 to June 2017","# of Clients","929","4273","4220","2187"],[],["July 2017 to June 2018","# of Clients","1044","3720","3779","2012"],[],["July 2018 to June 2019","# of Clients","951","3594","4134","1923"],[],["July 2019 to June 2020","# of Clients","937","3041","3627","1897"],[],["July 2020 to June 2021","# of Clients","1721","3548","3839","1838"],[],["July 2021 to June 2022","# of Clients","1535","3107","3315","1726"],[],["July 2022 to June 2023","# of Clients","1490","3390","3352","2154"],[]],"rows_c3":[["Asian**","M\u0101ori","Other*","Pacific"],["119","874","2029","221"],[],["183","1153","2110","255"],[],["275","1898","2790","332"],[],["319","2205","2818","368"],[],["518","3599","4891","734"],[],["1153","3651","7251","1189"],[],["1009","3590","5741","1749"],[],["977","4092","4932","1846"],[],["735","4317","5097","2289"],[],["712","4564","4852","2499"],[],["1005","4457","4586","2693"],[],["1347","4246","4485","2342"],[],["929","4273","4220","2187"],[],["1044","3720","3779","2012"],[],["951","3594","4134","1923"],[],["937","3041","3627","1897"],[],["1721","3548","3839","1838"],[],["1535","3107","3315","1726"],[],["1490","3390","3352","2154"],[]],"categories":["July 2004 to June 2005","# of Clients","July 2005 to June 2006","# of Clients","July 2006 to June 2007","# of Clients","July 2007 to June 2008","# of Clients","July 2008 to June 2009","# of Clients","July 2009 to June 2010","# of Clients","July 2010 to June 2011","# of Clients","July 2011 to June 2012","# of Clients","July 2012 to June 2013","# of Clients","July 2013 to June 2014","# of Clients","July 2014 to June 2015","# of Clients","July 2015 to June 2016","# of Clients","July 2016 to June 2017","# of Clients","July 2017 to June 2018","# of Clients","July 2018 to June 2019","# of Clients","July 2019 to June 2020","# of Clients","July 2020 to June 2021","# of Clients","July 2021 to June 2022","# of Clients","July 2022 to June 2023","# of Clients"],"attributes":{"class":"d3graph","data-graph-desc":"This graph shows the change in clients assisted over time by ethnicity. There is an overall increase over time for all ethnic groups. The group with the largest client number is other, followed by M\u0101ori, then Pacific and East Asian. There is a big increase for other in 2009\/10, although this reduces in later years. The data is available in the table below. ","data-graph-render":"line","data-graph-type":"c3","data-graph-xaxis-height":"90","data-graph-xaxis-label":"Year","data-graph-xaxis-rotation":"-45","data-graph-yaxis-label":"Number of clients","data-graph-yaxis-max":"10000","id":"594b2990bfb2f"}}
** Please note the Asian category has been adjusted for data from 2020/21 onwards. Prior to this the category was East Asian and excluded some Asian ethnicities. This needs to be considered when comparing data from 2020/21 onwards with earlier data.
Clients Assisted, by Ethnicity (Excluding Brief Interventions)
Asian**
Māori
Other*
Pacific
Total
Table 4: Clients Assisted, by Ethnicity (Excluding Brief Interventions)
July 2004 to June 2005
# of Clients
119
872
2025
221
3237
% of Clients
3.7%
26.9%
62.6%
6.8%
100%
July 2005 to June 2006
# of Clients
183
950
1996
200
3329
% of Clients
5.5%
28.6%
59.9%
6.0%
100%
July 2006 to June 2007
# of Clients
271
1259
2499
242
4271
% of Clients
6.3%
29.5%
58.5%
5.7%
100%
July 2007 to June 2008
# of Clients
311
1387
2477
266
4441
% of Clients
7.0%
31.2%
55.8%
6.0%
100%
July 2008 to June 2009
# of Clients
399
2165
3017
434
6015
% of Clients
6.6%
36.0%
50.2%
7.2%
100%
July 2009 to June 2010
# of Clients
421
1955
3274
717
6367
% of Clients
6.6%
30.7%
51.4%
11.3%
100%
July 2010 to June 2011
# of Clients
369
1838
3105
820
6133
% of Clients
6.0%
30.0%
50.6%
13.4%
100%
July 2011 to June 2012
# of Clients
447
1897
3023
851
6218
% of Clients
7.2%
30.5%
48.6%
13.7%
100%
July 2012 to June 2013
# of Clients
428
2077
2835
1591
6931
% of Clients
6.2%
30.0%
40.9%
23.0%
100%
July 2013 to June 2014
# of Clients
474
2120
2942
1664
7200
% of Clients
6.6%
29.4%
40.9%
23.1%
100%
July 2014 to June 2015
# of Clients
477
2163
2974
1597
7211
% of Clients
6.6%
30.0%
41.2%
22.1%
100%
July 2015 to June 2016
# of Clients
521
2063
2531
1481
6596
% of Clients
7.9%
31.3%
38.4%
22.5%
100%
July 2016 to June 2017
# of Clients
482
2067
2390
1332
6271
% of Clients
7.7%
33.0%
38.1%
21.2%
100%
July 2017 to June 2018
# of Clients
466
1691
2142
1158
5457
% of Clients
8.5%
31.0%
39.3%
21.2%
100%
July 2018 to June 2019
# of Clients
442
1359
2135
920
4856
% of Clients
9.1%
28.0%
44.0%
18.9%
100%
July 2019 to June 2020
# of Clients
410
1125
2023
881
4439
% of Clients
9.2%
25.3%
45.6%
19.8%
100%
July 2020 to June 2021
# of Clients
803
1351
1757
851
4762
% of Clients
16.9%
28.4%
36.9%
17.9%
100%
July 2021 to June 2022
# of Clients
800
1292
1656
786
4534
% of Clients
17.6%
28.5%
36.5%
17.3%
100%
July 2022 to June 2023
# of Clients
711
1324
1639
737
4411
% of Clients
16.1%
30.0%
37.2%
16.7%
100%
{"id":"graph-594c8897b31c1","type":"c3","legend":["Asian**","M\u0101ori","Other*","Pacific"],"rows":[["July 2004 to June 2005","# of Clients","119","872","2025","221"],[],["July 2005 to June 2006","# of Clients","183","950","1996","200"],[],["July 2006 to June 2007","# of Clients","271","1259","2499","242"],[],["July 2007 to June 2008","# of Clients","311","1387","2477","266"],[],["July 2008 to June 2009","# of Clients","399","2165","3017","434"],[],["July 2009 to June 2010","# of Clients","421","1955","3274","717"],[],["July 2010 to June 2011","# of Clients","369","1838","3105","820"],[],["July 2011 to June 2012","# of Clients","447","1897","3023","851"],[],["July 2012 to June 2013","# of Clients","428","2077","2835","1591"],[],["July 2013 to June 2014","# of Clients","474","2120","2942","1664"],[],["July 2014 to June 2015","# of Clients","477","2163","2974","1597"],[],["July 2015 to June 2016","# of Clients","521","2063","2531","1481"],[],["July 2016 to June 2017","# of Clients","482","2067","2390","1332"],[],["July 2017 to June 2018","# of Clients","466","1691","2142","1158"],[],["July 2018 to June 2019","# of Clients","442","1359","2135","920"],[],["July 2019 to June 2020","# of Clients","410","1125","2023","881"],[],["July 2020 to June 2021","# of Clients","803","1351","1757","851"],[],["July 2021 to June 2022","# of Clients","800","1292","1656","786"],[],["July 2022 to June 2023","# of Clients","711","1324","1639","737"],[]],"rows_c3":[["Asian**","M\u0101ori","Other*","Pacific"],["119","872","2025","221"],[],["183","950","1996","200"],[],["271","1259","2499","242"],[],["311","1387","2477","266"],[],["399","2165","3017","434"],[],["421","1955","3274","717"],[],["369","1838","3105","820"],[],["447","1897","3023","851"],[],["428","2077","2835","1591"],[],["474","2120","2942","1664"],[],["477","2163","2974","1597"],[],["521","2063","2531","1481"],[],["482","2067","2390","1332"],[],["466","1691","2142","1158"],[],["442","1359","2135","920"],[],["410","1125","2023","881"],[],["803","1351","1757","851"],[],["800","1292","1656","786"],[],["711","1324","1639","737"],[]],"categories":["July 2004 to June 2005","# of Clients","July 2005 to June 2006","# of Clients","July 2006 to June 2007","# of Clients","July 2007 to June 2008","# of Clients","July 2008 to June 2009","# of Clients","July 2009 to June 2010","# of Clients","July 2010 to June 2011","# of Clients","July 2011 to June 2012","# of Clients","July 2012 to June 2013","# of Clients","July 2013 to June 2014","# of Clients","July 2014 to June 2015","# of Clients","July 2015 to June 2016","# of Clients","July 2016 to June 2017","# of Clients","July 2017 to June 2018","# of Clients","July 2018 to June 2019","# of Clients","July 2019 to June 2020","# of Clients","July 2020 to June 2021","# of Clients","July 2021 to June 2022","# of Clients","July 2022 to June 2023","# of Clients"],"attributes":{"class":"d3graph","data-graph-desc":"This graph shows the change in clients assisted over time by ethnicity, excluding brief interventions. There is an increase over time for all ethnic groups. The group with the largest client number is other, followed by M\u0101ori, then Pacific\/East Asian. The data is available in the table below. ","data-graph-render":"line","data-graph-type":"c3","data-graph-xaxis-height":"90","data-graph-xaxis-label":"Year","data-graph-xaxis-rotation":"-45","data-graph-yaxis-label":"Number of clients","data-graph-yaxis-max":"4500","data-graph-yaxis-min":"500","id":"594c8897b31c1"}}
** Please note the Asian category has been adjusted for data from 2020/21 onwards. Prior to this the category was East Asian and excluded some Asian ethnicities. This needs to be considered when comparing data from 2020/21 onwards with earlier data.
Clients that received only brief intervention services are excluded from this graph. Brief Intervention services are aimed at people who are at risk of gambling harm but are not actively seeking help. Further details about intervention types are available: Preventing and Minimising Gambling Harm: Practitioner’s Guide.
Table 5: Clients Assisted, by Gender (All Interventions)
July 2004 to June 2005
# of Clients
1590
1653
3243
% of Clients
49.0%
51.0%
100%
July 2005 to June 2006
# of Clients
1901
1801
3702
% of Clients
51.4%
48.6%
100%
July 2006 to June 2007
# of Clients
2834
2461
5295
% of Clients
53.5%
46.5%
100%
July 2007 to June 2008
# of Clients
3010
2700
5710
% of Clients
52.7%
47.3%
100%
July 2008 to June 2009
# of Clients
5309
4434
9743
% of Clients
54.5%
45.5%
100%
July 2009 to June 2010
# of Clients
6921
6323
13244
% of Clients
52.3%
47.7%
100%
July 2010 to June 2011
# of Clients
6337
5753
12090
% of Clients
52.4%
47.6%
100%
July 2011 to June 2012
# of Clients
6177
5670
11847
% of Clients
52.1%
47.9%
100%
July 2012 to June 2013
# of Clients
6631
5807
12438
% of Clients
53.3%
46.7%
100%
July 2013 to June 2014
# of Clients
6711
5916
12627
% of Clients
53.1%
46.9%
100%
July 2014 to June 2015
# of Clients
6758
5983
12741
% of Clients
53.0%
47.0%
100%
July 2015 to June 2016
# of Clients
6580
5840
12420
% of Clients
53.0%
47.0%
100%
July 2016 to June 2017
# of Clients
6017
5592
11609
% of Clients
51.8%
48.2%
100%
July 2017 to June 2018
# of Clients
5323
5232
10555
% of Clients
50.4%
49.6%
100%
July 2018 to June 2019
# of Clients
5209
5393
10602
% of Clients
49.1%
50.9%
100%
July 2019 to June 2020
# of Clients
4681
4821
9502
% of Clients
49.3%
50.7%
100%
July 2020 to June 2021
# of Clients
5401
5545
10946
% of Clients
49.3%
50.7%
100%
July 2021 to June 2022
# of Clients
4874
4809
9683
% of Clients
50.3%
49.7%
100%
July 2022 to June 2023
# of Clients
5082
5304
10386
% of Clients
48.9%
51.1%
100%
{"id":"graph-594c8bc64209d","type":"c3","legend":["Female","Male"],"rows":[["July 2004 to June 2005","# of Clients","1590","1653"],[],["July 2005 to June 2006","# of Clients","1901","1801"],[],["July 2006 to June 2007","# of Clients","2834","2461"],[],["July 2007 to June 2008","# of Clients","3010","2700"],[],["July 2008 to June 2009","# of Clients","5309","4434"],[],["July 2009 to June 2010","# of Clients","6921","6323"],[],["July 2010 to June 2011","# of Clients","6337","5753"],[],["July 2011 to June 2012","# of Clients","6177","5670"],[],["July 2012 to June 2013","# of Clients","6631","5807"],[],["July 2013 to June 2014","# of Clients","6711","5916"],[],["July 2014 to June 2015","# of Clients","6758","5983"],[],["July 2015 to June 2016","# of Clients","6580","5840"],[],["July 2016 to June 2017","# of Clients","6017","5592"],[],["July 2017 to June 2018","# of Clients","5323","5232"],[],["July 2018 to June 2019","# of Clients","5209","5393"],[],["July 2019 to June 2020","# of Clients","4681","4821"],[],["July 2020 to June 2021","# of Clients","5401","5545"],[],["July 2021 to June 2022","# of Clients","4874","4809"],[],["July 2022 to June 2023","# of Clients","5082","5304"],[]],"rows_c3":[["Female","Male"],["1590","1653"],[],["1901","1801"],[],["2834","2461"],[],["3010","2700"],[],["5309","4434"],[],["6921","6323"],[],["6337","5753"],[],["6177","5670"],[],["6631","5807"],[],["6711","5916"],[],["6758","5983"],[],["6580","5840"],[],["6017","5592"],[],["5323","5232"],[],["5209","5393"],[],["4681","4821"],[],["5401","5545"],[],["4874","4809"],[],["5082","5304"],[]],"categories":["July 2004 to June 2005","# of Clients","July 2005 to June 2006","# of Clients","July 2006 to June 2007","# of Clients","July 2007 to June 2008","# of Clients","July 2008 to June 2009","# of Clients","July 2009 to June 2010","# of Clients","July 2010 to June 2011","# of Clients","July 2011 to June 2012","# of Clients","July 2012 to June 2013","# of Clients","July 2013 to June 2014","# of Clients","July 2014 to June 2015","# of Clients","July 2015 to June 2016","# of Clients","July 2016 to June 2017","# of Clients","July 2017 to June 2018","# of Clients","July 2018 to June 2019","# of Clients","July 2019 to June 2020","# of Clients","July 2020 to June 2021","# of Clients","July 2021 to June 2022","# of Clients","July 2022 to June 2023","# of Clients"],"attributes":{"class":"d3graph","data-graph-desc":"This graph shows the number of clients assisted over time by gender. There are generally slightly more females assisted than males. The data is available in the table below. ","data-graph-render":"line","data-graph-type":"c3","data-graph-xaxis-height":"90","data-graph-xaxis-label":"Year","data-graph-xaxis-rotation":"-45","data-graph-yaxis-label":"Number of clients","data-graph-yaxis-max":"8500","data-graph-yaxis-min":"500","id":"594c8bc64209d"}}
Clients Assisted, by Gender (Excluding Brief Interventions)
Female
Male
Total
Table 6: Clients Assisted, by Gender (Excluding Brief Interventions)
July 2004 to June 2005
# of Clients
1585
1652
3237
% of Clients
49.0%
51.0%
100%
July 2005 to June 2006
# of Clients
1684
1645
3329
% of Clients
50.6%
49.4%
100%
July 2006 to June 2007
# of Clients
2182
2089
4271
% of Clients
51.1%
48.9%
100%
July 2007 to June 2008
# of Clients
2299
2142
4441
% of Clients
51.8%
48.2%
100%
July 2008 to June 2009
# of Clients
2999
3016
6015
% of Clients
49.9%
50.1%
100%
July 2009 to June 2010
# of Clients
2969
3398
6367
% of Clients
46.6%
53.4%
100%
July 2010 to June 2011
# of Clients
2967
3166
6133
% of Clients
48.4%
51.6%
100%
July 2011 to June 2012
# of Clients
2995
3223
6218
% of Clients
48.2%
51.8%
100%
July 2012 to June 2013
# of Clients
3377
3554
6931
% of Clients
48.7%
51.3%
100%
July 2013 to June 2014
# of Clients
3579
3621
7200
% of Clients
49.7%
50.3%
100%
July 2014 to June 2015
# of Clients
3435
3776
7211
% of Clients
47.6%
52.4%
100%
July 2015 to June 2016
# of Clients
3218
3378
6596
% of Clients
48.8%
51.2%
100%
July 2016 to June 2017
# of Clients
2944
3327
6271
% of Clients
46.9%
53.1%
100%
July 2017 to June 2018
# of Clients
2394
3063
5457
% of Clients
43.9%
56.1%
100%
July 2018 to June 2019
# of Clients
1996
2860
4856
% of Clients
41.1%
58.9%
100%
July 2019 to June 2020
# of Clients
1749
2690
4439
% of Clients
39.4%
60.6%
100%
July 2020 to June 2021
# of Clients
1844
2918
4762
% of Clients
38.7%
61.3%
100%
July 2021 to June 2022
# of Clients
1957
2577
4534
% of Clients
43.2%
56.8%
100%
July 2022 to June 2023
# of Clients
1749
2662
4411
% of Clients
39.7%
60.3%
100%
{"id":"graph-594c8e41566cc","type":"c3","legend":["Female","Male"],"rows":[["July 2004 to June 2005","# of Clients","1585","1652"],[],["July 2005 to June 2006","# of Clients","1684","1645"],[],["July 2006 to June 2007","# of Clients","2182","2089"],[],["July 2007 to June 2008","# of Clients","2299","2142"],[],["July 2008 to June 2009","# of Clients","2999","3016"],[],["July 2009 to June 2010","# of Clients","2969","3398"],[],["July 2010 to June 2011","# of Clients","2967","3166"],[],["July 2011 to June 2012","# of Clients","2995","3223"],[],["July 2012 to June 2013","# of Clients","3377","3554"],[],["July 2013 to June 2014","# of Clients","3579","3621"],[],["July 2014 to June 2015","# of Clients","3435","3776"],[],["July 2015 to June 2016","# of Clients","3218","3378"],[],["July 2016 to June 2017","# of Clients","2944","3327"],[],["July 2017 to June 2018","# of Clients","2394","3063"],[],["July 2018 to June 2019","# of Clients","1996","2860"],[],["July 2019 to June 2020","# of Clients","1749","2690"],[],["July 2020 to June 2021","# of Clients","1844","2918"],[],["July 2021 to June 2022","# of Clients","1957","2577"],[],["July 2022 to June 2023","# of Clients","1749","2662"],[]],"rows_c3":[["Female","Male"],["1585","1652"],[],["1684","1645"],[],["2182","2089"],[],["2299","2142"],[],["2999","3016"],[],["2969","3398"],[],["2967","3166"],[],["2995","3223"],[],["3377","3554"],[],["3579","3621"],[],["3435","3776"],[],["3218","3378"],[],["2944","3327"],[],["2394","3063"],[],["1996","2860"],[],["1749","2690"],[],["1844","2918"],[],["1957","2577"],[],["1749","2662"],[]],"categories":["July 2004 to June 2005","# of Clients","July 2005 to June 2006","# of Clients","July 2006 to June 2007","# of Clients","July 2007 to June 2008","# of Clients","July 2008 to June 2009","# of Clients","July 2009 to June 2010","# of Clients","July 2010 to June 2011","# of Clients","July 2011 to June 2012","# of Clients","July 2012 to June 2013","# of Clients","July 2013 to June 2014","# of Clients","July 2014 to June 2015","# of Clients","July 2015 to June 2016","# of Clients","July 2016 to June 2017","# of Clients","July 2017 to June 2018","# of Clients","July 2018 to June 2019","# of Clients","July 2019 to June 2020","# of Clients","July 2020 to June 2021","# of Clients","July 2021 to June 2022","# of Clients","July 2022 to June 2023","# of Clients"],"attributes":{"class":"d3graph","data-graph-desc":"This graph shows the number of clients assisted over time by gender, excluding brief interventions. There are generally slightly more males assisted than females. The data is available in the table below. ","data-graph-render":"line","data-graph-type":"c3","data-graph-xaxis-height":"90","data-graph-xaxis-label":"Year","data-graph-xaxis-rotation":"-45","data-graph-yaxis-label":"Number of clients","data-graph-yaxis-max":"4500","data-graph-yaxis-min":"1300","id":"594c8e41566cc"}}
Clients that received only brief intervention services are excluded from this graph. Brief Intervention services are aimed at people who are at risk of gambling harm but are not actively seeking help. Further details about intervention types are available: Preventing and Minimising Gambling Harm: Practitioner’s Guide.
Clients Assisted, by Client Type (All Interventions)
Family/affected other
Gambler
Total
Table 7: Clients Assisted, by Client Type (All Interventions)
July 2004 to June 2005
# of Clients
285
2958
3243
% of Clients
8.8%
91.2%
100%
July 2005 to June 2006
# of Clients
751
2951
3702
% of Clients
20.3%
79.7%
100%
July 2006 to June 2007
# of Clients
1529
3766
5295
% of Clients
28.9%
71.1%
100%
July 2007 to June 2008
# of Clients
1903
3807
5710
% of Clients
33.3%
66.7%
100%
July 2008 to June 2009
# of Clients
3303
6440
9743
% of Clients
33.9%
66.1%
100%
July 2009 to June 2010
# of Clients
3624
9620
13244
% of Clients
27.4%
72.6%
100%
July 2010 to June 2011
# of Clients
4496
7594
12090
% of Clients
37.2%
62.8%
100%
July 2011 to June 2012
# of Clients
4807
7040
11847
% of Clients
40.6%
59.4%
100%
July 2012 to June 2013
# of Clients
5513
6925
12438
% of Clients
44.3%
55.7%
100%
July 2013 to June 2014
# of Clients
5696
6931
12627
% of Clients
45.1%
54.9%
100%
July 2014 to June 2015
# of Clients
5957
6784
12741
% of Clients
46.8%
53.2%
100%
July 2015 to June 2016
# of Clients
5755
6665
12420
% of Clients
46.3%
53.7%
100%
July 2016 to June 2017
# of Clients
5501
6108
11609
% of Clients
47.4%
52.6%
100%
July 2017 to June 2018
# of Clients
4597
5958
10555
% of Clients
43.6%
56.4%
100%
July 2018 to June 2019
# of Clients
4417
6185
10602
% of Clients
41.7%
58.3%
100%
July 2019 to June 2020
# of Clients
3952
5550
9502
% of Clients
41.6%
58.4%
100%
July 2020 to June 2021
# of Clients
4341
6605
10946
% of Clients
39.7%
60.3%
100%
July 2021 to June 2022
# of Clients
3472
6211
9683
% of Clients
35.9%
64.1%
100%
July 2022 to June 2023
# of Clients
3870
6516
10386
% of Clients
37.3%
62.7%
100%
{"id":"graph-594c90ab6ac46","type":"c3","legend":["Family\/affected other","Gambler"],"rows":[["July 2004 to June 2005","# of Clients","285","2958"],[],["July 2005 to June 2006","# of Clients","751","2951"],[],["July 2006 to June 2007","# of Clients","1529","3766"],[],["July 2007 to June 2008","# of Clients","1903","3807"],[],["July 2008 to June 2009","# of Clients","3303","6440"],[],["July 2009 to June 2010","# of Clients","3624","9620"],[],["July 2010 to June 2011","# of Clients","4496","7594"],[],["July 2011 to June 2012","# of Clients","4807","7040"],[],["July 2012 to June 2013","# of Clients","5513","6925"],[],["July 2013 to June 2014","# of Clients","5696","6931"],[],["July 2014 to June 2015","# of Clients","5957","6784"],[],["July 2015 to June 2016","# of Clients","5755","6665"],[],["July 2016 to June 2017","# of Clients","5501","6108"],[],["July 2017 to June 2018","# of Clients","4597","5958"],[],["July 2018 to June 2019","# of Clients","4417","6185"],[],["July 2019 to June 2020","# of Clients","3952","5550"],[],["July 2020 to June 2021","# of Clients","4341","6605"],[],["July 2021 to June 2022","# of Clients","3472","6211"],[],["July 2022 to June 2023","# of Clients","3870","6516"],[]],"rows_c3":[["Family\/affected other","Gambler"],["285","2958"],[],["751","2951"],[],["1529","3766"],[],["1903","3807"],[],["3303","6440"],[],["3624","9620"],[],["4496","7594"],[],["4807","7040"],[],["5513","6925"],[],["5696","6931"],[],["5957","6784"],[],["5755","6665"],[],["5501","6108"],[],["4597","5958"],[],["4417","6185"],[],["3952","5550"],[],["4341","6605"],[],["3472","6211"],[],["3870","6516"],[]],"categories":["July 2004 to June 2005","# of Clients","July 2005 to June 2006","# of Clients","July 2006 to June 2007","# of Clients","July 2007 to June 2008","# of Clients","July 2008 to June 2009","# of Clients","July 2009 to June 2010","# of Clients","July 2010 to June 2011","# of Clients","July 2011 to June 2012","# of Clients","July 2012 to June 2013","# of Clients","July 2013 to June 2014","# of Clients","July 2014 to June 2015","# of Clients","July 2015 to June 2016","# of Clients","July 2016 to June 2017","# of Clients","July 2017 to June 2018","# of Clients","July 2018 to June 2019","# of Clients","July 2019 to June 2020","# of Clients","July 2020 to June 2021","# of Clients","July 2021 to June 2022","# of Clients","July 2022 to June 2023","# of Clients"],"attributes":{"class":"d3graph","data-graph-desc":"This graph shows the number of clients assisted over time by client type. There are more gamblers assisted than their family members\/other affected people. Family members shows a fairly steady increase over time, while for gamblers there is a big jump in 2008\/09 and 2009\/10, and an increase in the years after that The data is available in the table below. ","data-graph-render":"line","data-graph-type":"c3","data-graph-xaxis-height":"90","data-graph-xaxis-label":"Year","data-graph-xaxis-rotation":"-45","data-graph-yaxis-label":"Number of clients","data-graph-yaxis-min":"500","id":"594c90ab6ac46"}}
Clients Assisted, by Client Type (Excluding Brief Interventions)
Family/affected other
Gambler
Total
Table 8: Clients Assisted, by Client Type (Excluding Brief Interventions)
July 2004 to June 2005
# of Clients
281
2956
3237
% of Clients
8.7%
91.3%
100%
July 2005 to June 2006
# of Clients
640
2689
3329
% of Clients
19.2%
80.8%
100%
July 2006 to June 2007
# of Clients
1111
3160
4271
% of Clients
26.0%
74.0%
100%
July 2007 to June 2008
# of Clients
1149
3292
4441
% of Clients
25.9%
74.1%
100%
July 2008 to June 2009
# of Clients
1778
4237
6015
% of Clients
29.6%
70.4%
100%
July 2009 to June 2010
# of Clients
1662
4705
6367
% of Clients
26.1%
73.9%
100%
July 2010 to June 2011
# of Clients
1525
4608
6133
% of Clients
24.9%
75.1%
100%
July 2011 to June 2012
# of Clients
1561
4657
6218
% of Clients
25.1%
74.9%
100%
July 2012 to June 2013
# of Clients
2049
4882
6931
% of Clients
29.6%
70.4%
100%
July 2013 to June 2014
# of Clients
2264
4936
7200
% of Clients
31.4%
68.6%
100%
July 2014 to June 2015
# of Clients
2241
4970
7211
% of Clients
31.1%
68.9%
100%
July 2015 to June 2016
# of Clients
2180
4416
6596
% of Clients
33.1%
66.9%
100%
July 2016 to June 2017
# of Clients
1986
4285
6271
% of Clients
31.7%
68.3%
100%
July 2017 to June 2018
# of Clients
1370
4087
5457
% of Clients
25.1%
74.9%
100%
July 2018 to June 2019
# of Clients
1089
3767
4856
% of Clients
22.4%
77.6%
100%
July 2019 to June 2020
# of Clients
969
3470
4439
% of Clients
21.8%
78.2%
100%
July 2020 to June 2021
# of Clients
1002
3760
4762
% of Clients
21.0%
79.0%
100%
July 2021 to June 2022
# of Clients
995
3539
4534
% of Clients
21.9%
78.1%
100%
July 2022 to June 2023
# of Clients
968
3443
4411
% of Clients
21.9%
78.1%
100%
{"id":"graph-594c93d4bf88d","type":"c3","legend":["Family\/affected other","Gambler"],"rows":[["July 2004 to June 2005","# of Clients","281","2956"],[],["July 2005 to June 2006","# of Clients","640","2689"],[],["July 2006 to June 2007","# of Clients","1111","3160"],[],["July 2007 to June 2008","# of Clients","1149","3292"],[],["July 2008 to June 2009","# of Clients","1778","4237"],[],["July 2009 to June 2010","# of Clients","1662","4705"],[],["July 2010 to June 2011","# of Clients","1525","4608"],[],["July 2011 to June 2012","# of Clients","1561","4657"],[],["July 2012 to June 2013","# of Clients","2049","4882"],[],["July 2013 to June 2014","# of Clients","2264","4936"],[],["July 2014 to June 2015","# of Clients","2241","4970"],[],["July 2015 to June 2016","# of Clients","2180","4416"],[],["July 2016 to June 2017","# of Clients","1986","4285"],[],["July 2017 to June 2018","# of Clients","1370","4087"],[],["July 2018 to June 2019","# of Clients","1089","3767"],[],["July 2019 to June 2020","# of Clients","969","3470"],[],["July 2020 to June 2021","# of Clients","1002","3760"],[],["July 2021 to June 2022","# of Clients","995","3539"],[],["July 2022 to June 2023","# of Clients","968","3443"],[]],"rows_c3":[["Family\/affected other","Gambler"],["281","2956"],[],["640","2689"],[],["1111","3160"],[],["1149","3292"],[],["1778","4237"],[],["1662","4705"],[],["1525","4608"],[],["1561","4657"],[],["2049","4882"],[],["2264","4936"],[],["2241","4970"],[],["2180","4416"],[],["1986","4285"],[],["1370","4087"],[],["1089","3767"],[],["969","3470"],[],["1002","3760"],[],["995","3539"],[],["968","3443"],[]],"categories":["July 2004 to June 2005","# of Clients","July 2005 to June 2006","# of Clients","July 2006 to June 2007","# of Clients","July 2007 to June 2008","# of Clients","July 2008 to June 2009","# of Clients","July 2009 to June 2010","# of Clients","July 2010 to June 2011","# of Clients","July 2011 to June 2012","# of Clients","July 2012 to June 2013","# of Clients","July 2013 to June 2014","# of Clients","July 2014 to June 2015","# of Clients","July 2015 to June 2016","# of Clients","July 2016 to June 2017","# of Clients","July 2017 to June 2018","# of Clients","July 2018 to June 2019","# of Clients","July 2019 to June 2020","# of Clients","July 2020 to June 2021","# of Clients","July 2021 to June 2022","# of Clients","July 2022 to June 2023","# of Clients"],"attributes":{"class":"d3graph","data-graph-desc":"This graph shows the number of clients assisted over time by client type, excluding brief interventions. There are more gamblers assisted than their family members\/other affected people. The increases over time are not as steep as for when brief interventions are included. The data is available in the table below. ","data-graph-render":"line","data-graph-type":"c3","data-graph-xaxis-height":"90","data-graph-xaxis-label":"Year","data-graph-xaxis-rotation":"-45","data-graph-yaxis-label":"Number of clients","data-graph-yaxis-max":"7000","data-graph-yaxis-min":"500","id":"594c93d4bf88d"}}
Clients that received only brief intervention services are excluded from this graph. Brief Intervention services are aimed at people who are at risk of gambling harm but are not actively seeking help. Further details about intervention types are available: Preventing and Minimising Gambling Harm: Practitioner’s Guide.
Table 11: Problem gambling client presentation data. Provides information on client presentation numbers, both new and existing clients, by gambling industry sector, for the 2004/05 to 2022/23 Financial Years
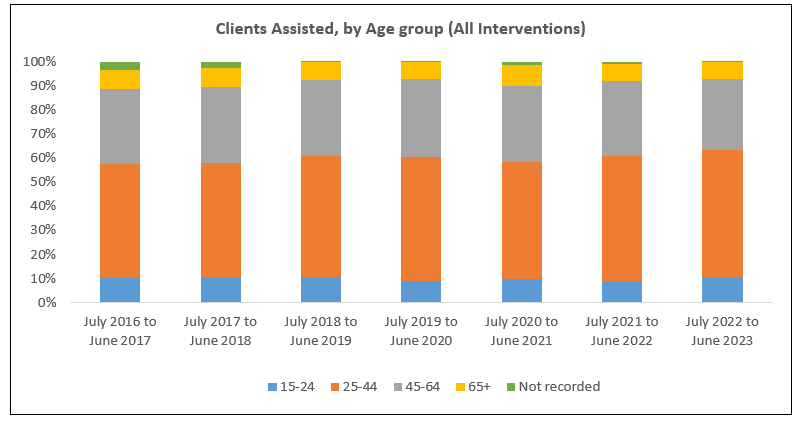
Table 12: Clients Assisted, by Age group and client type (All Interventions)
*Note age is not required to be captured for clients with brief only interventions.
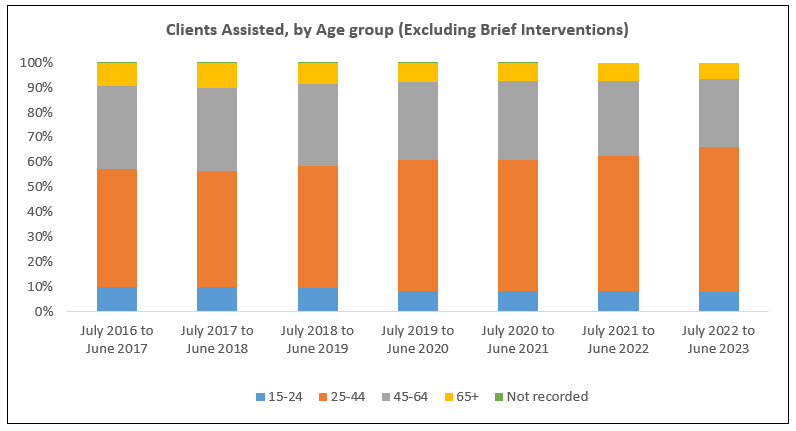
Table 13: Clients Assisted, by Age group and client type (Excluding Brief Interventions)
Note: these graphs are not interactive.
Clients that received only brief intervention services are excluded from this graph. Brief Intervention services are aimed at people who are at risk of gambling harm but are not actively seeking help. Further details about intervention types are available: Preventing and Minimising Gambling Harm: Practitioner’s Guide.